Generate knowledge graphs with interesting geometries, like lattices

Overview

Geometric Graphs

Tests Cookiecutter template from @cthoyt PyPI PyPI - Python Version PyPI - License Documentation Status Code style: black

Generate knowledge graphs with interesting geometries, like lattices. Works on Python 3.9+ because it uses cool new features. Get out of that 2020 funk and install the most recent version of Python.

💪 Getting Started

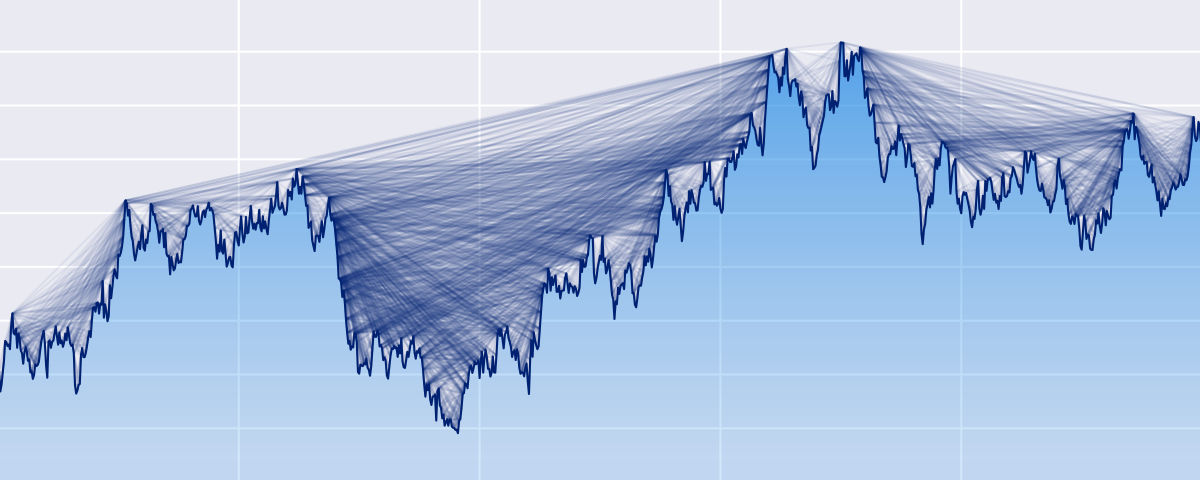
See https://github.com/cthoyt/translational-toys for example usage to generate charts like

.

🚀 Installation

The most recent release can be installed from PyPI with:

$ pip install geometric_graphs

The most recent code and data can be installed directly from GitHub with:

$ pip install git+https://github.com/cthoyt/geometric-graphs.git

To install in development mode, use the following:

$ git clone git+https://github.com/cthoyt/geometric-graphs.git
$ cd geometric-graphs
$ pip install -e .

👐 Contributing

Contributions, whether filing an issue, making a pull request, or forking, are appreciated. See CONTRIBUTING.rst for more information on getting involved.

👋 Attribution

⚖️ License

The code in this package is licensed under the MIT License.

🍪 Cookiecutter

This package was created with @audreyfeldroy's cookiecutter package using @cthoyt's cookiecutter-snekpack template.

🛠️ For Developers

See developer instrutions

The final section of the README is for if you want to get involved by making a code contribution.

Testing

After cloning the repository and installing tox with pip install tox, the unit tests in the tests/ folder can be run reproducibly with:

$ tox

Additionally, these tests are automatically re-run with each commit in a GitHub Action.

📦 Making a Release

After installing the package in development mode and installing tox with pip install tox, the commands for making a new release are contained within the finish environment in tox.ini. Run the following from the shell:

$ tox -e finish

This script does the following:

  1. Uses BumpVersion to switch the version number in the setup.cfg and src/geometric_graphs/version.py to not have the -dev suffix
  2. Packages the code in both a tar archive and a wheel
  3. Uploads to PyPI using twine. Be sure to have a .pypirc file configured to avoid the need for manual input at this step
  4. Push to GitHub. You'll need to make a release going with the commit where the version was bumped.
  5. Bump the version to the next patch. If you made big changes and want to bump the version by minor, you can use tox -e bumpversion minor after.
You might also like...
Here are my graphs for hw_02

Let's Have A Look At Some Graphs! Graph 1: State Mentions in Congressperson's Tweets on 10/01/2017 The graph below uses this data set to demonstrate h

Python ts2vg package provides high-performance algorithm implementations to build visibility graphs from time series data.

ts2vg: Time series to visibility graphs The Python ts2vg package provides high-performance algorithm implementations to build visibility graphs from t

 Flame Graphs visualize profiled code
Flame Graphs visualize profiled code

Flame Graphs visualize profiled code

A simple interpreted language for creating basic mathematical graphs.

graphr Introduction graphr is a small language written to create basic mathematical graphs. It is an interpreted language written in python and essent

Mapomatic - Automatic mapping of compiled circuits to low-noise sub-graphs

mapomatic Automatic mapping of compiled circuits to low-noise sub-graphs Overvie

In-memory Graph Database and Knowledge Graph with Natural Language Interface, compatible with Pandas

CogniPy for Pandas - In-memory Graph Database and Knowledge Graph with Natural Language Interface Whats in the box Reasoning, exploration of RDF/OWL,

A command line tool for visualizing CSV/spreadsheet-like data

PerfPlotter Read data from CSV files using pandas and generate interactive plots using bokeh, which can then be embedded into HTML pages and served by

Tools for calculating and visualizing Elo-like ratings of MLB teams using Retosheet data

Overview This project uses historical baseball games data to calculate an Elo-like rating for MLB teams based on regular season match ups. The Elo rat

This project is an Algorithm Visualizer where a user can visualize algorithms like Bubble Sort, Merge Sort, Quick Sort, Selection Sort, Linear Search and Binary Search.

Algo_Visualizer This project is an Algorithm Visualizer where a user can visualize common algorithms like "Bubble Sort", "Merge Sort", "Quick Sort", "

Owner
Charles Tapley Hoyt
Bio/cheminformatician, open scientist, maintainer of @pybel and @pykeen, part of @indralab (he/him)
Charles Tapley Hoyt
HM02: Visualizing Interesting Datasets

HM02: Visualizing Interesting Datasets This is a homework assignment for CSCI 40 class at Claremont McKenna College. Go to the project page to learn m

Qiaoling Chen 11 Oct 26, 2021
HW 2: Visualizing interesting datasets

HW 2: Visualizing interesting datasets Check out the project instructions here! Mean Earnings per Hour for Males and Females My first graph uses data

null 7 Oct 27, 2021
Generate graphs with NetworkX, natively visualize with D3.js and pywebview

webview_d3 This is some PoC code to render graphs created with NetworkX natively using D3.js and pywebview. The main benifit of this approac

byt3bl33d3r 68 Aug 18, 2022
BGraph is a tool designed to generate dependencies graphs from Android.bp soong files.

BGraph BGraph is a tool designed to generate dependencies graphs from Android.bp soong files. Overview BGraph (for Build-Graphs) is a project aimed at

Quarkslab 10 Dec 19, 2022
Generate a roam research like Network Graph view from your Notion pages.

Notion Graph View Export Notion pages to a Roam Research like graph view.

Steve Sun 214 Jan 7, 2023
Draw interactive NetworkX graphs with Altair

nx_altair Draw NetworkX graphs with Altair nx_altair offers a similar draw API to NetworkX but returns Altair Charts instead. If you'd like to contrib

Zachary Sailer 206 Dec 12, 2022
Draw interactive NetworkX graphs with Altair

nx_altair Draw NetworkX graphs with Altair nx_altair offers a similar draw API to NetworkX but returns Altair Charts instead. If you'd like to contrib

Zachary Sailer 156 Feb 6, 2021
By default, networkx has problems with drawing self-loops in graphs.

By default, networkx has problems with drawing self-loops in graphs. It makes it hard to draw a graph with self-loops or to make a nicely looking chord diagram. This repository provides some code to draw self-loops nicely

Vladimir Shitov 5 Jan 6, 2022
Personal IMDB Graphs with Bokeh

Personal IMDB Graphs with Bokeh Do you like watching movies and also rate all of them in IMDB? Would you like to look at your IMDB stats based on your

null 2 Dec 15, 2021
A D3.js plugin that produces flame graphs from hierarchical data.

d3-flame-graph A D3.js plugin that produces flame graphs from hierarchical data. If you don't know what flame graphs are, check Brendan Gregg's post.

Martin Spier 740 Dec 29, 2022