Here are my graphs for hw_02

Overview

Let's Have A Look At Some Graphs!

Graph 1: State Mentions in Congressperson's Tweets on 10/01/2017

The graph below uses this data set to demonstrate how many times the states California, New York, Texas, DC, and Florida were mentioned by Congresspeople in their tweets on a single day in October, 2017. The reason I chose to make this graph was to find out which of these oft mentioned states was going through controversy during this period of time. As demonstrated below, Florida was the most mentioned state, followed closely by California. The lowest number of mentions was surprisingly New York.

Graph of State Mentions

Graph 2: Percentages of Male and Female Congresspeople

The graph below uses data set 1 and data set 2 to show the stark gender differences in both houses of Congress. As expected, there is very little doubt that the percent of females relative to the percent of males is very low. This is known data, however, and efforts to increase female representation in Congress are ongoing and achieving success.

Graph of Gender Percentages

The link to the instructions is here.

You might also like...
 Flame Graphs visualize profiled code
Flame Graphs visualize profiled code

Flame Graphs visualize profiled code

A simple interpreted language for creating basic mathematical graphs.

graphr Introduction graphr is a small language written to create basic mathematical graphs. It is an interpreted language written in python and essent

Mapomatic - Automatic mapping of compiled circuits to low-noise sub-graphs

mapomatic Automatic mapping of compiled circuits to low-noise sub-graphs Overvie

Kglab - an abstraction layer in Python for building knowledge graphs

Graph Data Science: an abstraction layer in Python for building knowledge graphs, integrated with popular graph libraries – atop Pandas, RDFlib, pySHACL, RAPIDS, NetworkX, iGraph, PyVis, pslpython, pyarrow, etc.

HW_02 Data visualisation task

HW_02 Data visualisation and Matplotlib practice Instructions for HW_02 Idea for data analysis As I was brainstorming ideas and running through databa

Software to automate the management and configuration of any infrastructure or application at scale. Get access to the Salt software package repository here:

Latest Salt Documentation Open an issue (bug report, feature request, etc.) Salt is the world’s fastest, most intelligent and scalable automation engi

A faster and highly-compatible implementation of the Python programming language. The code here is out of date, please follow our blog

Pyston is a faster and highly-compatible implementation of the Python programming language. Version 2 is currently closed source, but you can find the

The Social-Engineer Toolkit (SET) repository from TrustedSec - All new versions of SET will be deployed here.

💼 The Social-Engineer Toolkit (SET) 💼 Copyright 2020 The Social-Engineer Toolkit (SET) Written by: David Kennedy (ReL1K) @HackingDave Company: Trust

GitHub repository for the SecureDrop whistleblower platform. Do not submit tips here!

SecureDrop is an open-source whistleblower submission system that media organizations can use to securely accept documents from, and communicate with

CDIoU and CDIoU loss is like a convenient plug-in that can be used in multiple models. CDIoU and CDIoU loss have different excellent performances in several models such as Faster R-CNN, YOLOv4, RetinaNet and . There is a maximum AP improvement of 1.9% and an average AP of 0.8% improvement on MS COCO dataset, compared to traditional evaluation-feedback modules. Here we just use as an example to illustrate the code.
👀 nothing to see here

Woofy Woofy is blue dog companion token of YFI (Wifey) It utilizes a special Woof bonding curve which allows two-way conversion between the tokens. Th

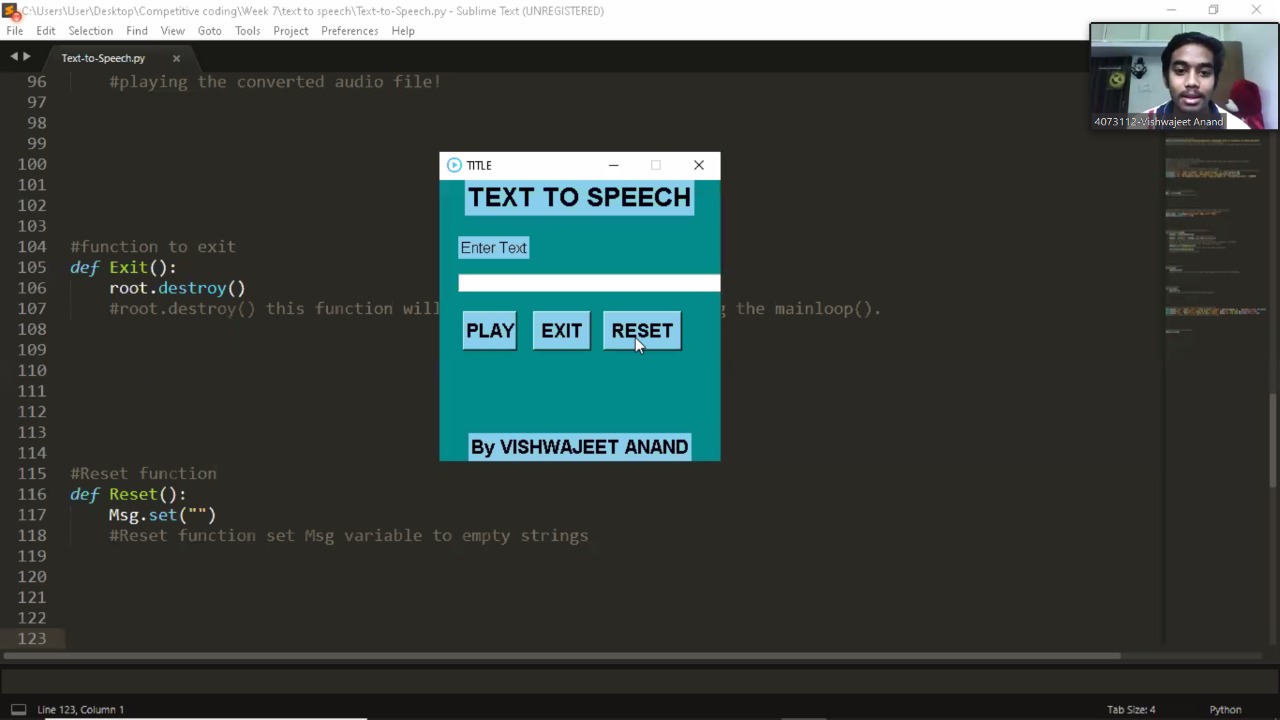
Ever felt tired after preprocessing the dataset, and not wanting to write any code further to train your model? Ever encountered a situation where you wanted to record the hyperparameters of the trained model and able to retrieve it afterward? Models Playground is here to help you do that. Models playground allows you to train your models right from the browser. Text to speech is a process to convert any text into voice. Text to speech project takes words on digital devices and convert them into audio. Here I have used Google-text-to-speech library popularly known as gTTS library to convert text file to .mp3 file. Hope you like my project!
Automate your google form here!

Google Form Filler (GFF) - Automate your google form here! About The idea of this project came from my online lectures as one of my professors takes a

Simple streamlit app to demonstrate HERE Tour Planning

Table of Contents About the Project Built With Getting Started Prerequisites Installation Usage Roadmap Contributing License Acknowledgements About Th

Here is my Senior Design Project that I implemented to graduate from Computer Engineering.

Here is my Senior Design Project that I implemented to graduate from Computer Engineering. It is a chatbot made in RASA and helps the user to plan their vacation in the Turkish language. In order to plan the user's vacation, it provides reservations by asking various questions for hotel, flight, or event.

Here is the implementation of our paper S2VC: A Framework for Any-to-Any Voice Conversion with Self-Supervised Pretrained Representations.

S2VC Here is the implementation of our paper S2VC: A Framework for Any-to-Any Voice Conversion with Self-Supervised Pretrained Representations. In thi

Submit issues and feature requests for our API here.

AIx GPT API Submit issues and feature requests for our API here. See https://apps.aixsolutionsgroup.com for more info. Python Quick Start pip install

Owner
null
Here I plotted data for the average test scores across schools and class sizes across school districts.

HW_02 Here I plotted data for the average test scores across schools and class sizes across school districts. Average Test Score by Race This graph re

null 7 Oct 27, 2021
Draw interactive NetworkX graphs with Altair

nx_altair Draw NetworkX graphs with Altair nx_altair offers a similar draw API to NetworkX but returns Altair Charts instead. If you'd like to contrib

Zachary Sailer 206 Dec 12, 2022
Draw interactive NetworkX graphs with Altair

nx_altair Draw NetworkX graphs with Altair nx_altair offers a similar draw API to NetworkX but returns Altair Charts instead. If you'd like to contrib

Zachary Sailer 156 Feb 6, 2021
Generate graphs with NetworkX, natively visualize with D3.js and pywebview

webview_d3 This is some PoC code to render graphs created with NetworkX natively using D3.js and pywebview. The main benifit of this approac

byt3bl33d3r 68 Aug 18, 2022
BGraph is a tool designed to generate dependencies graphs from Android.bp soong files.

BGraph BGraph is a tool designed to generate dependencies graphs from Android.bp soong files. Overview BGraph (for Build-Graphs) is a project aimed at

Quarkslab 10 Dec 19, 2022
By default, networkx has problems with drawing self-loops in graphs.

By default, networkx has problems with drawing self-loops in graphs. It makes it hard to draw a graph with self-loops or to make a nicely looking chord diagram. This repository provides some code to draw self-loops nicely

Vladimir Shitov 5 Jan 6, 2022
Personal IMDB Graphs with Bokeh

Personal IMDB Graphs with Bokeh Do you like watching movies and also rate all of them in IMDB? Would you like to look at your IMDB stats based on your

null 2 Dec 15, 2021
A D3.js plugin that produces flame graphs from hierarchical data.

d3-flame-graph A D3.js plugin that produces flame graphs from hierarchical data. If you don't know what flame graphs are, check Brendan Gregg's post.

Martin Spier 740 Dec 29, 2022
Generate knowledge graphs with interesting geometries, like lattices

Geometric Graphs Generate knowledge graphs with interesting geometries, like lattices. Works on Python 3.9+ because it uses cool new features. Get out

Charles Tapley Hoyt 5 Jan 3, 2022
Python ts2vg package provides high-performance algorithm implementations to build visibility graphs from time series data.

ts2vg: Time series to visibility graphs The Python ts2vg package provides high-performance algorithm implementations to build visibility graphs from t

Carlos Bergillos 26 Dec 17, 2022