A simple agent-based model used to teach the basics of OOP in my lectures

Overview

Pydemic

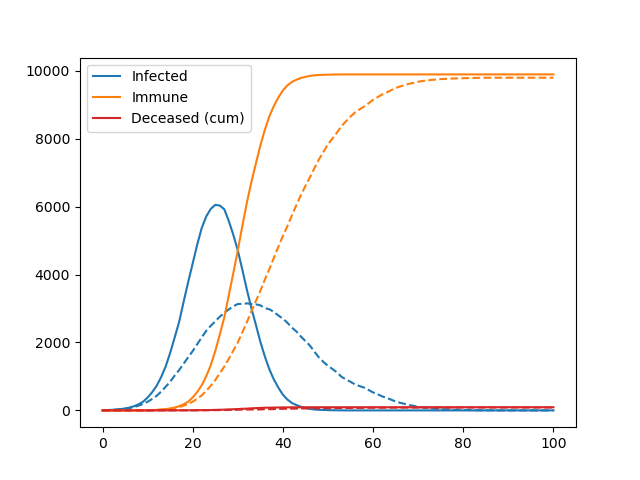
A simple agent-based model of a pandemic.

This is used to teach basic principles of object-oriented programming to master students.

It is not at all optimized for performance and does not have any predictive skill.

Based on an original idea by Georg Wohlfahrt.

image

Rules

We are simulating a square 2-dimensional (nx x nx pixel) domain which is populated by a maximum number of agents (na), i.e. human individuals. The initial position of the agents on the domain is determined with a pseudo-random number generator. Two or more agents may populate the same pixel.

The simulation runs to a maximum of nt time steps. During every time step each agent may move a maximum number of pixels in the horizontal (x) and vertical (y) direction, as determined by the movemax parameter. If movemax = 2, this means that agents may move between -2 and +2 pixels in the x/y-direction – the actual number of moves within these limits is again determined with the random number generator.

If the random moves would cause an agent to leave the domain, the agent is perfectly “reflected” into the domain, i.e. if a random move would bring an agent to the position nx + 2, the position is corrected to nx – 2.

At the start of the simulation, a number n_initial_infected of randomly selected agents carries the virus.

If two or more agents meet on the same pixel and at least one of them is infected there is a certain probability (probability_of_infection) that non-infected, non-immune agents become infected. This dice roll is repeated for each infected agent at this location.

If infected, agents remain infectious until they recover (time_until_recovery). At the end of the infection period, there is also some probability that agents do not recover, but instead decease (mortality_rate), which reduces the total number of agents on the domain. After recovery, the past infection conveys immunity from another infection.

Potential improvements

There are many. See exercises on the topic.

Getting started

Download the code and run pydemic.py in the terminal or in the ipython interpreter.

TODO Fabien

  • Write tests.
  • Add a visualisation of the spatial domain (with density plots or similar).
You might also like...
Simple and lightweight Spotify Overlay written in Python.

Simple Spotify Overlay This is a simple yet powerful Spotify Overlay. About I have been looking for something like this ever since I got Spotify. I th

This is a Cross-Platform Plot Manager for Chia Plotting that is simple, easy-to-use, and reliable.

Swar's Chia Plot Manager A plot manager for Chia plotting: https://www.chia.net/ Development Version: v0.0.1 This is a cross-platform Chia Plot Manage

Lumen provides a framework for visual analytics, which allows users to build data-driven dashboards from a simple yaml specification

Lumen project provides a framework for visual analytics, which allows users to build data-driven dashboards from a simple yaml specification

Simple Python interface for Graphviz

Simple Python interface for Graphviz

PyPassword is a simple follow up to PyPassphrase

PyPassword PyPassword is a simple follow up to PyPassphrase. After finishing that project it occured to me that while some may wish to use that option

Simple python implementation with matplotlib to manually fit MIST isochrones to Gaia DR2 color-magnitude diagrams

Simple python implementation with matplotlib to manually fit MIST isochrones to Gaia DR2 color-magnitude diagrams

Yata is a fast, simple and easy Data Visulaization tool, running on python dash

Yata is a fast, simple and easy Data Visulaization tool, running on python dash. The main goal of Yata is to provide a easy way for persons with little programming knowledge to visualize their data easily.

A simple python tool for explore your object detection dataset

A simple tool for explore your object detection dataset. The goal of this library is to provide simple and intuitive visualizations from your dataset and automatically find the best parameters for generating a specific grid of anchors that can fit you data characteristics

A deceptively simple plotting library for Streamlit

🍅 Plost A deceptively simple plotting library for Streamlit. Because you've been writing plots wrong all this time. Getting started pip install plost

Owner
Fabien Maussion
Climate, glaciers, and programming.
Fabien Maussion
This is Pygrr PolyArt, a program used for drawing custom Polygon models for your Pygrr project!

This is Pygrr PolyArt, a program used for drawing custom Polygon models for your Pygrr project!

Isaac 4 Dec 14, 2021
Using SQLite within Python to create database and analyze Starcraft 2 units data (Pandas also used)

SQLite python Starcraft 2 English This project shows the usage of SQLite with python. To create, modify and communicate with the SQLite database from

null 1 Dec 30, 2021
LabGraph is a a Python-first framework used to build sophisticated research systems with real-time streaming, graph API, and parallelism.

LabGraph is a a Python-first framework used to build sophisticated research systems with real-time streaming, graph API, and parallelism.

MLH Fellowship 7 Oct 5, 2022
Simple plotting for Python. Python wrapper for D3xter - render charts in the browser with simple Python syntax.

PyDexter Simple plotting for Python. Python wrapper for D3xter - render charts in the browser with simple Python syntax. Setup $ pip install PyDexter

D3xter 31 Mar 6, 2021
A simple script that displays pixel-based animation on GitHub Activity

GitHub Activity Animator This project contains a simple Javascript snippet that produces an animation on your GitHub activity tracker. The project als

null 16 Nov 15, 2021
Plot toolbox based on Matplotlib, simple and elegant.

Elegant-Plot Plot toolbox based on Matplotlib, simple and elegant. 绘制效果 绘制过程 数据准备 每种图标类型的目录下有data.csv文件,依据样例数据填入自己的数据。

null 3 Jul 15, 2022
Active Transport Analytics Model (ATAM) is a new strategic transport modelling and data visualization framework for Active Transport as well as emerging micro-mobility modes

{ATAM} Active Transport Analytics Model Active Transport Analytics Model (“ATAM”) is a new strategic transport modelling and data visualization framew

Peter Stephan 0 Jan 12, 2022
Simple, realtime visualization of neural network training performance.

pastalog Simple, realtime visualization server for training neural networks. Use with Lasagne, Keras, Tensorflow, Torch, Theano, and basically everyth

Rewon Child 416 Dec 29, 2022
Simple Python interface for Graphviz

Graphviz This package facilitates the creation and rendering of graph descriptions in the DOT language of the Graphviz graph drawing software (master

Sebastian Bank 1.3k Dec 26, 2022
Simple Python interface for Graphviz

Graphviz This package facilitates the creation and rendering of graph descriptions in the DOT language of the Graphviz graph drawing software (master

Sebastian Bank 919 Feb 17, 2021