International Space Station data with Python research 🌎

Overview

espaciador

International Space Station data with Python research 🌎

Plotting ISS trajectory, calculating the velocity over the earth and more.


Plotting trajectory:

We are going to make a graph of the trajectory of the ISS that is N minutes long. The N will be chosen by the user according to their preferences. This means that the program will run and keep points in a list for N minutes.
We will use an API to retrieve ISS current position in latitude and longitude:

http://open-notify.org/Open-Notify-API/ISS-Location-Now/

First we need to import the following python modules:

Pandas to read json data from ISS API, plotly to make the plot of the trajectory and time to time.sleep function
import pandas as pd
import plotly.express as px
import time

Second we must initialize the list that will preserve the latitude and longitude points (every sixty seconds). You also have to initialize the N variable with time in minutes

latitudes = []
longitudes = []
N = 60 # Sixty for one hour trajectory

Then we will create the following for loop to keep recording latitude-longitude points separated by one minute

We use for i in range(N), which is the time that the script will keep running (in hours) because we have a time.sleep(60) at the end
for i in range(N):  
    url = "http://api.open-notify.org/iss-now.json" # API URL

    df = pd.read_json(url) # Pandas read JSON data from API
    
    latitudes.append(df["iss_position"]["latitude"])  # We append latitude ISS position to latitudes list
    longitudes.append(df["iss_position"]["longitude"]) # We append longitude ISS position to longitudes list
    
    time.sleep(60) # This is used to separate de point records with one minute

When the for loop finish the iterating we will have a record of N minutes ISS trajectory. Now we can plot this with Plotly (px.line_geo):

px.line_geo will create a plot with earth map
fig = px.line_geo(lat=latitudes, lon=longitudes) # Passing our latitudes and longitudes list as parameter
fig.show()  

image

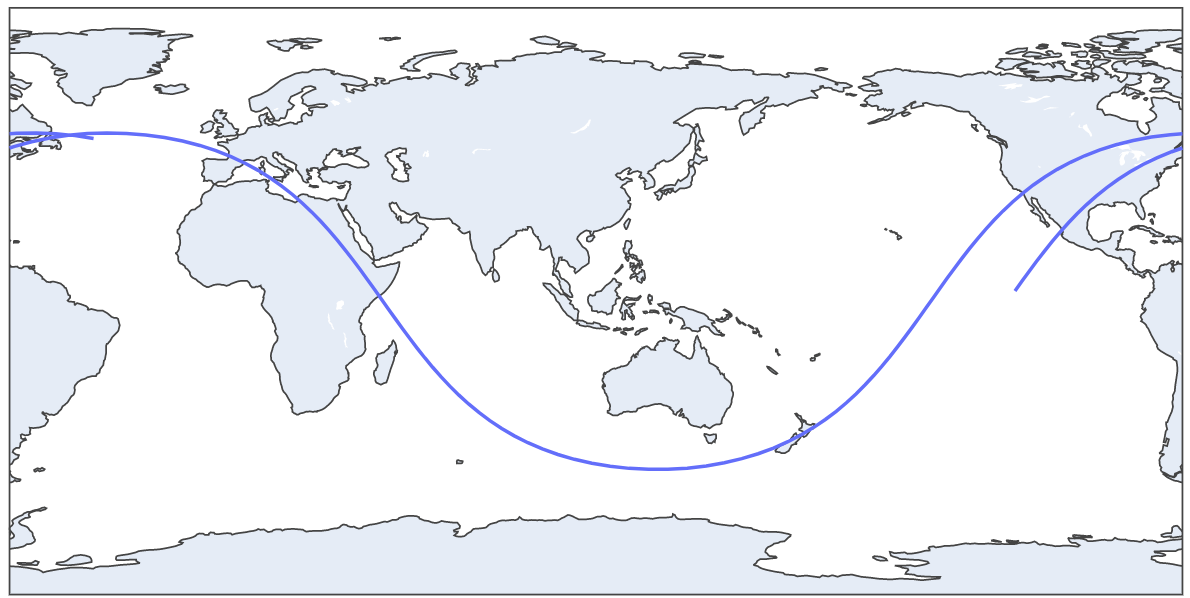
This is a two hours trajectory plot

We can update our plot to orthographic projection with this code:

fig.update_geos(projection_type="orthographic")
fig.update_layout(height=300, margin={"r":0,"t":0,"l":0,"b":0})
fig.show()  

image

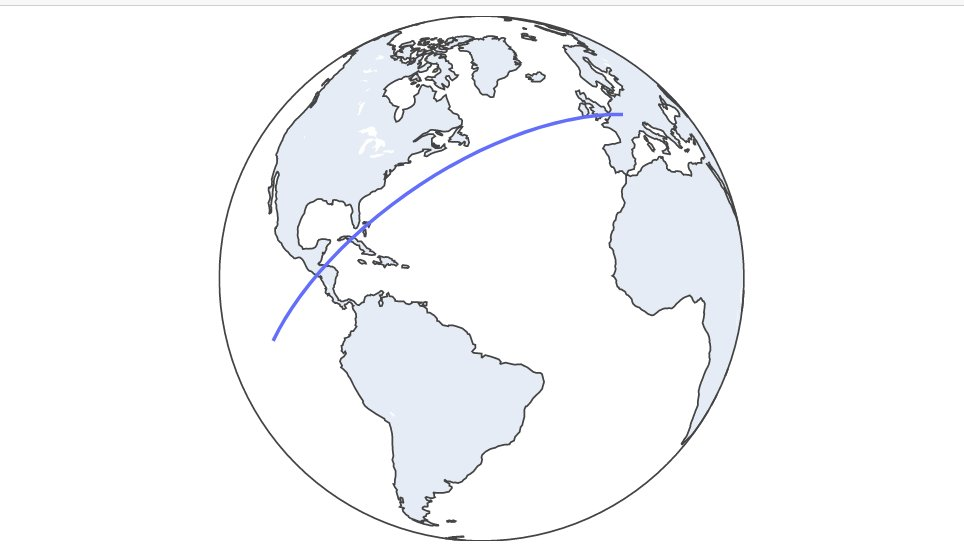
30 minutes trajectory plot

image

2 Hours trajectory plot GIF

Estimating ISS velocity:

We will estimate the ISS velocity using two diferent latitude-longitude points separated by one minute (sixty seconds). We can get the distance between that two points and then use phisics formula velocity(m/s) = distance(in meters)/time(in seconds)

First import the following python modules

import pandas as pd # Pandas to read API data
import time # Time for time.sleep
import geopy.distance # Geopy to get distance between two lat-lon points
import requests # Get another API data
import json # Read that data
We need to initialize two empty list to save latitudes and longitudes
lat = []
long = []
Next we will use a for loop to get the two latitude-longitude points separated by 60 seconds (time.sleep(60))
for i in range(2):  # for in range(2) because we want two lat-lon points

    url = "http://api.open-notify.org/iss-now.json" # API url

    df = pd.read_json(url) # Read API Json data with Pandas

    lat.append(df["iss_position"]["latitude"]) # Append latitude to lat list
    long.append(df["iss_position"]["longitude"]) # Append longitude to long list

    time.sleep(60) # Wait 60 seconds to record the second lat-lon point
When this for loop finish we will have a lat list with two latitude positions and one long list with two longitude positions. In conjuntion of this 4 numbers we have two lat-lon points in different time moments (separated by one minute)

Then we must get the distance between this points:

We create the two different points. The first one with lat[0] index and long[0]. The second one with lat[1] and long[0]
coords_1 = (lat[0], long[0]) 
coords_2 = (lat[1], long[1])
Then calculate distance with geopy library:
distance = (
geopy.distance.distance(coords_1, coords_2).m
) # Distance between the points in meters
But we must make a litle correction. Because ISS isn't moving in earth surface. It's orbiting aproximately 400Km above earth surface. So the radius is greater. The distance traveled is a litle bit more. To do this, we need to get ISS current altitud. Use the following code:

image

iss_alt_url = "https://api.wheretheiss.at/v1/satellites/25544"
r = requests.get(iss_alt_url)
r = r.text
r = json.loads(r)

iss_alt = int(r["altitude"]) # IN KM
Now apply phisics formula to make the correction
earth_radius = 6371 # in KM
distance_corrected = (distance * (earth_radius+iss_alt)/earth_radius)
Now finish the calculation with speed formula already explained:
speed = distancia_corrected/60 


print(round(speed*3.6, 3), "KM/H") # Multiplied by 3.6 to convert from m/s to km/h. Rounded by 3.

Output:

26367.118 KM/h
You might also like...
Fancy data functions that will make your life as a data scientist easier.

WhiteBox Utilities Toolkit: Tools to make your life easier Fancy data functions that will make your life as a data scientist easier. Installing To ins

A Big Data ETL project in PySpark on the historical NYC Taxi Rides data

Processing NYC Taxi Data using PySpark ETL pipeline Description This is an project to extract, transform, and load large amount of data from NYC Taxi

Created covid data pipeline using PySpark and MySQL that collected data stream from API and do some processing and store it into MYSQL database.

Created covid data pipeline using PySpark and MySQL that collected data stream from API and do some processing and store it into MYSQL database.

Utilize data analytics skills to solve real-world business problems using Humana’s big data

Humana-Mays-2021-HealthCare-Analytics-Case-Competition- The goal of the project is to utilize data analytics skills to solve real-world business probl

PrimaryBid - Transform application Lifecycle Data and Design and ETL pipeline architecture for ingesting data from multiple sources to redshift

Transform application Lifecycle Data and Design and ETL pipeline architecture for ingesting data from multiple sources to redshift This project is composed of two parts: Part1 and Part2

Demonstrate the breadth and depth of your data science skills by earning all of the Databricks Data Scientist credentials

Data Scientist Learning Plan Demonstrate the breadth and depth of your data science skills by earning all of the Databricks Data Scientist credentials

PostQF is a user-friendly Postfix queue data filter which operates on data produced by postqueue -j.

PostQF Copyright © 2022 Ralph Seichter PostQF is a user-friendly Postfix queue data filter which operates on data produced by postqueue -j. See the ma

ForecastGA is a Python tool to forecast Google Analytics data using several popular time series models.

ForecastGA is a tool that combines a couple of popular libraries, Atspy and googleanalytics, with a few enhancements.

DenseClus is a Python module for clustering mixed type data using UMAP and HDBSCAN

DenseClus is a Python module for clustering mixed type data using UMAP and HDBSCAN. Allowing for both categorical and numerical data, DenseClus makes it possible to incorporate all features in clustering.

Owner
Facundo Pedaccio
Studying computer engineering and economics. I like computer science, physics, astrophysics, rocket science. Or rather the perfect combination of them.
Facundo Pedaccio
This creates a ohlc timeseries from downloaded CSV files from NSE India website and makes a SQLite database for your research.

NSE-timeseries-form-CSV-file-creator-and-SQL-appender- This creates a ohlc timeseries from downloaded CSV files from National Stock Exchange India (NS

PILLAI, Amal 1 Oct 2, 2022
Amundsen is a metadata driven application for improving the productivity of data analysts, data scientists and engineers when interacting with data.

Amundsen is a metadata driven application for improving the productivity of data analysts, data scientists and engineers when interacting with data.

Amundsen 3.7k Jan 3, 2023
Elementary is an open-source data reliability framework for modern data teams. The first module of the framework is data lineage.

Data lineage made simple, reliable, and automated. Effortlessly track the flow of data, understand dependencies and analyze impact. Features Visualiza

null 898 Jan 9, 2023
🧪 Panel-Chemistry - exploratory data analysis and build powerful data and viz tools within the domain of Chemistry using Python and HoloViz Panel.

???? ??. The purpose of the panel-chemistry project is to make it really easy for you to do DATA ANALYSIS and build powerful DATA AND VIZ APPLICATIONS within the domain of Chemistry using using Python and HoloViz Panel.

Marc Skov Madsen 97 Dec 8, 2022
Tuplex is a parallel big data processing framework that runs data science pipelines written in Python at the speed of compiled code

Tuplex is a parallel big data processing framework that runs data science pipelines written in Python at the speed of compiled code. Tuplex has similar Python APIs to Apache Spark or Dask, but rather than invoking the Python interpreter, Tuplex generates optimized LLVM bytecode for the given pipeline and input data set.

Tuplex 791 Jan 4, 2023
Python data processing, analysis, visualization, and data operations

Python This is a Python data processing, analysis, visualization and data operations of the source code warehouse, book ISBN: 9787115527592 Descriptio

FangWei 1 Jan 16, 2022
Catalogue data - A Python Scripts to prepare catalogue data

catalogue_data Scripts to prepare catalogue data. Setup Clone this repo. Install

BigScience Workshop 3 Mar 3, 2022
fds is a tool for Data Scientists made by DAGsHub to version control data and code at once.

Fast Data Science, AKA fds, is a CLI for Data Scientists to version control data and code at once, by conveniently wrapping git and dvc

DAGsHub 359 Dec 22, 2022
A data parser for the internal syncing data format used by Fog of World.

A data parser for the internal syncing data format used by Fog of World. The parser is not designed to be a well-coded library with good performance, it is more like a demo for showing the data structure.

Zed(Zijun) Chen 40 Dec 12, 2022