A tool for automatically generating 3D printable STLs from freely available lidar scan data.

Overview

mini-map-maker

A tool for automatically generating 3D printable STLs from freely available lidar scan data.

Screenshots

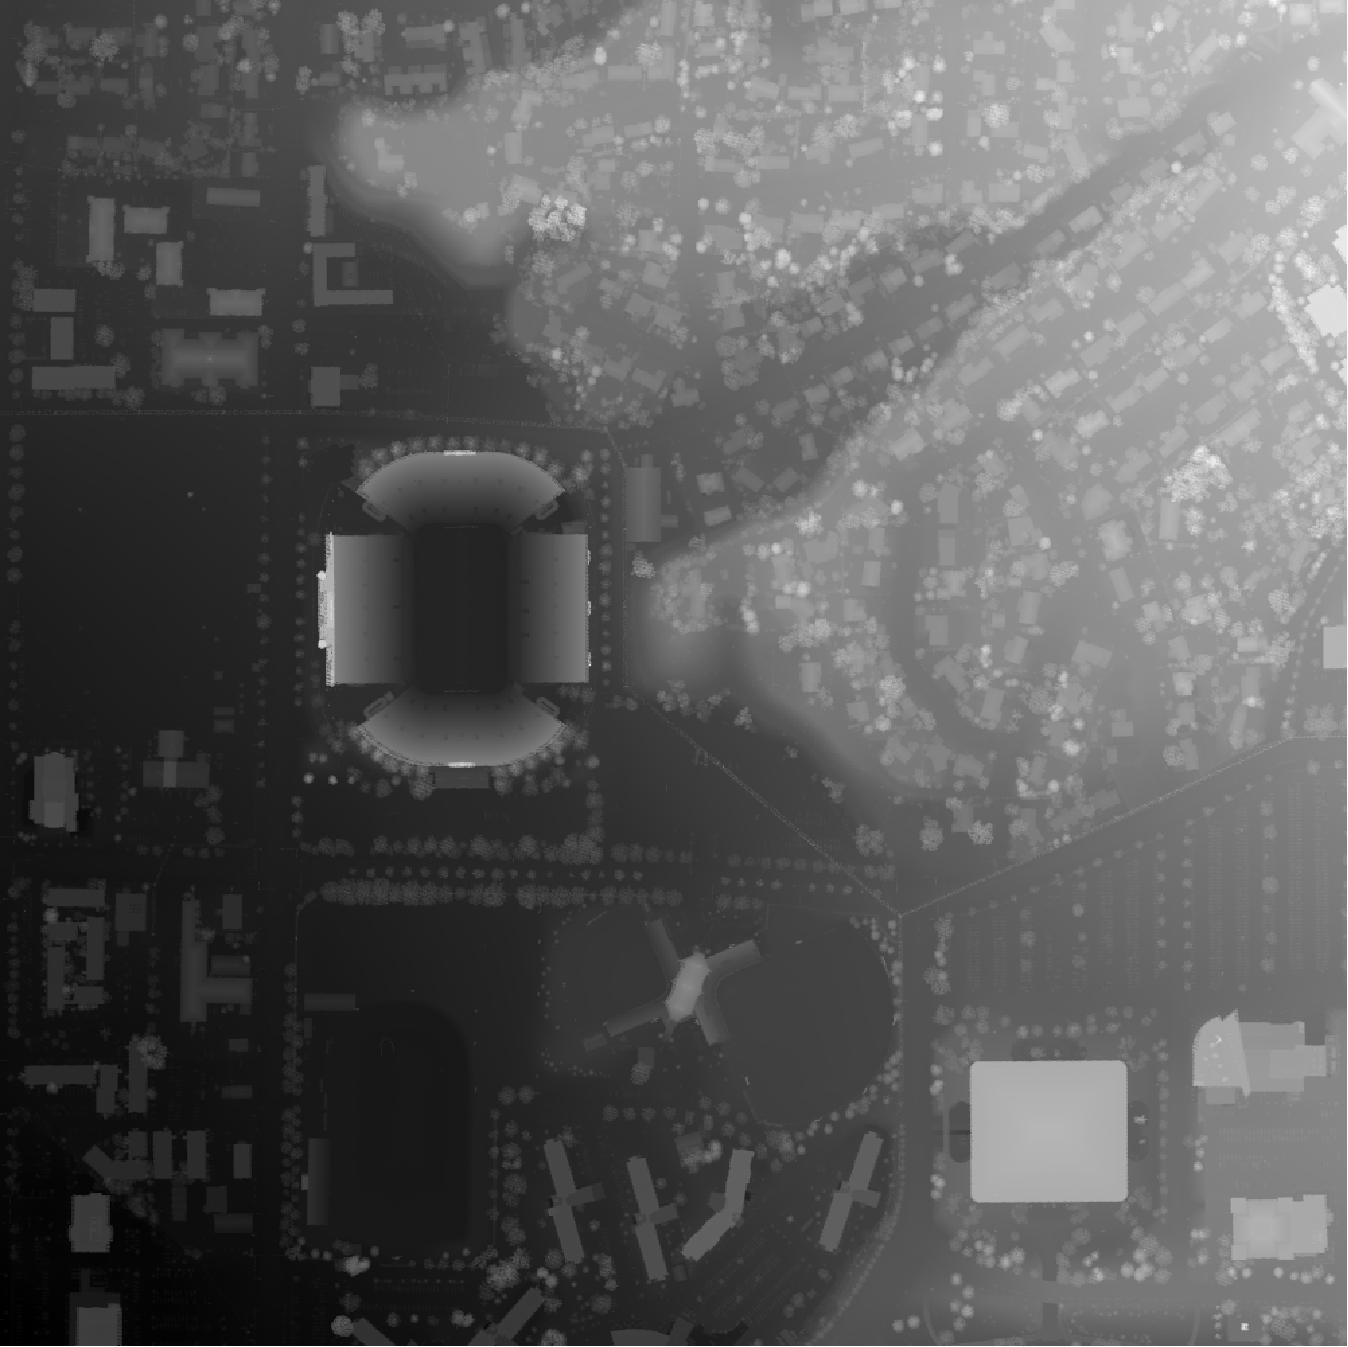
image image

Tutorial

To use this script, go to the USGS LidarExplorer

https://prd-tnm.s3.amazonaws.com/LidarExplorer/index.html#/

Select an area, and then click the "Download list" button under "Lidar within AOI" image This should give you a file called downloadlist.txt. Simply place this text file in the same directory as the script, and then run the script (convert.py, or convert.exe if you don't want to deal with Python). By default, mini-map-maker will generate an STL file for each tile in the lidar data. However, there are quite a few command line arguments that you can use to customize the output.

>convert.py -h

usage: convert [-h] [--input INPUT] [--reduce REDUCE] [--vscale VSCALE]
               [--base BASE] [--merge] [--no_stl] [--cleanup] [--filter FILTER] [--prj]

A utility for automatically generating 3D printable STLs from USGS lidar scans.

optional arguments:
  -h, --help            show this help message and exit
  
  --input INPUT, -i INPUT
                        The name of the file containing the URLs of all of the lidar scan data.
                        
  --reduce REDUCE, -r REDUCE
                        A decimal value that will decrease the output file size as it increases.
                        The default value is 1.0
                        
  --vscale VSCALE, -v VSCALE
                        A decimal value that will make artificially make things taller as it increases.
                        The default value is 1.0
                        
  --base BASE, -b BASE  A decimal value that sets the base height of the model. The default value is 0.0
  
  --merge, -m           Using this flag will merge all of the point clouds into one file before converting into a DEM.
  
  --no_stl, -s          Using this flag will disable STL generation.
  
  --cleanup, -c         Using this flag will cause the program to automatically delete the unzipped point cloud files
                        after running.
                        
  --filter FILTER, -f FILTER
                        A percent value (0-100, for the slope of the points being smoothed) that will enable the spike
                        smoothing option. This is good if you have points that are floating way up above the model and
                        causing spikes in your final model.
                        
  --prj, -p             Using this flag will cause the program to automatically download and use lastools to generate
                        projection files for the elevation models. This is important if you want to generate the STLs
                        yourself in QGIS, but it means you'll have to be mindful of lastool's license limitations.
                        More info on lastool's website (https://rapidlasso.com/lastools/).
                        
  --external_files, -e  Using this flag will grab las/laz files from the LAS directory instead of downloading them from
                        an input list.

Additional Examples:

External Files

Let's say you already have some las files you want to use. Simply place them into a directory called LAS, and then call the script from from the directory containing the LAS folder, using the --external_files flag, like so:

convert.py --external_files

This trick also works with LAZ files, or even a mix of LAZ and LAS files.

Adding a Base and Manipulating the Output

For one project, I had a LAZ file that had a section of ocean. This caused the output to be super flat, and too thin in several places to print well. Additionally, it was a pretty high resolution file, so the output STL was very large, and I wasn't happy with the vertical scale of the file either. So, after placing my LAZ file into a directory labeled LAS like mentioned above, I used the following command:

convert.py --external_files --filter 50 --base 10 --vscale 0.5 --reduce 2

Filtering got rid of some weird spikes in the output STL, and the base command increased the total height of the output. The vscale command made the model shorter, and reduce significantly decreased the size of the STL.

Support This Project

Like this project? Feel free to make a donation.

ko-fi

Licensing

With the default options, this program is completely open source, and the output is usable in a commercial environment. This code itself is MIT License, as is r-barnes' DEMto3D library that this program makes use of.

https://github.com/r-barnes/DEMto3D

If you want to use the output in QGIS or another GIS program, and enable .prj file generation, then the sript will automatically download lastools. The .prj files generated are free to use if it's not for commercial purposes. If you plan on using the .prj files for commercial purposes, you will need to purchase a lastools license in accordance with the information on lastool's website:

https://rapidlasso.com/lastools/

Additionally, this script makes use of some public domain utilities from FUSION by the US Forest Service

http://forsys.sefs.uw.edu/FUSION/fusion_overview.html

With the addition of LAZ processing, this project now utilizes LASzip, an LGPL-2.1 tool. It is included as a precompiled binary (laszip-cli.exe), and no modifications have been made.
https://github.com/LASzip/LASzip

You might also like...
Rubrix is a free and open-source tool for exploring and iterating on data for artificial intelligence projects.

Open-source tool for exploring, labeling, and monitoring data for AI projects

A command line tool for visualizing CSV/spreadsheet-like data

PerfPlotter Read data from CSV files using pandas and generate interactive plots using bokeh, which can then be embedded into HTML pages and served by

Regress.me is an easy to use data visualization tool powered by Dash/Plotly.

Regress.me Regress.me is an easy to use data visualization tool powered by Dash/Plotly. Regress.me.-.Google.Chrome.2022-05-10.15-58-59.mp4 Get Started

Apache Superset is a Data Visualization and Data Exploration Platform

Superset A modern, enterprise-ready business intelligence web application. Why Superset? | Supported Databases | Installation and Configuration | Rele

Apache Superset is a Data Visualization and Data Exploration Platform

Apache Superset is a Data Visualization and Data Exploration Platform

Script to create an animated data visualisation for categorical timeseries data - GIF choropleth map with annotations.

choropleth_ldn Simple script to create a chloropleth map of London with categorical timeseries data. The script in main.py creates a gif of the most f

Tidy data structures, summaries, and visualisations for missing data

naniar naniar provides principled, tidy ways to summarise, visualise, and manipulate missing data with minimal deviations from the workflows in ggplot

Automatic data visualization in atom with the nteract data-explorer

Data Explorer Interactively explore your data directly in atom with hydrogen! The nteract data-explorer provides automatic data visualization, so you

Data-FX is an addon for Blender (2.9) that allows for the visualization of data with different charts

Data-FX Data-FX is an addon for Blender (2.9) that allows for the visualization of data with different charts Currently, there are only 2 chart option

Comments
  • Code not Finding .exe files

    Code not Finding .exe files

    When I run the convert.exe it gets all the way through unzipping. When it finishes unzipping it tries to run GridSuraceCreate64.exe and DTM2ASCII.exe and says the do not exist. This also occurs when I try to use the .py version of convert program.

    My downloadlist.txt is attached below. Let me know if you need anything else to troubleshoot.

    downloadlist.txt

    opened by bmartin598 2
  • Program not Creating all .asc files

    Program not Creating all .asc files

    When I run the program it always fails by resulting in being unable to find a .asc file. I have tried with several different data sets from the USGS map. It does this with the .py and .exe versions

    Suggestions?

    Generating .asc files...
    
    ASC\USGS_LPC_CO_Central_Western_2016_LD28711641_LAS_2018.asc
       Cannot open input surface model: DTM\USGS_LPC_CO_Central_Western_2016_LD28711641_LAS_2018.dtm
    Traceback (most recent call last):
      File "D:\Lidar\convert.py", line 210, in <module>
        main()
      File "D:\Lidar\convert.py", line 192, in main
        asc_parse.gen_stls_from_ascs(
      File "D:\Lidar\asc_parse.py", line 24, in gen_stls_from_ascs
        list_of_depth_maps = [load_asc(x) for x in list_of_asc]
      File "D:\Lidar\asc_parse.py", line 24, in <listcomp>
        list_of_depth_maps = [load_asc(x) for x in list_of_asc]
      File "D:\Lidar\asc_parse.py", line 9, in load_asc
        data = np.loadtxt(file_name, skiprows=7)
      File "C:\Users\bmart\AppData\Local\Packages\PythonSoftwareFoundation.Python.3.9_qbz5n2kfra8p0\LocalCache\local-packages\Python39\site-packages\numpy\lib\npyio.py", line 961, in loadtxt
        fh = np.lib._datasource.open(fname, 'rt', encoding=encoding)
      File "C:\Users\bmart\AppData\Local\Packages\PythonSoftwareFoundation.Python.3.9_qbz5n2kfra8p0\LocalCache\local-packages\Python39\site-packages\numpy\lib\_datasource.py", line 195, in open
        return ds.open(path, mode, encoding=encoding, newline=newline)
      File "C:\Users\bmart\AppData\Local\Packages\PythonSoftwareFoundation.Python.3.9_qbz5n2kfra8p0\LocalCache\local-packages\Python39\site-packages\numpy\lib\_datasource.py", line 535, in open
        raise IOError("%s not found." % path)
    OSError: ASC\USGS_LPC_CO_Central_Western_2016_LD28711641_LAS_2018.asc not found.
    
    opened by bmartin598 7
  • Generating 1 GB .ASC files and 19 GB .STL Files, REDUCE_BY has no effect

    Generating 1 GB .ASC files and 19 GB .STL Files, REDUCE_BY has no effect

    I seem to get the same output regardless of the command: convert.py convert.py --reduce 10.0

    Here is the content of my downloadlist.txt file: ftp://rockyftp.cr.usgs.gov/vdelivery/Datasets/Staged/Elevation/LPC/Projects/USGS_LPC_PA_South_Central_B1_2017_LAS_2019/laz/USGS_LPC_PA_South_Central_B1_2017_18TUL381540_LAS_2019.laz ftp://rockyftp.cr.usgs.gov/vdelivery/Datasets/Staged/NED/LPC/projects/PA_Statewide_N_2006-2008/las/tiled/PA_Statewide_N_2006-2008_006206.zip ftp://rockyftp.cr.usgs.gov/vdelivery/Datasets/Staged/NED/LPC/projects/PA_Statewide_N_2006-2008/las/tiled/PA_Statewide_N_2006-2008_006205.zip

    opened by jeyeager65 2
Owner
Mike Abbott
Mike Abbott
Example scripts for generating plots of Bohemian matrices

Bohemian Eigenvalue Plotting Examples This repository contains examples of generating plots of Bohemian eigenvalues. The examples in this repository a

Bohemian Matrices 5 Nov 12, 2022
Certificate generating and sending system written in Python.

Certificate Generator & Sender How to use git clone https://github.com/saadhaxxan/Certificate-Generator-Sender.git cd Certificate-Generator-Sender Add

Saad Hassan 11 Dec 1, 2022
Generating interfaces(CLI, Qt GUI, Dash web app) from a Python function.

oneFace is a Python library for automatically generating multiple interfaces(CLI, GUI, WebGUI) from a callable Python object. oneFace is an easy way t

NaNg 31 Oct 21, 2022
Automatically Visualize any dataset, any size with a single line of code. Created by Ram Seshadri. Collaborators Welcome. Permission Granted upon Request.

AutoViz Automatically Visualize any dataset, any size with a single line of code. AutoViz performs automatic visualization of any dataset with one lin

AutoViz and Auto_ViML 1k Jan 2, 2023
Automatically Visualize any dataset, any size with a single line of code. Created by Ram Seshadri. Collaborators Welcome. Permission Granted upon Request.

AutoViz Automatically Visualize any dataset, any size with a single line of code. AutoViz performs automatic visualization of any dataset with one lin

AutoViz and Auto_ViML 299 Feb 13, 2021
Automatically generate GitHub activity!

Commit Bot Automatically generate GitHub activity! We've all wanted to be the developer that commits every day, but that requires a lot of work. Let's

Ricky 4 Jun 7, 2022
Pebble is a stat's visualization tool, this will provide a skeleton to develop a monitoring tool.

Pebble is a stat's visualization tool, this will provide a skeleton to develop a monitoring tool.

Aravind Kumar G 2 Nov 17, 2021
erdantic is a simple tool for drawing entity relationship diagrams (ERDs) for Python data model classes

erdantic is a simple tool for drawing entity relationship diagrams (ERDs) for Python data model classes. Diagrams are rendered using the venerable Graphviz library.

DrivenData 129 Jan 4, 2023
Yata is a fast, simple and easy Data Visulaization tool, running on python dash

Yata is a fast, simple and easy Data Visulaization tool, running on python dash. The main goal of Yata is to provide a easy way for persons with little programming knowledge to visualize their data easily.

Cybercreek 3 Jun 28, 2021
Squidpy is a tool for the analysis and visualization of spatial molecular data.

Squidpy is a tool for the analysis and visualization of spatial molecular data. It builds on top of scanpy and anndata, from which it inherits modularity and scalability. It provides analysis tools that leverages the spatial coordinates of the data, as well as tissue images if available.

Theis Lab 251 Dec 19, 2022