tokei-pie
Render tokei results to charts.
Installation
pip install tokei-pie
Usage
$ tokei -o json | tokei-pie

(This is how django looks like!)
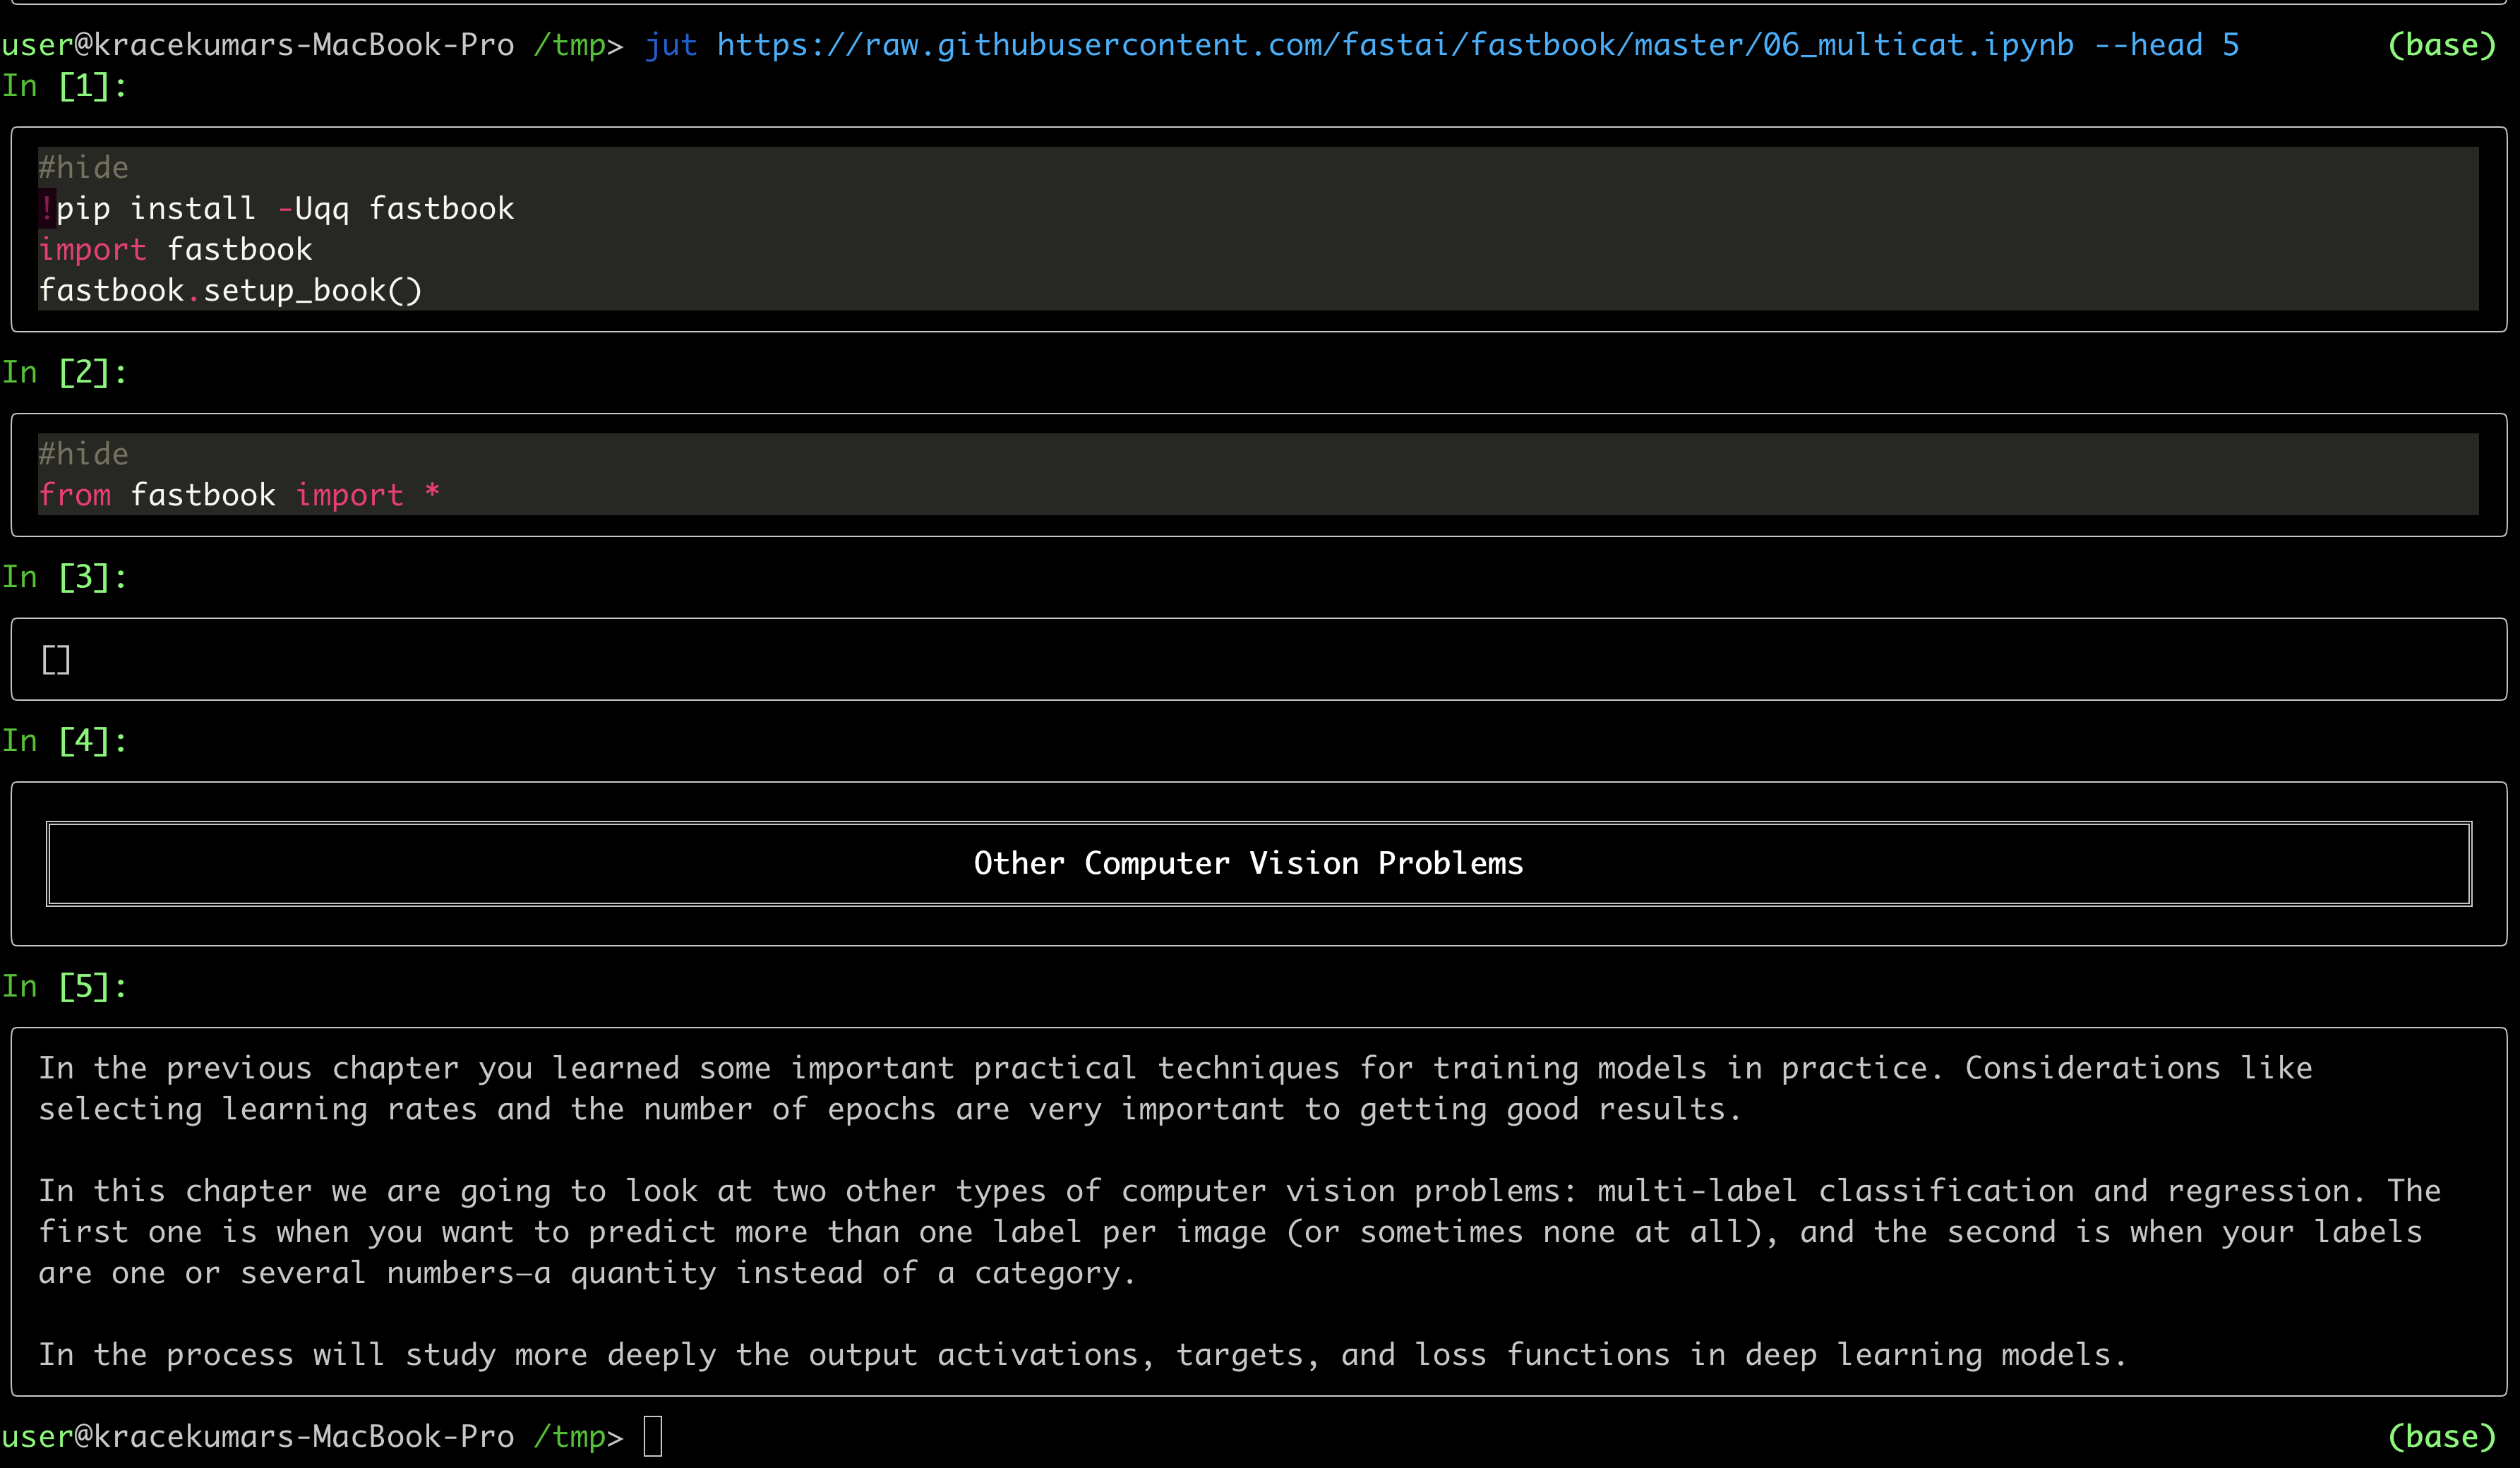
jut - JUpyter notebook Terminal viewer. The command line tool view the IPython/Jupyter notebook in the terminal. Install pip install jut Usage $jut --
ColorShell ─ 1.5 Planned for v2: setup.sh for setup alias This script converts HEX and RGB code to x1b x1b is code for colorize outputs, works on ou
Bokeh is an interactive visualization library for modern web browsers. It provides elegant, concise construction of versatile graphics, and affords hi
whiteboxgui An interactive GUI for WhiteboxTools in a Jupyter-based environment GitHub repo: https://github.com/giswqs/whiteboxgui Documentation: http
plotly.py Latest Release User forum PyPI Downloads License Data Science Workspaces Our recommended IDE for Plotly’s Python graphing library is Dash En
Bokeh is an interactive visualization library for modern web browsers. It provides elegant, concise construction of versatile graphics, and affords hi
nx_altair Draw NetworkX graphs with Altair nx_altair offers a similar draw API to NetworkX but returns Altair Charts instead. If you'd like to contrib
pdvega: Vega-Lite plotting for Pandas Dataframes pdvega is a library that allows you to quickly create interactive Vega-Lite plots from Pandas datafra
plotly.py Latest Release User forum PyPI Downloads License Data Science Workspaces Our recommended IDE for Plotly’s Python graphing library is Dash En
Currently when trying to run on any directory on Windows gives the following error.
Traceback (most recent call last):
  File "C:\Users\AppData\Local\Programs\Python\Python310\lib\runpy.py", line 196, in _run_module_as_main
    return _run_code(code, main_globals, None,
  File "C:\Users\AppData\Local\Programs\Python\Python310\lib\runpy.py", line 86, in _run_code
    exec(code, run_globals)
  File "C:\Users\AppData\Local\Programs\Python\Python310\Scripts\tokei-pie.exe\__main__.py", line 7, in <module>
  File "C:\Users\AppData\Local\Programs\Python\Python310\lib\site-packages\tokei_pie\main.py", line 227, in main
    sectors = read_root(data)
  File "C:\Users\AppData\Local\Programs\Python\Python310\lib\site-packages\tokei_pie\main.py", line 197, in read_root
    sectors.extend(read_reports(reports, key))
  File "C:\Users\erin.power\AppData\Local\Programs\Python\Python310\lib\site-packages\tokei_pie\main.py", line 176, in read_reports
    sectors = convert2sectors(tree, dict_reports, parent_id)
  File "C:\Users\AppData\Local\Programs\Python\Python310\lib\site-packages\tokei_pie\main.py", line 168, in convert2sectors
    dir2sector(".", dirs, reports, sectors, language)
  File "C:\Users\AppData\Local\Programs\Python\Python310\lib\site-packages\tokei_pie\main.py", line 112, in dir2sector
    subdirs = dirs[dirname]
KeyError: '.'
Reproduce:
$ tokei -o json /path/to/my_code | tokei-pie
Traceback (most recent call last):
  File "/Users/fming/wkspace/github/tokei-pie-plate/venv/bin/tokei-pie", line 8, in <module>
    sys.exit(main())
  File "/Users/fming/wkspace/github/tokei-pie-plate/venv/lib/python3.10/site-packages/tokei_pie/main.py", line 227, in main
    sectors = read_root(data)
  File "/Users/fming/wkspace/github/tokei-pie-plate/venv/lib/python3.10/site-packages/tokei_pie/main.py", line 197, in read_root
    sectors.extend(read_reports(reports, key))
  File "/Users/fming/wkspace/github/tokei-pie-plate/venv/lib/python3.10/site-packages/tokei_pie/main.py", line 176, in read_reports
    sectors = convert2sectors(tree, dict_reports, parent_id)
  File "/Users/fming/wkspace/github/tokei-pie-plate/venv/lib/python3.10/site-packages/tokei_pie/main.py", line 168, in convert2sectors
    dir2sector(".", dirs, reports, sectors, language)
  File "/Users/fming/wkspace/github/tokei-pie-plate/venv/lib/python3.10/site-packages/tokei_pie/main.py", line 140, in dir2sector
    _blanks, _code, _comments = dir2sector(
  File "/Users/fming/wkspace/github/tokei-pie-plate/venv/lib/python3.10/site-packages/tokei_pie/main.py", line 140, in dir2sector
    _blanks, _code, _comments = dir2sector(
  File "/Users/fming/wkspace/github/tokei-pie-plate/venv/lib/python3.10/site-packages/tokei_pie/main.py", line 140, in dir2sector
    _blanks, _code, _comments = dir2sector(
  [Previous line repeated 1 more time]
  File "/Users/fming/wkspace/github/tokei-pie-plate/venv/lib/python3.10/site-packages/tokei_pie/main.py", line 118, in dir2sector
    stats = reports[item]
KeyError: './lib/python3.10/site-packages/jinja2/compiler.py'
There seems to be something wrong with the relative path calculation.
When I pass folders as arguments to token I get a key error in tokei-pie
# in tokei repo
token src -o json | tokei-pie
Traceback (most recent call last):
  File "/opt/homebrew/bin/tokei-pie", line 8, in <module>
    sys.exit(main())
  File "/opt/homebrew/lib/python3.9/site-packages/tokei_pie/main.py", line 213, in main
    sectors = read_root(data)
  File "/opt/homebrew/lib/python3.9/site-packages/tokei_pie/main.py", line 194, in read_root
    sectors.extend(read_reports(reports, key))
  File "/opt/homebrew/lib/python3.9/site-packages/tokei_pie/main.py", line 173, in read_reports
    sectors = convert2sectors(tree, dict_reports, parent_id)
  File "/opt/homebrew/lib/python3.9/site-packages/tokei_pie/main.py", line 165, in convert2sectors
    dir2sector(".", dirs, reports, sectors, language)
  File "/opt/homebrew/lib/python3.9/site-packages/tokei_pie/main.py", line 115, in dir2sector
    stats = reports[item]
KeyError: './input.rs'
. by @laixintao in https://github.com/laixintao/tokei-pie/pull/4Full Changelog: https://github.com/laixintao/tokei-pie/compare/v1.1.2...v1.2.0
Source code(tar.gz)Congress-Analysis Bar Chart of the number of Senators from each party who are up for election in the next three General Elections This bar chart shows
Trello Runup Chart Generator The basic concept of the project is that Corello is pay-to-use and want to use Trello To-Do/Doing/Done automation with gi
Chart to swing converter As seen in https://twitter.com/i_winxd/status/1462220493558366214 A program written in python that converts a chart from 4/4
Arras.io Highest Scores Over Time Bar Chart Race This repo contains a python script (make_racing_bar_chart.py) that can generate a csv file which can
Task Overview | Installation Instructions | Link to Module 3 Introduction Experience Technology at JP Morgan Chase Try out what real work is like in t
Github Contribution Drawer Python script for writing text on github contribution chart. Requirements Python 3.X Getting Started Create repository Put
movies-chart This CLI app gets the top 250 movies of all time from imdb.com and
PyDexter Simple plotting for Python. Python wrapper for D3xter - render charts in the browser with simple Python syntax. Setup $ pip install PyDexter
Turn even the largest data into images, accurately Build Status Coverage Latest dev release Latest release Docs Support What is it? Datashader is a da
Turn even the largest data into images, accurately Build Status Coverage Latest dev release Latest release Docs Support What is it? Datashader is a da
 169 Dec 27, 2022

 4 Oct 31, 2021
 17.1k Dec 31, 2022
 105 Dec 15, 2022

 12.7k Jan 5, 2023

 206 Dec 12, 2022

 342 Oct 26, 2022


 11 Oct 26, 2021
 1 Dec 21, 2021
 5 Dec 23, 2022
 2 Jan 16, 2022
 1 Jan 22, 2022
 0 May 27, 2022
 3 Feb 17, 2022
 31 Mar 6, 2021
 2.9k Dec 28, 2022