movies-chart
This CLI app gets the top 250 movies of all time from imdb.com and the top 100 movies from rottentomatoes.com. It displays the top ten from each and generates random movies therefrom.
oneFace is a Python library for automatically generating multiple interfaces(CLI, GUI, WebGUI) from a callable Python object. oneFace is an easy way t
100-Day-With-Python 100 Days of Code - The Complete Python Pro Bootcamp for 2022. In this course, I spend with python language over 100 days, and I up
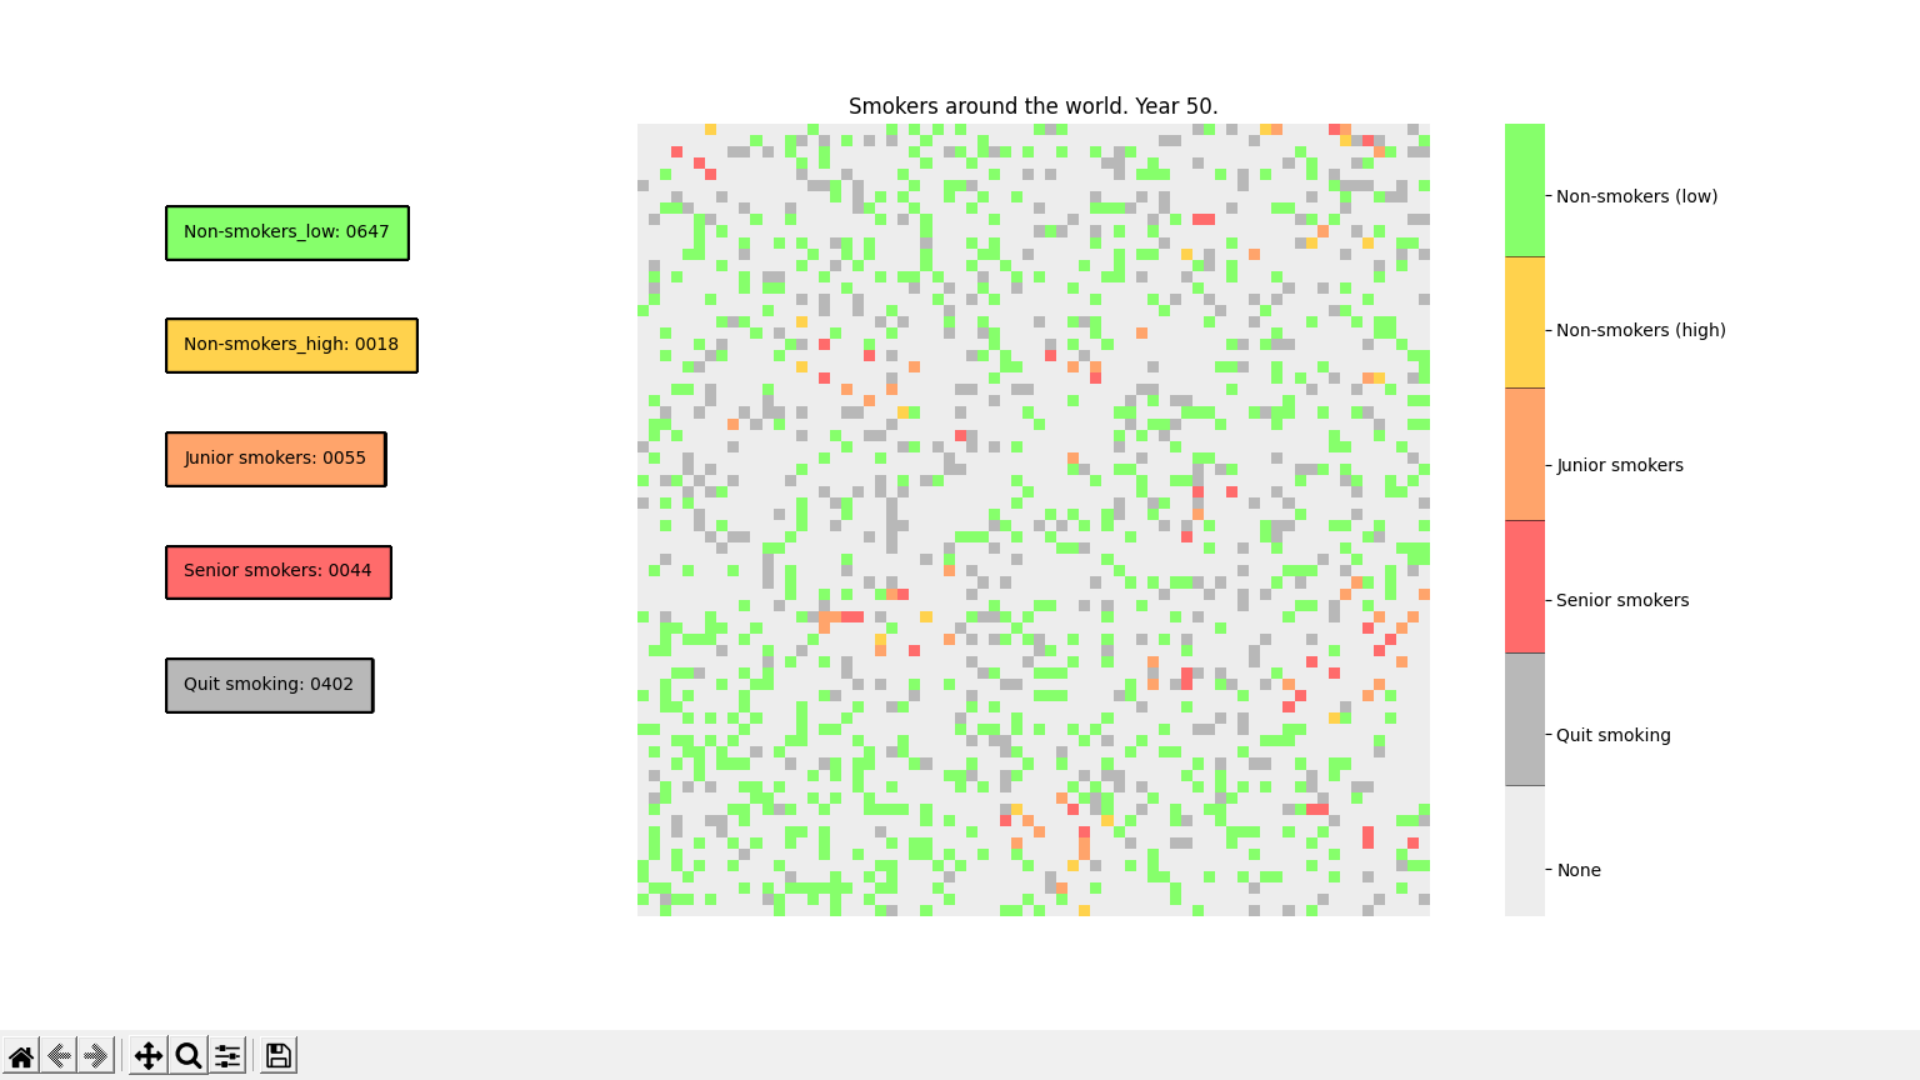
Smoking Simulation is an app to simulate the spreading of smokers and non-smokers, their interactions and population during certain
Project coded in Python using Pandas to look at changes in chase% for batters facing a pitcher first time through the order vs. thrid time
Open Stats Discover and share the KPIs of your OpenSource project. OpenStats is a library built on top of streamlit that extracts data from the Github
pyswahili A programming language built over Python to easily allow swahili speakers to get started with programming without ever knowing english pyswa
NorthPitch is a python soccer plotting library that sits on top of Matplotlib.
RockNext is an Open Source extending ERPNext built on top of Frappe bringing enterprise ready utilization.
Help you discover excellent English projects and get rid of the interference of other spoken language.
Arras.io Highest Scores Over Time Bar Chart Race This repo contains a python script (make_racing_bar_chart.py) that can generate a csv file which can
Personal IMDB Graphs with Bokeh Do you like watching movies and also rate all of them in IMDB? Would you like to look at your IMDB stats based on your
PyDLC - Density Line Charts with Python Python implementation of the Density Line Chart (Moritz & Fisher, 2018) to visualize large collections of time
Burndown Chart for GitHub Projects An easy to use burndown chart generator for GitHub Project Boards. Table of Contents Features Installation Assumpti
Congress-Analysis Bar Chart of the number of Senators from each party who are up for election in the next three General Elections This bar chart shows
Trello Runup Chart Generator The basic concept of the project is that Corello is pay-to-use and want to use Trello To-Do/Doing/Done automation with gi
Task Overview | Installation Instructions | Link to Module 3 Introduction Experience Technology at JP Morgan Chase Try out what real work is like in t
Github Contribution Drawer Python script for writing text on github contribution chart. Requirements Python 3.X Getting Started Create repository Put
stock-graph-python Simple CLI python app to show a stocks graph performance. Made with Matplotlib and Tiingo. Tiingo API Key You will need to add your
A collection of Deep Learning images and visualizations. The project has been developed by the AI Summer team and currently contains almost 100 images.


