🐞 📊 Ladybug extension to generate 2D charts
ladybug-charts Ladybug extension to generate 2D charts. Installation pip install ladybug-charts QuickStart import ladybug_charts API Documentation Loc
GitHub English Top Charts
Help you discover excellent English projects and get rid of the interference of other spoken language.
Data-FX is an addon for Blender (2.9) that allows for the visualization of data with different charts
Data-FX Data-FX is an addon for Blender (2.9) that allows for the visualization of data with different charts Currently, there are only 2 chart option
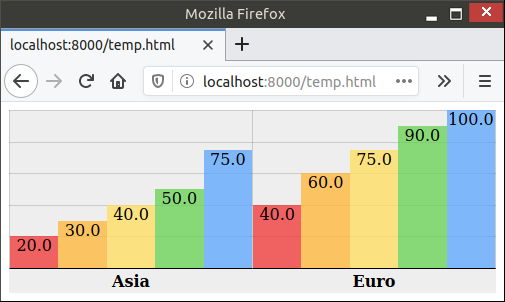
`charts.css.py` brings `charts.css` to Python. Online documentation and samples is available at the link below.
charts.css.py charts.css.py provides a python API to convert your 2-dimension data lists into html snippet, which will be rendered into charts by CSS,
Code for the paper "Relation of the Relations: A New Formalization of the Relation Extraction Problem"
This repo contains the code for the EMNLP 2020 paper "Relation of the Relations: A New Paradigm of the Relation Extraction Problem" (Jin et al., 2020)
Few-shot Relation Extraction via Bayesian Meta-learning on Relation Graphs
Few-shot Relation Extraction via Bayesian Meta-learning on Relation Graphs This is an implemetation of the paper Few-shot Relation Extraction via Baye
Video Visual Relation Detection (VidVRD) tracklets generation. also for ACM MM Visual Relation Understanding Grand Challenge
VidVRD-tracklets This repository contains codes for Video Visual Relation Detection (VidVRD) tracklets generation based on MEGA and deepSORT. These tr
Django-MySQL extends Django's built-in MySQL and MariaDB support their specific features not available on other databases.
Django-MySQL The dolphin-pony - proof that cute + cute = double cute. Django-MySQL extends Django's built-in MySQL and MariaDB support their specific
Created covid data pipeline using PySpark and MySQL that collected data stream from API and do some processing and store it into MYSQL database.
Created covid data pipeline using PySpark and MySQL that collected data stream from API and do some processing and store it into MYSQL database.
Simple plotting for Python. Python wrapper for D3xter - render charts in the browser with simple Python syntax.
PyDexter Simple plotting for Python. Python wrapper for D3xter - render charts in the browser with simple Python syntax. Setup $ pip install PyDexter
A Google Charts API for Python, meant to be used as an alternative to matplotlib.
GooPyCharts A Google Charts API for Python 2 and 3, meant to be used as an alternative to matplotlib. Syntax is similar to MATLAB. The goal of this pr
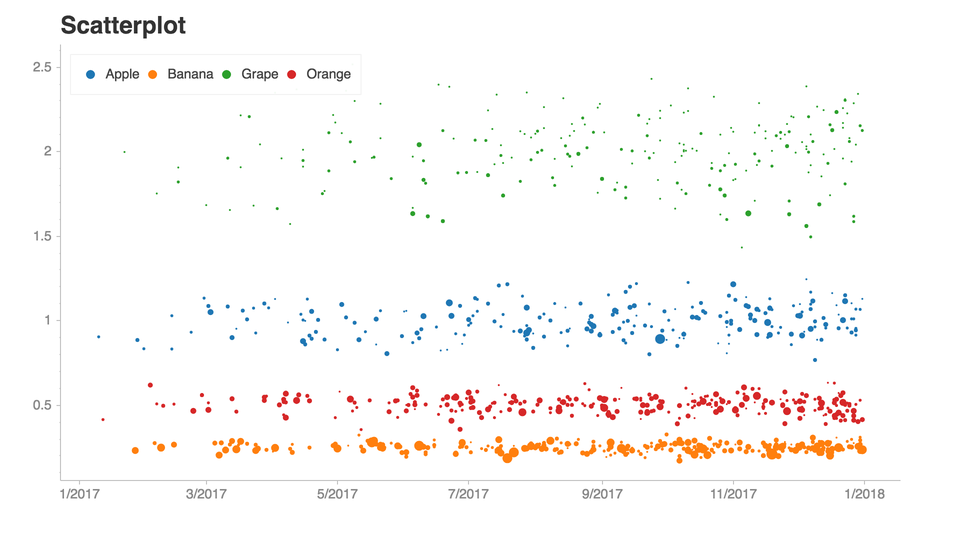
Python library that makes it easy for data scientists to create charts.
Chartify Chartify is a Python library that makes it easy for data scientists to create charts. Why use Chartify? Consistent input data format: Spend l
🧇 Make Waffle Charts in Python.
PyWaffle PyWaffle is an open source, MIT-licensed Python package for plotting waffle charts. It provides a Figure constructor class Waffle, which coul
Drag’n’drop Pivot Tables and Charts for Jupyter/IPython Notebook, care of PivotTable.js
pivottablejs: the Python module Drag’n’drop Pivot Tables and Charts for Jupyter/IPython Notebook, care of PivotTable.js Installation pip install pivot
Streamlit dashboard examples - Twitter cashtags, StockTwits, WSB, Charts, SQL Pattern Scanner
streamlit-dashboards Streamlit dashboard examples - Twitter cashtags, StockTwits, WSB, Charts, SQL Pattern Scanner Tutorial Video https://ww


 3 Dec 30, 2022
 529 Jan 2, 2023
 20 Nov 21, 2022
 3 Sep 23, 2021
 27 Oct 26, 2022
 36 Nov 22, 2022
 25 Dec 21, 2022
 504 Jan 4, 2023

 2 Nov 20, 2021

 31 Mar 6, 2021

 202 Oct 4, 2022
 4k Jan 8, 2023
 3.2k Jan 4, 2023
 528 Jan 2, 2023
 512 Dec 26, 2022
 122 Dec 21, 2022

 31 Mar 6, 2021
 3.2k Jan 4, 2023
 528 Jan 2, 2023
 512 Dec 26, 2022
 122 Dec 21, 2022
 85 Dec 9, 2022