GitHub English Top Charts

Overview

GitHub English Top Charts

「Help you discover excellent English projects and get rid of the interference of other spoken language.」


↓ -- Contents -- ↓

Overall Ranking Growth Ranking New Project Ranking
Software Knowledge Software Knowledge Software Knowledge
All Language All Language All Language All Language All Language All Language
JavaScript JavaScript JavaScript JavaScript JavaScript JavaScript
Java Java Java Java Java Java
Python Python Python Python Python Python
Go Go Go Go Go Go
TypeScript TypeScript TypeScript TypeScript TypeScript TypeScript
Vue Vue Vue Vue Vue Vue
C++ C++ C++ C++ C++ C++
C C C C C C
C# C# C# C# C# C#
PHP PHP PHP PHP PHP PHP
HTML HTML HTML HTML HTML HTML
Swift Swift Swift Swift Swift Swift
Kotlin Kotlin Kotlin Kotlin Kotlin Kotlin
Objective-C Objective-C Objective-C Objective-C Objective-C Objective-C
CSS CSS CSS CSS CSS CSS
Shell Shell Shell Shell Shell Shell
Dart Dart Dart Dart Dart Dart
Rust Rust Rust Rust Rust Rust
Jupyter Notebook Jupyter Notebook Jupyter Notebook Jupyter Notebook Jupyter Notebook Jupyter Notebook
Assembly Assembly Assembly Assembly Assembly Assembly
Vim script Vim script Vim script Vim script Vim script Vim script
Ruby Ruby Ruby Ruby Ruby Ruby
Lua Lua Lua Lua Lua Lua
TeX TeX TeX TeX TeX TeX
Groovy Groovy Groovy Groovy Groovy Groovy
Perl Perl Perl Perl Perl Perl
MATLAB MATLAB MATLAB MATLAB MATLAB MATLAB
Pascal Pascal Pascal Pascal Pascal Pascal
R R R R R R

↓ -- Thanks -- ↓

If it is helpful to you, please star it for easy browsing. Thanks for your support!
You might also like...
Drag’n’drop Pivot Tables and Charts for Jupyter/IPython Notebook, care of PivotTable.js

pivottablejs: the Python module Drag’n’drop Pivot Tables and Charts for Jupyter/IPython Notebook, care of PivotTable.js Installation pip install pivot

Streamlit dashboard examples - Twitter cashtags, StockTwits, WSB, Charts, SQL Pattern Scanner

streamlit-dashboards Streamlit dashboard examples - Twitter cashtags, StockTwits, WSB, Charts, SQL Pattern Scanner Tutorial Video https://ww

Python library that makes it easy for data scientists to create charts.

Chartify Chartify is a Python library that makes it easy for data scientists to create charts. Why use Chartify? Consistent input data format: Spend l

mysql relation charts

sqlcharts 自动生成数据库关联关系图 复制settings.py.example 重命名为settings.py 将数据库配置信息填入settings.DATABASE,目前支持mysql和postgresql 执行 python build.py -b,-b是读取数据库表结构,如果只更新匹

Altair extension for saving charts in a variety of formats.

Altair Saver This packge provides extensions to Altair for saving charts to a variety of output types. Supported output formats are: .json/.vl.json: V

🐞 📊 Ladybug extension to generate 2D charts

ladybug-charts Ladybug extension to generate 2D charts. Installation pip install ladybug-charts QuickStart import ladybug_charts API Documentation Loc

Data-FX is an addon for Blender (2.9) that allows for the visualization of data with different charts

Data-FX Data-FX is an addon for Blender (2.9) that allows for the visualization of data with different charts Currently, there are only 2 chart option

Generate visualizations of GitHub user and repository statistics using GitHub Actions.

GitHub Stats Visualization Generate visualizations of GitHub user and repository statistics using GitHub Actions. This project is currently a work-in-

Generate visualizations of GitHub user and repository statistics using GitHub Actions.

GitHub Stats Visualization Generate visualizations of GitHub user and repository statistics using GitHub Actions. This project is currently a work-in-

Comments
  • Possible to get top 10,000 or more by language? Rank by downloads?

    Possible to get top 10,000 or more by language? Rank by downloads?

    Hello,

    I'm interested in a list of the top 10,000 or maybe even 100,000 projects, mostly just for ASM, C, C++, Golang, the stuff I'm most interested in... I want to find new projects instead of waiting for so long to hear about them... Also, is it possible to rank by downloads?

    I'm fine to implement myself if you're not interested in adding this to your top chart, but if you could give me any tips that would be awesome.

    Most important:

    1. how quickly can I poll github from 1 IP without hitting rate 10 requests per minute rate limit?
    2. do you have to use multiple IPs to run your script each day?
    3. how do you get an index of all github projects to start spydering? How do you keep this list updated?
    opened by erwin 0
Owner
kon9chunkit
kon9chunkit
A programming language built on top of Python to easily allow Swahili speakers to get started with programming without ever knowing English

pyswahili A programming language built over Python to easily allow swahili speakers to get started with programming without ever knowing english pyswa

Jordan Kalebu 72 Dec 15, 2022
Movies-chart - A CLI app gets the top 250 movies of all time from imdb.com and the top 100 movies from rottentomatoes.com

movies-chart This CLI app gets the top 250 movies of all time from imdb.com and

null 3 Feb 17, 2022
Visualise top-rated GitHub repositories in a barchart by keyword

This python script was written for simple purpose -- to visualise top-rated GitHub repositories in a barchart by keyword. Script generates html-page with barchart and information about repository owner, description, create date and update date.

Cur1iosity 2 Feb 7, 2022
OpenStats is a library built on top of streamlit that extracts data from the Github API and shows the main KPIs

Open Stats Discover and share the KPIs of your OpenSource project. OpenStats is a library built on top of streamlit that extracts data from the Github

Pere Miquel Brull 4 Apr 3, 2022
Simple plotting for Python. Python wrapper for D3xter - render charts in the browser with simple Python syntax.

PyDexter Simple plotting for Python. Python wrapper for D3xter - render charts in the browser with simple Python syntax. Setup $ pip install PyDexter

D3xter 31 Mar 6, 2021
Python library that makes it easy for data scientists to create charts.

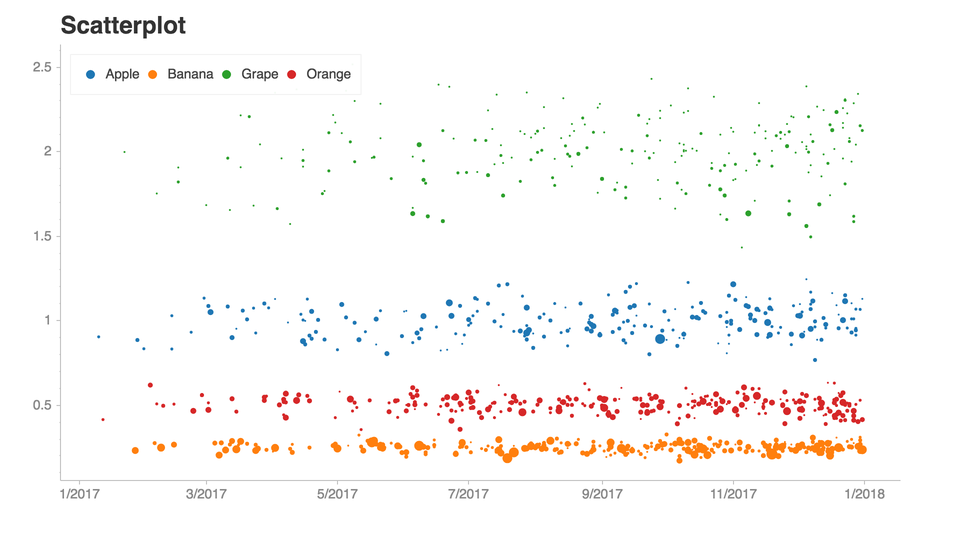
Chartify Chartify is a Python library that makes it easy for data scientists to create charts. Why use Chartify? Consistent input data format: Spend l

Spotify 3.2k Jan 4, 2023
🧇 Make Waffle Charts in Python.

PyWaffle PyWaffle is an open source, MIT-licensed Python package for plotting waffle charts. It provides a Figure constructor class Waffle, which coul
Guangyang Li 528 Jan 2, 2023
Drag’n’drop Pivot Tables and Charts for Jupyter/IPython Notebook, care of PivotTable.js

pivottablejs: the Python module Drag’n’drop Pivot Tables and Charts for Jupyter/IPython Notebook, care of PivotTable.js Installation pip install pivot

Nicolas Kruchten 512 Dec 26, 2022
Python library that makes it easy for data scientists to create charts.

Chartify Chartify is a Python library that makes it easy for data scientists to create charts. Why use Chartify? Consistent input data format: Spend l

Spotify 2.8k Feb 18, 2021
🧇 Make Waffle Charts in Python.

PyWaffle PyWaffle is an open source, MIT-licensed Python package for plotting waffle charts. It provides a Figure constructor class Waffle, which coul

Guangyang Li 397 Feb 17, 2021