A collection of 100 Deep Learning images and visualizations

Overview

Deep Learning visuals

A collection of Deep Learning images and visualizations. The project has been developed by the AI Summer team and currently contains almost 100 images.

This repository was inspired by:

The images have been created using https://www.diagrams.net/ over the past years.

Contents

Can I use them?

Of course. You are allowed to use the images anywhere you like ( even for commercial use), as long as you attribute AI Summer.

Examples

Vision Transformer

Inception block

Layer normalization

Graph convolution

You might also like...
These data visualizations were created as homework for my CS40 class. I hope you enjoy!

Data Visualizations These data visualizations were created as homework for my CS40 class. I hope you enjoy! Nobel Laureates by their Country of Birth

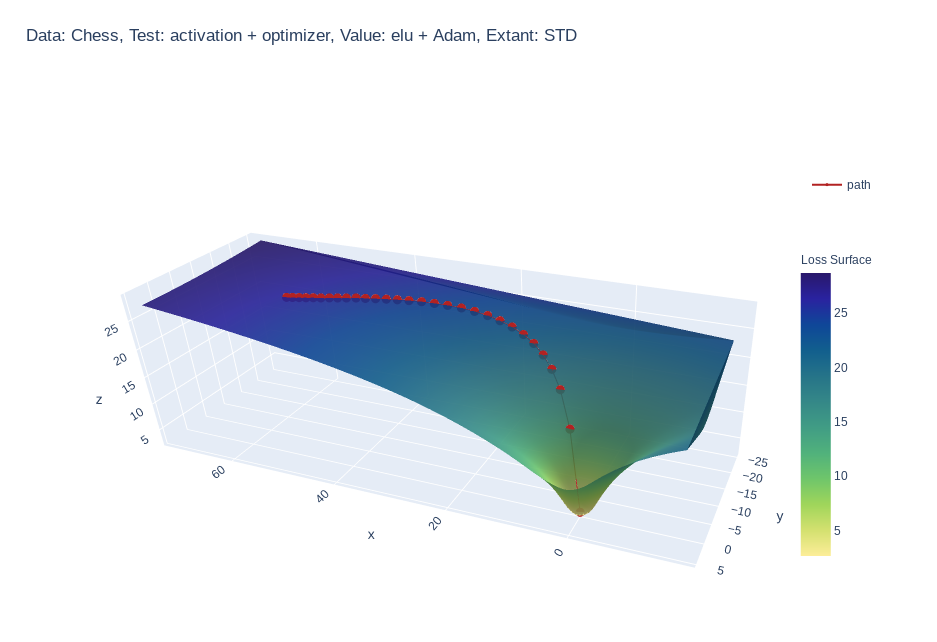
Create 3d loss surface visualizations, with optimizer path. Issues welcome!

MLVTK A loss surface visualization tool Simple feed-forward network trained on chess data, using elu activation and Adam optimizer Simple feed-forward

Make scripted visualizations in blender

Scripted visualizations in blender The goal of this project is to script 3D scientific visualizations using blender. To achieve this, we aim to bring

Visualizations of some specific solutions of different differential equations.

Diff_sims Visualizations of some specific solutions of different differential equations. Heat Equation in 1 Dimension (A very beautiful and elegant ex

Data aggregated from the reports found at the MCPS COVID Dashboard into a set of visualizations.

Montgomery County Public Schools COVID-19 Visualizer Contents About this project Data Support this project About this project Data All data we use can

Create matplotlib visualizations from the command-line

MatplotCLI Create matplotlib visualizations from the command-line MatplotCLI is a simple utility to quickly create plots from the command-line, levera

Movies-chart - A CLI app gets the top 250 movies of all time from imdb.com and the top 100 movies from rottentomatoes.com

movies-chart This CLI app gets the top 250 movies of all time from imdb.com and

100 Days of Code The Complete Python Pro Bootcamp for 2022

100-Day-With-Python 100 Days of Code - The Complete Python Pro Bootcamp for 2022. In this course, I spend with python language over 100 days, and I up

A small collection of tools made by me, that you can use to visualize atomic orbitals in both 2D and 3D in different aspects.

Orbitals in Python A small collection of tools made by me, that you can use to visualize atomic orbitals in both 2D and 3D in different aspects, and o

Owner
AI Summer
Learn Deep Learning and Artificial Intelligence. Discord server: https://discord.gg/k6NXwe7PXh
AI Summer
Visualizations for machine learning datasets

Introduction The facets project contains two visualizations for understanding and analyzing machine learning datasets: Facets Overview and Facets Dive

PAIR code 7.1k Jan 7, 2023
Visualizations for machine learning datasets

Introduction The facets project contains two visualizations for understanding and analyzing machine learning datasets: Facets Overview and Facets Dive

PAIR code 6.5k Feb 17, 2021
📊📈 Serves up Pandas dataframes via the Django REST Framework for use in client-side (i.e. d3.js) visualizations and offline analysis (e.g. Excel)

???? Serves up Pandas dataframes via the Django REST Framework for use in client-side (i.e. d3.js) visualizations and offline analysis (e.g. Excel)

wq framework 1.2k Jan 1, 2023
Generate visualizations of GitHub user and repository statistics using GitHub Actions.

GitHub Stats Visualization Generate visualizations of GitHub user and repository statistics using GitHub Actions. This project is currently a work-in-

JoelImgu 3 Dec 14, 2022
A Python package for caclulations and visualizations in geological sciences.

geo_calcs A Python package for caclulations and visualizations in geological sciences. Free software: MIT license Documentation: https://geo-calcs.rea

Drew Heasman 1 Jul 12, 2022
Standardized plots and visualizations in Python

Standardized plots and visualizations in Python pltviz is a Python package for standardized visualization. Routine and novel plotting approaches are f

Andrew Tavis McAllister 0 Jul 9, 2022
Generate visualizations of GitHub user and repository statistics using GitHub Actions.

GitHub Stats Visualization Generate visualizations of GitHub user and repository statistics using GitHub Actions. This project is currently a work-in-

Aditya Thakekar 1 Jan 11, 2022
GitHub Stats Visualizations : Transparent

GitHub Stats Visualizations : Transparent Generate visualizations of GitHub user and repository statistics using GitHub Actions. ⚠️ Disclaimer The pro

YuanYap 7 Apr 5, 2022
Glue is a python project to link visualizations of scientific datasets across many files.

Glue Glue is a python project to link visualizations of scientific datasets across many files. Click on the image for a quick demo: Features Interacti

null 675 Dec 9, 2022
These data visualizations were created for my introductory computer science course using Python

Homework 2: Matplotlib and Data Visualization Overview These data visualizations were created for my introductory computer science course using Python

Sophia Huang 12 Oct 20, 2022