197 Repositories
Python prometheus-curso-monitoring Libraries

Prometheus exporter for AWS Simple Queue Service (SQS)
Prometheus SQS Exporter Prometheus exporter for AWS Simple Queue Service (SQS) Metrics Metric Description ApproximateNumberOfMessages Returns the appr
 0 Jan 31, 2022

A System Metrics Monitoring Tool Built using Python3 , rabbitmq,Grafana and InfluxDB. Setup using docker compose. Use to monitor system performance with graphical interface of grafana , storage of influxdb and message queuing of rabbitmq
SystemMonitoringRabbitMQGrafanaInflux This repository has code to setup a system monitoring tool The tools used are the follows Python3.6 Docker Rabbi
 7 Sep 6, 2022

Companion repo of the UCC 2021 paper "Predictive Auto-scaling with OpenStack Monasca"
Predictive Auto-scaling with OpenStack Monasca Giacomo Lanciano*, Filippo Galli, Tommaso Cucinotta, Davide Bacciu, Andrea Passarella 2021 IEEE/ACM 14t
 0 Dec 7, 2022

Home solar infrastructure (with Peimar Inverter) monitoring based on Raspberry Pi 3 B+ using Grafana, InfluxDB, Custom Python Collector and Shelly EM.
raspberry-solar-mon Home solar infrastructure (with Peimar Inverter) monitoring based on Raspberry Pi 3 B+ using Grafana, InfluxDB, Custom Python Coll
 10 Dec 23, 2022

Stock Monitoring
Stock Monitoring Description It is a stock monitoring script. This repository is still under developing. Getting Started Prerequisites & Installing pi
 1 Feb 3, 2022

Coin-based opinion monitoring system
介绍 本仓库提供了基于币安 (Binance) 的二级市场舆情系统,可以根据自己的需求修改代码,设定各类告警提示 代码结构 binance.py - 与币安API交互 data_loader.py - 数据相关的读写 monitor.py - 监控的核心方法实现 analyze.py - 基于历史数
 6 Jun 8, 2022
Command line tool for monitoring changes of File entities scoped in a Synapse File View
Synapse Monitoring Provides tools for monitoring and keeping track of File entity changes in Synapse with the use of File Views. Learn more about File
 3 May 28, 2022

Cloudkeeper is “housekeeping for clouds” - find leaky resources, manage quota limits, detect drift and clean up.
Cloudkeeper Housekeeping for Clouds! Table of contents Overview Docker based quick start Cloning this repository Component list Contact License Overvi
 1.2k Jan 3, 2023

Connection package to a raspberry or any other machine using ssh, it simplifies the deployment scripts and monitoring.
Connection package to a raspberry or any other machine using ssh, it simplifies the deployment scripts and monitoring.
 7 Mar 29, 2022

LittleBrother is a simple parental control application monitoring specific processes on Linux hosts to monitor and limit the play time of children.
Parental Control Application LittleBrother Overview LittleBrother is a simple parental control application monitoring specific processes (read "games"
 40 Dec 21, 2022

iot-dashboard: Fully integrated architecture platform with a dashboard for Logistics Monitoring, Internet of Things.
Fully integrated architecture platform with a dashboard for Logistics Monitoring, Internet of Things. Written in Python. Flask applicati
 2 Jul 29, 2022
Tactical RMM is a remote monitoring & management tool for Windows computers, built with Django and Vue.
Tactical RMM is a remote monitoring & management tool for Windows computers, built with Django and Vue. It uses an agent written in golan
 1.4k Dec 30, 2022
Prometheus exporter for CNMC API
CNMC Prometheus exporter It needs a Prometheus Pushgateway Install requirements via pip install -r requirements.txt Export the following environment v
 1 Oct 20, 2021

stonky is a simple command line dashboard for monitoring stocks.
stonky is a simple command line dashboard for monitoring stocks.
 228 Dec 14, 2022
Exercicios de Python do Curso Em Video, apresentado por Gustavo Guanabara.
Exercicios Curso Em Video de Python Exercicios de Python do Curso Em Video, apresentado por Gustavo Guanabara. OBS.: Na data de postagem deste repo já
 0 Oct 21, 2021

TagLab: an image segmentation tool oriented to marine data analysis
TagLab: an image segmentation tool oriented to marine data analysis TagLab was created to support the activity of annotation and extraction of statist
 49 Dec 29, 2022
Automatic CPU speed & power optimizer for Linux
Automatic CPU speed & power optimizer for Linux based on active monitoring of laptop's battery state, CPU usage, CPU temperature and system load. Ultimately allowing you to improve battery life without making any compromises.
 3.4k Jan 7, 2023

A project based example of Data pipelines, ML workflow management, API endpoints and Monitoring.
MLOps template with examples for Data pipelines, ML workflow management, API development and Monitoring.
 33 Dec 3, 2022
Graphsignal is a machine learning model monitoring platform.
Graphsignal is a machine learning model monitoring platform. It helps ML engineers, MLOps teams and data scientists to quickly address issues with data and models as well as proactively analyze model performance and availability.
 143 Dec 5, 2022

Real-Time Social Distance Monitoring tool using Computer Vision
Social Distance Detector A Real-Time Social Distance Monitoring Tool Table of Contents Motivation YOLO Theory Detection Output Tech Stack Functionalit
 13 Oct 14, 2022
A lightweight python script that can monitor the T-Mobile Home Internet Nokia 5G Gateway for band and connectivity and reboot as needed.
tmo-monitor A lightweight Python 3 script that can monitor the T-Mobile Home Internet Nokia 5G Gateway for band and connectivity and reboot as needed.
 61 Dec 17, 2022
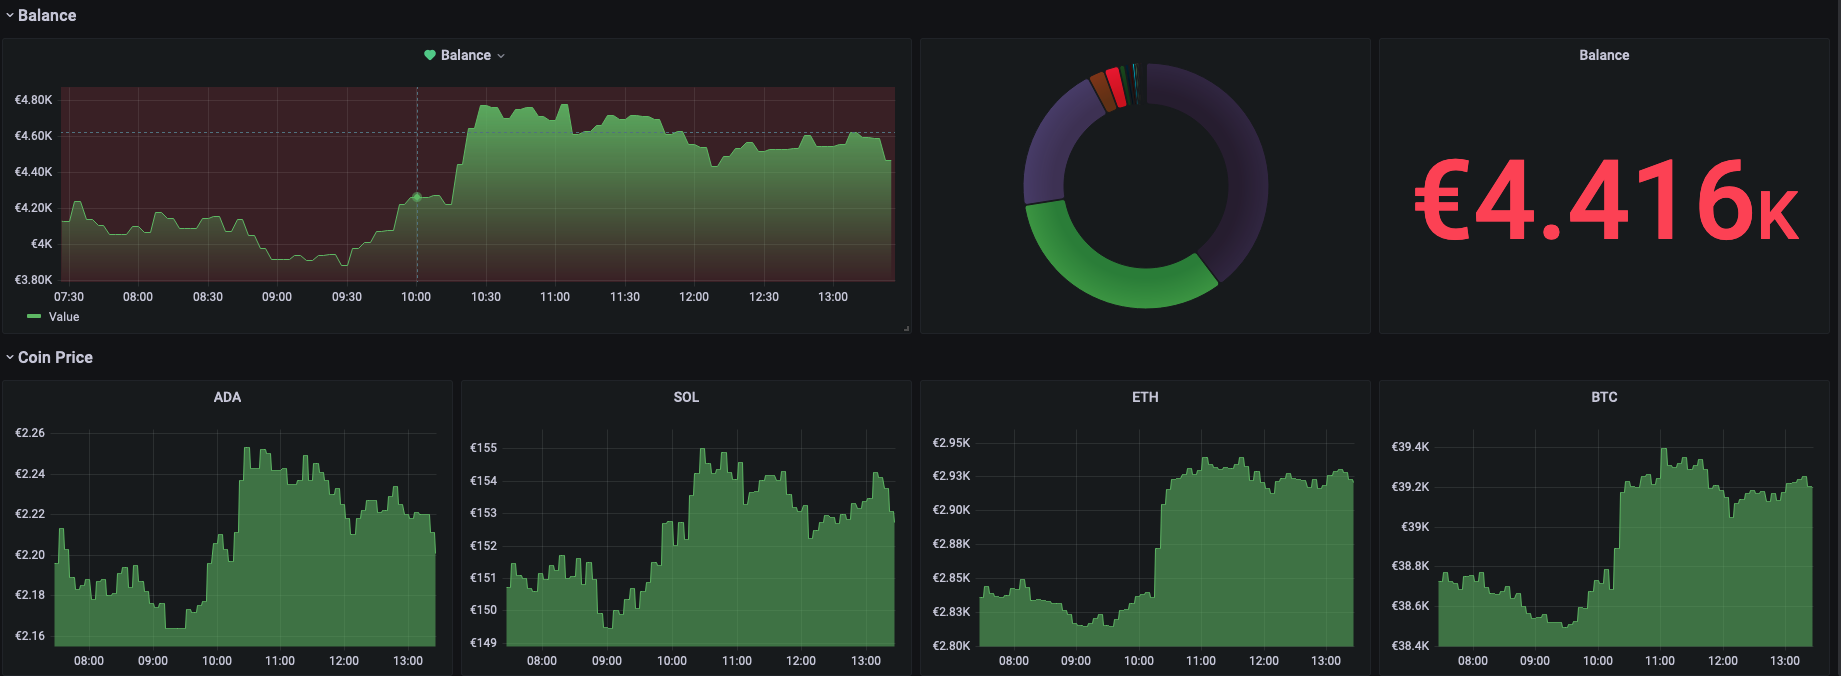
Run with one command grafana, prometheus, and a python script to collect and display cryptocurrency prices and track your wallet balance.
CryptoWatch Track your favorite crypto coin price and your wallet balance. Install Create .env: ADMIN_USER=admin ADMIN_PASSWORD=admin Configure you
 13 Dec 13, 2022
Sentry is cross-platform application monitoring, with a focus on error reporting.
Users and logs provide clues. Sentry provides answers. What's Sentry? Sentry is a service that helps you monitor and fix crashes in realtime. The serv
 32.9k Dec 31, 2022
Prometheus exporter for Spigot accounts
SpigotExporter Prometheus exporter for Spigot accounts What it provides SpigotExporter will output metrics for each of your plugins and a cumulative d
 5 Dec 20, 2021

A prometheus exporter for torrent downloader like qbittorrent/transmission/deluge
downloader-exporter A prometheus exporter for qBitorrent/Transmission/Deluge. Get metrics from multiple servers and offers them in a prometheus format
 41 Nov 18, 2022

Linux, Jenkins, AWS, SRE, Prometheus, Docker, Python, Ansible, Git, Kubernetes, Terraform, OpenStack, SQL, NoSQL, Azure, GCP, DNS, Elastic, Network, Virtualization. DevOps Interview Questions
Linux, Jenkins, AWS, SRE, Prometheus, Docker, Python, Ansible, Git, Kubernetes, Terraform, OpenStack, SQL, NoSQL, Azure, GCP, DNS, Elastic, Network, Virtualization. DevOps Interview Questions
 35.1k Jan 2, 2023

Prototype for Baby Action Detection and Classification
Baby Action Detection Table of Contents About Install Run Predictions Demo About An attempt to harness the power of Deep Learning to come up with a so
 30 Dec 16, 2022
This is a telegram bot hosted by a Raspberry Pi equipped with a temperature and humidity sensor. The bot is capable of sending plots and readings.
raspy-temperature-bot This is a telegram bot hosted by a Raspberry Pi equipped with a temperature and humidity sensor. The bot is capable of sending p
 31 May 22, 2022

System monitor - A python-based real-time system monitoring tool
System monitor A python-based real-time system monitoring tool Screenshots Installation Run My project with these commands pip install -r requiremen
 4 Feb 11, 2022
CURSO PROMETHEUS E GRAFANA: Observability in a real world
Curso de monitoração com o Prometheus Esse curso ensina como usar o Prometheus como uma ferramenta integrada de monitoração, entender seus conceitos,
 318 Dec 23, 2022

Slack bot for monitoring your Metaflow flows!
Metaflowbot - Slack Bot for your Metaflow flows! Metaflowbot makes it fun and easy to monitor your Metaflow runs, past and present. Imagine starting a
 21 Dec 7, 2022

esguard provides a Python decorator that waits for processing while monitoring the load of Elasticsearch.
esguard esguard provides a Python decorator that waits for processing while monitoring the load of Elasticsearch. Quick Start You need to launch elast
 5 Dec 8, 2021

Evidently helps analyze machine learning models during validation or production monitoring
Evidently helps analyze machine learning models during validation or production monitoring. The tool generates interactive visual reports and JSON profiles from pandas DataFrame or csv files. Currently 6 reports are available.
 3.1k Jan 7, 2023

Rubrix is a free and open-source tool for exploring and iterating on data for artificial intelligence projects.
Open-source tool for exploring, labeling, and monitoring data for AI projects
 1.5k Jan 7, 2023

Automatically find solutions when your Python code encounters an issue.
What The Python?! Helping you find answers to the errors Python spits out. Installation You can find the source code on GitHub at: https://github.com/
 139 Dec 14, 2022

Tool for ROS 2 IP Discovery + System Monitoring
Monitor the status of computers on a network using the DDS function of ROS2.
 33 Apr 3, 2022

🍃 A comprehensive monitoring and alerting solution for the status of your Chia farmer and harvesters.
chia-monitor A monitoring tool to collect all important metrics from your Chia farming node and connected harvesters. It can send you push notificatio
 153 Oct 21, 2022
Monitor your Binance portfolio
Binance Report Bot The intent of this bot is to take a snapshot of your binance wallet, e.g. the current balances and store it for further plotting. I
 37 Oct 29, 2022
An air quality monitoring service with a Raspberry Pi and a SDS011 sensor.
Raspberry Pi Air Quality Monitor A simple air quality monitoring service for the Raspberry Pi. Installation Clone the repository and run the following
 24 Dec 9, 2022

A Prometheus exporter for monitoring & analyzing Grafana Labs' technical documentation
grafana-docs-exporter A Prometheus exporter for monitoring & analyzing Grafana Labs' technical documentation Here is the public endpoint.
 5 May 2, 2022

Splunk Add-On to collect audit log events from Github Enterprise Cloud
GitHub Enterprise Audit Log Monitoring Splunk modular input plugin to fetch the enterprise audit log from GitHub Enterprise Support for modular inputs
 12 Aug 18, 2022

Restful Api developed with Flask using Prometheus and Grafana for monitoring and containerization with Docker :rocket:
Hephaestus 🚀 In Greek mythology, Hephaestus was either the son of Zeus and Hera or he was Hera's parthenogenous child. ... As a smithing god, Hephaes
 16 Oct 7, 2022

ClusterMonitor - a very simple python script which monitors and records the CPU and RAM consumption of submitted cluster jobs
ClusterMonitor A very simple python script which monitors and records the CPU and RAM consumption of submitted cluster jobs. Usage To start recording
 23 Oct 4, 2021
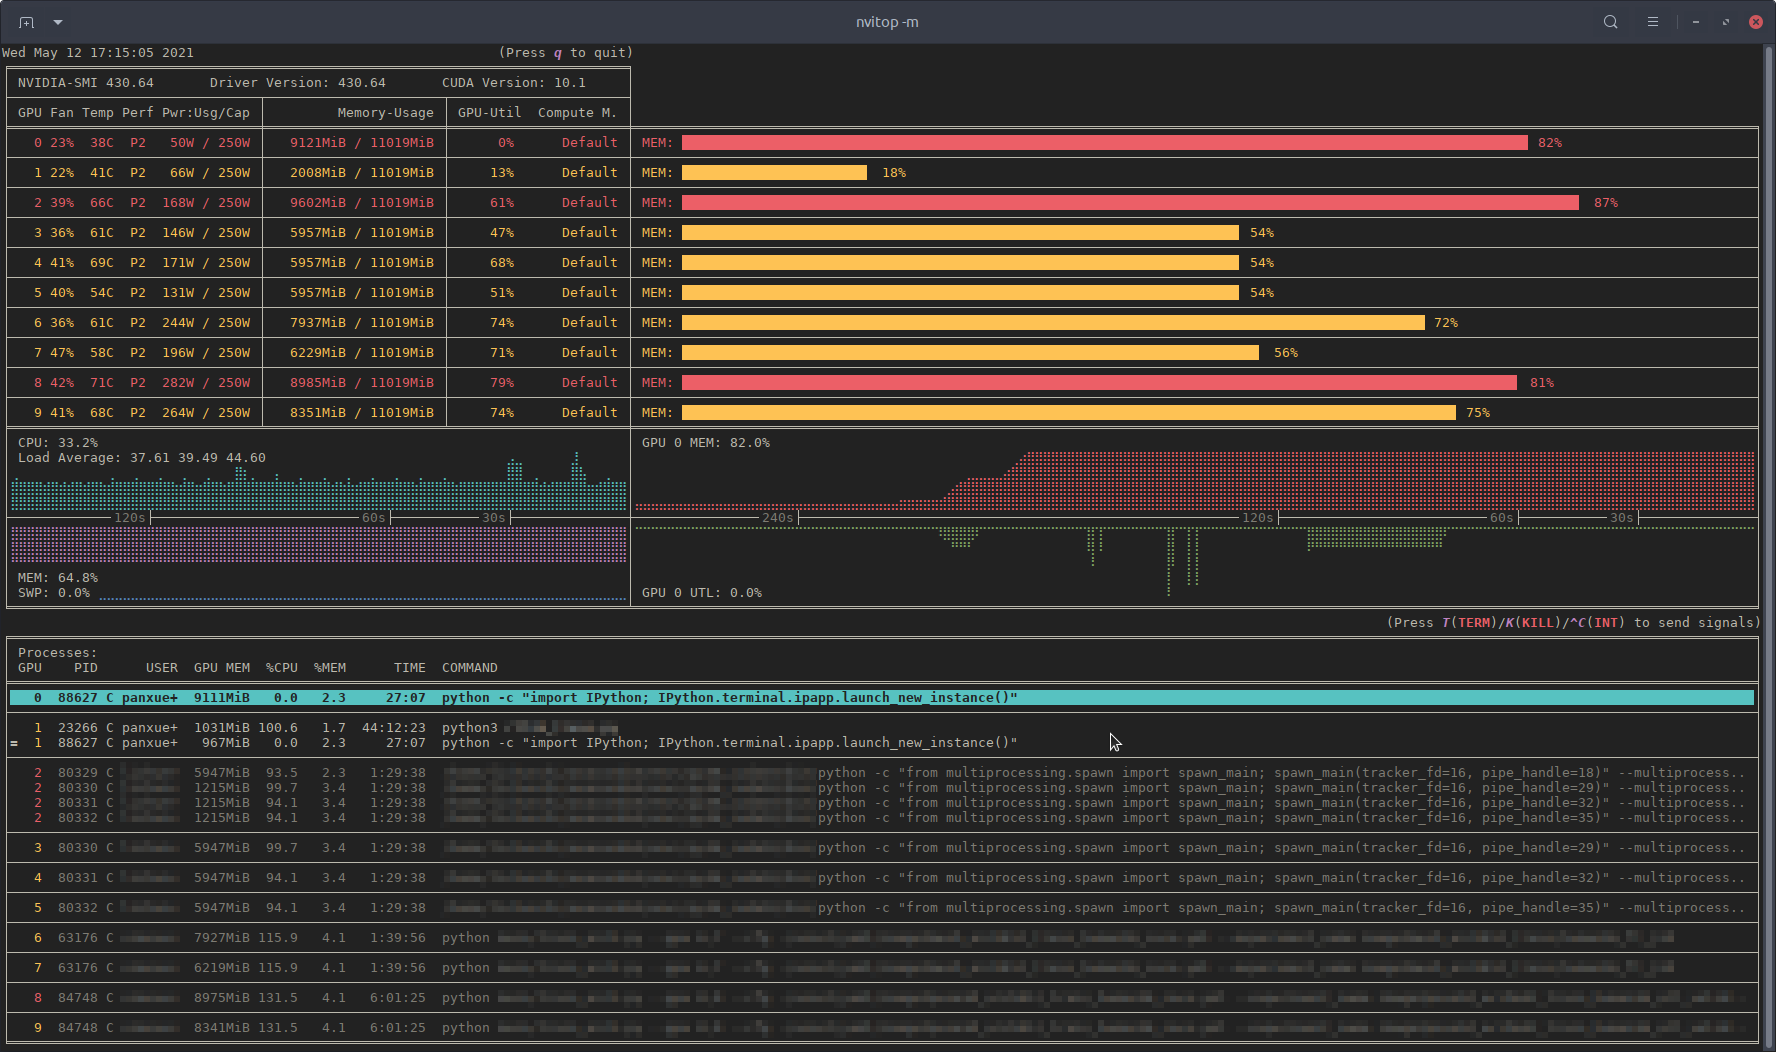
nvitop, an interactive NVIDIA-GPU process viewer, the one-stop solution for GPU process management
An interactive NVIDIA-GPU process viewer, the one-stop solution for GPU process management.
 1.3k Jan 2, 2023
Provide Prometheus url_sd compatible API Endpoint with data from Netbox
netbox-plugin-prometheus-sd Provide Prometheus http_sd compatible API Endpoint with data from Netbox. HTTP SD is a new feature in Prometheus and not a
 66 Dec 19, 2022

Push Prometheus metrics to VictoriaMetrics or other exporters
Push metrics from your periodic long-running jobs to existing Prometheus/VictoriaMetrics monitoring system.
 14 Nov 4, 2022
A new kind of Progress Bar, with real time throughput, eta and very cool animations!
A new kind of Progress Bar, with real time throughput, eta and very cool animations!
 4.1k Jan 8, 2023

Ransomware leak site monitoring
RansomWatch RansomWatch is a ransomware leak site monitoring tool. It will scrape all of the entries on various ransomware leak sites, store the data
 278 Dec 31, 2022

Graphsignal Logger
Graphsignal Logger Overview Graphsignal is an observability platform for monitoring and troubleshooting production machine learning applications. It h
143 Dec 5, 2022

Prometheus exporter for several chia node statistics
prometheus-chia-exporter Prometheus exporter for several chia node statistics It's assumed that the full node, the harvester and the wallet run on the
 30 Sep 19, 2022

A very lightweight monitoring system for Raspberry Pi clusters running Kubernetes.
OMNI A very lightweight monitoring system for Raspberry Pi clusters running Kubernetes. Why? When I finished my Kubernetes cluster using a few Raspber
 148 Dec 29, 2022
A watch dog providing a piece in mind that your Chia farm is running smoothly 24/7.
Photo by Zoltan Tukacs on Unsplash Watchdog for your Chia farm So you've become a Chia farmer and want to maximize the probability of getting a reward
 466 Dec 11, 2022

📊 A simple command-line utility for querying and monitoring GPU status
gpustat Just less than nvidia-smi? NOTE: This works with NVIDIA Graphics Devices only, no AMD support as of now. Contributions are welcome! Self-Promo
 3.2k Jan 4, 2023
Repositorio oficial del curso IIC2233 Programación Avanzada 🚀✨
IIC2233 - Programación Avanzada Evaluación Las evaluaciones serán efectuadas por medio de actividades prácticas en clases y tareas. Se calculará la no
 0 Dec 15, 2022
Flexible and scalable monitoring framework
Presentation of the Shinken project Welcome to the Shinken project. Shinken is a modern, Nagios compatible monitoring framework, written in Python. It
 1.1k Dec 18, 2022
A colony of interacting processes
NColony Infrastructure for running "colonies" of processes. Hacking $ tox Should DTRT -- if it passes, it means unit tests are passing, and 100% cover
 23 Apr 4, 2022

A cron monitoring tool written in Python & Django
Healthchecks Healthchecks is a cron job monitoring service. It listens for HTTP requests and email messages ("pings") from your cron jobs and schedule
 5.8k Jan 2, 2023
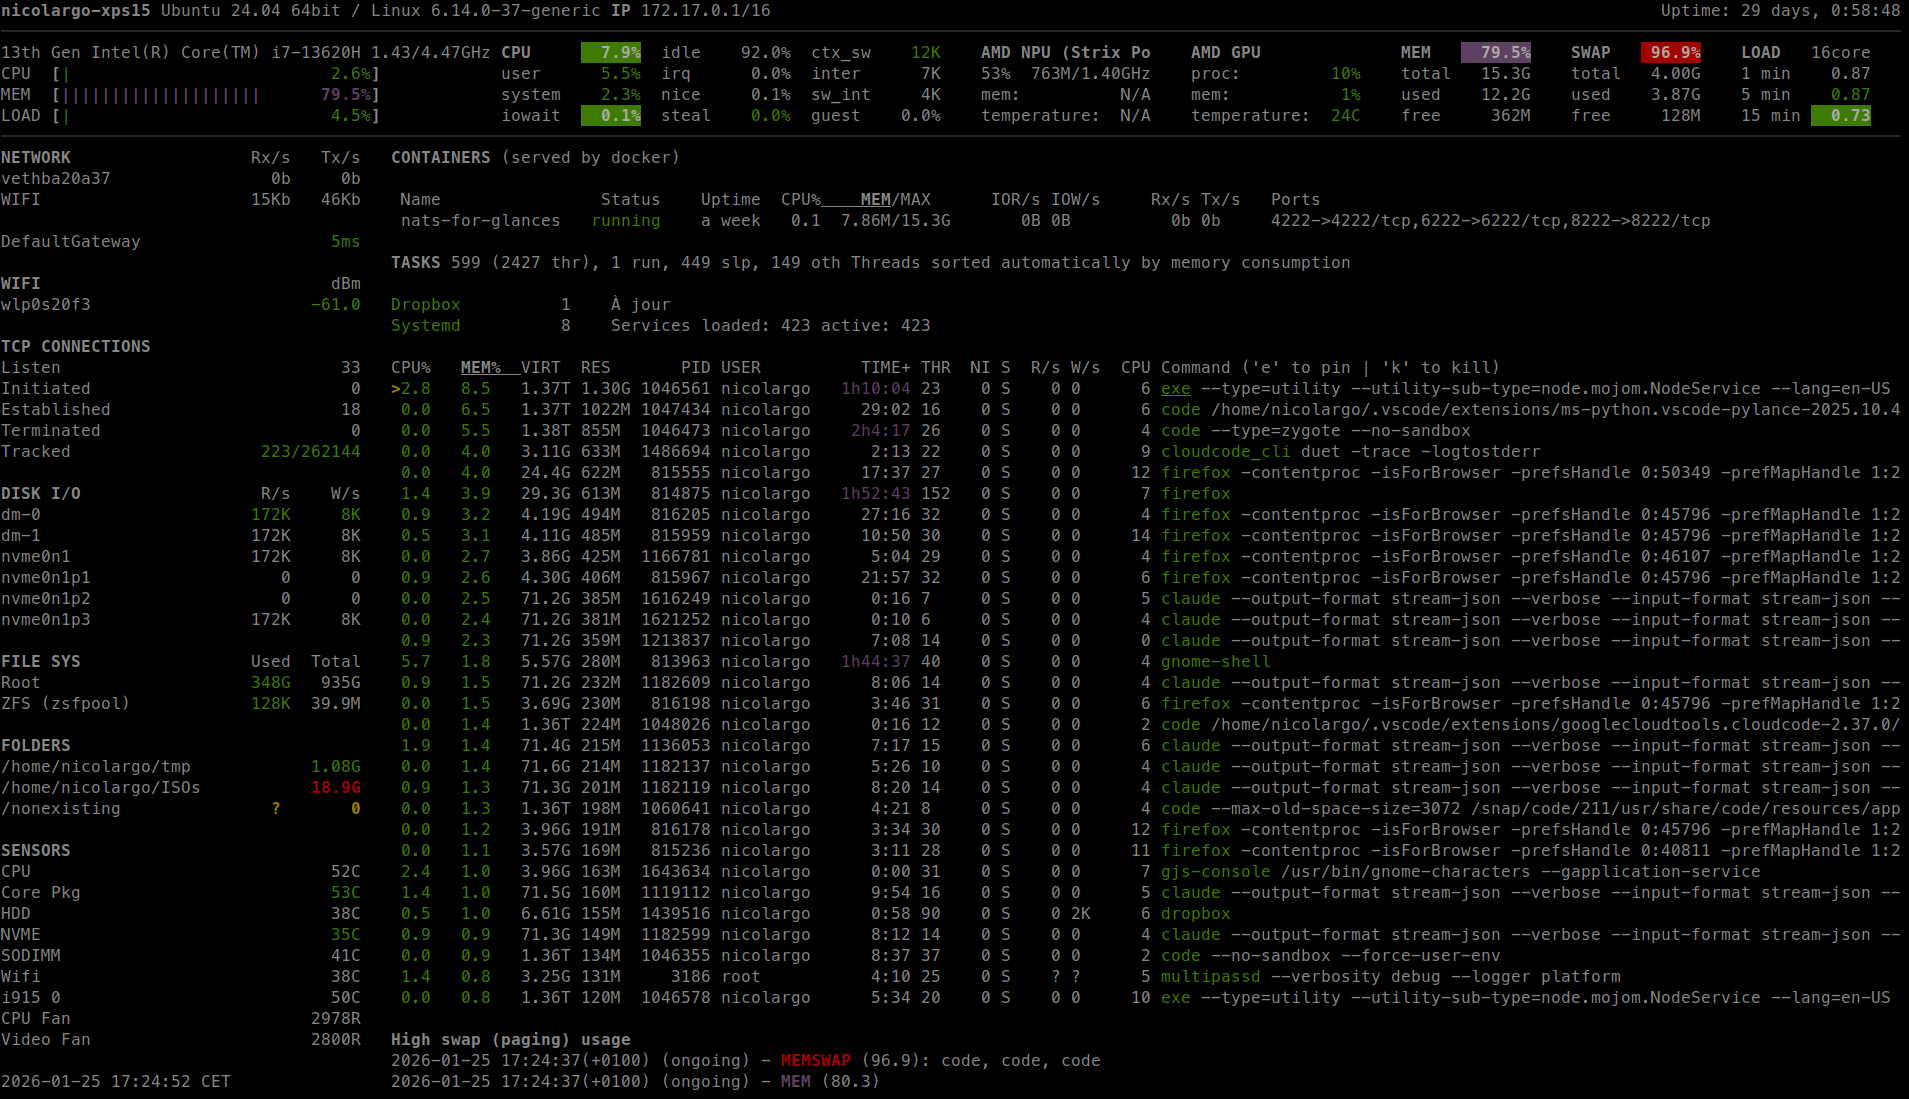
Glances an Eye on your system. A top/htop alternative for GNU/Linux, BSD, Mac OS and Windows operating systems.
Glances - An eye on your system Summary Glances is a cross-platform monitoring tool which aims to present a large amount of monitoring information thr
 22k Jan 8, 2023
Daemon to ban hosts that cause multiple authentication errors
__ _ _ ___ _ / _|__ _(_) |_ ) |__ __ _ _ _ | _/ _` | | |/ /| '_ \/ _` | ' \
 7.8k Jan 9, 2023
Algorithms for monitoring and explaining machine learning models
Alibi is an open source Python library aimed at machine learning model inspection and interpretation. The focus of the library is to provide high-qual
 1.9k Dec 30, 2022

Social Distancing Detector using deep learning and capable to run on edge AI devices such as NVIDIA Jetson, Google Coral, and more.
Smart Social Distancing Smart Social Distancing Introduction Getting Started Prerequisites Usage Processor Optional Parameters Configuring AWS credent
 129 Dec 12, 2022
Minimal example utilizing fastapi and celery with RabbitMQ for task queue, Redis for celery backend and flower for monitoring the celery tasks.
FastAPI with Celery Minimal example utilizing FastAPI and Celery with RabbitMQ for task queue, Redis for Celery backend and flower for monitoring the
 371 Jan 1, 2023
A Prometheus Python client library for asyncio-based applications
aioprometheus aioprometheus is a Prometheus Python client library for asyncio-based applications. It provides metrics collection and serving capabilit
 132 Dec 28, 2022

changedetection.io - The best and simplest self-hosted website change detection monitoring service
changedetection.io - The best and simplest self-hosted website change detection monitoring service. An alternative to Visualping, Watchtower etc. Designed for simplicity - the main goal is to simply monitor which websites had a text change. Open source web page change detection.
 7.3k Jan 1, 2023
MazeRL is an application oriented Deep Reinforcement Learning (RL) framework
MazeRL is an application oriented Deep Reinforcement Learning (RL) framework, addressing real-world decision problems. Our vision is to cover the complete development life cycle of RL applications ranging from simulation engineering up to agent development, training and deployment.
 222 Dec 24, 2022
🍯 16 honeypots in a single pypi package (DNS, HTTP Proxy, HTTP, HTTPS, SSH, POP3, IMAP, STMP, VNC, SMB, SOCKS5, Redis, TELNET, Postgres & MySQL)
Easy to setup customizable honeypots for monitoring network traffic, bots activities and username\password credentials. The current available honeypot
 259 Dec 31, 2022

Kong API Manager with Prometheus And Splunk
API Manager Stack Run Kong Server + Konga + Prometheus + Grafana + API & DDBB + Splunk Clone the proyect and run docker-compose up
 82 Nov 26, 2022

A demo of Prometheus+Grafana for monitoring an ML model served with FastAPI.
ml-monitoring Jeremy Jordan This repository provides an example setup for monitoring an ML system deployed on Kubernetes.
 176 Jan 1, 2023

Todos os exercícios do Curso de Python, do canal Curso em Vídeo, resolvidos em Python, Javascript, Java, C++, C# e mais...
Exercícios - CeV Oferecido por Linguagens utilizadas atualmente O que vai encontrar aqui? 👀 Esse repositório é dedicado a armazenar todos os enunciad
 43 Nov 10, 2022
Flower is a web based tool for monitoring and administrating Celery clusters.
Real-time monitor and web admin for Celery distributed task queue
 5.5k Jan 2, 2023
Prometheus integration for Starlette.
Starlette Prometheus Introduction Prometheus integration for Starlette. Requirements Python 3.6+ Starlette 0.9+ Installation $ pip install starlette-p
 125 Feb 13, 2021
Prometheus exporter for Starlette and FastAPI
starlette_exporter Prometheus exporter for Starlette and FastAPI. The middleware collects basic metrics: Counter: starlette_requests_total Histogram:
 82 Feb 13, 2021
Instrument your FastAPI app
Prometheus FastAPI Instrumentator A configurable and modular Prometheus Instrumentator for your FastAPI. Install prometheus-fastapi-instrumentator fro
 55 Feb 17, 2021
Prometheus integration for Starlette.
Starlette Prometheus Introduction Prometheus integration for Starlette. Requirements Python 3.6+ Starlette 0.9+ Installation $ pip install starlette-p
229 Dec 21, 2022
Instrument your FastAPI app
Prometheus FastAPI Instrumentator A configurable and modular Prometheus Instrumentator for your FastAPI. Install prometheus-fastapi-instrumentator fro
441 Jan 5, 2023
Glances an Eye on your system. A top/htop alternative for GNU/Linux, BSD, Mac OS and Windows operating systems.
Glances - An eye on your system Summary Glances is a cross-platform monitoring tool which aims to present a large amount of monitoring information thr
22k Jan 4, 2023
Cross-platform lib for process and system monitoring in Python
Home Install Documentation Download Forum Blog Funding What's new Summary psutil (process and system utilities) is a cross-platform library for retrie
 9k Jan 2, 2023
Inject code into running Python processes
pyrasite Tools for injecting arbitrary code into running Python processes. homepage: http://pyrasite.com documentation: http://pyrasite.rtfd.org downl
 2.7k Jan 8, 2023
A new kind of Progress Bar, with real time throughput, eta and very cool animations!
alive-progress :) A new kind of Progress Bar, with real-time throughput, eta and very cool animations! Ever found yourself in a remote ssh session, do
4k Dec 30, 2022
Monitoring tool based on radon
xenon Xenon is a monitoring tool based on Radon. It monitors your code's complexity. Ideally, Xenon is run every time you commit code. Through command
 218 Dec 5, 2022
Prometheus instrumentation library for Python applications
Prometheus Python Client The official Python 2 and 3 client for Prometheus. Three Step Demo One: Install the client: pip install prometheus-client Tw
 3.2k Jan 7, 2023
Prometheus exporter for Starlette and FastAPI
starlette_exporter Prometheus exporter for Starlette and FastAPI. The middleware collects basic metrics: Counter: starlette_requests_total Histogram:
225 Jan 5, 2023

a flask profiler which watches endpoint calls and tries to make some analysis.
Flask-profiler version: 1.8 Flask-profiler measures endpoints defined in your flask application; and provides you fine-grained report through a web in
 718 Dec 20, 2022
Prometheus integration for Starlette.
Starlette Prometheus Introduction Prometheus integration for Starlette. Requirements Python 3.6+ Starlette 0.9+ Installation $ pip install starlette-p
229 Dec 21, 2022
GoAccess is a real-time web log analyzer and interactive viewer that runs in a terminal in *nix systems or through your browser.
GoAccess What is it? GoAccess is an open source real-time web log analyzer and interactive viewer that runs in a terminal on *nix systems or through y
 15.6k Jan 2, 2023

Prometheus exporter for Flask applications
Prometheus Flask exporter This library provides HTTP request metrics to export into Prometheus. It can also track method invocations using convenient
 535 Dec 23, 2022
Real-time metrics for nginx server
ngxtop - real-time metrics for nginx server (and others) ngxtop parses your nginx access log and outputs useful, top-like, metrics of your nginx serve
 6.4k Dec 22, 2022

Automatically monitor the evolving performance of Flask/Python web services.
Flask Monitoring Dashboard A dashboard for automatic monitoring of Flask web-services. Key Features • How to use • Live Demo • Feedback • Documentatio
 663 Dec 29, 2022
Prometheus instrumentation library for Python applications
Prometheus Python Client The official Python 2 and 3 client for Prometheus. Three Step Demo One: Install the client: pip install prometheus-client Tw
3.2k Jan 7, 2023
Sentry is cross-platform application monitoring, with a focus on error reporting.
Users and logs provide clues. Sentry provides answers. What's Sentry? Sentry is a service that helps you monitor and fix crashes in realtime. The serv
33k Jan 4, 2023
Soda SQL Data testing, monitoring and profiling for SQL accessible data.
Soda SQL Data testing, monitoring and profiling for SQL accessible data. What does Soda SQL do? Soda SQL allows you to Stop your pipeline when bad dat
 51 Jan 1, 2023
This repository contains code examples and documentation for learning how applications can be developed with Kubernetes
BigBitBus KAT Components Click on the diagram to enlarge, or follow this link for detailed documentation Introduction Welcome to the BigBitBus Kuberne
 51 Oct 16, 2022

HTTP(s) "monitoring" webpage via FastAPI+Jinja2. Inspired by https://github.com/RaymiiOrg/bash-http-monitoring
python-http-monitoring HTTP(s) "monitoring" powered by FastAPI+Jinja2+aiohttp. Inspired by bash-http-monitoring. Installation can be done with pipenv
 39 Aug 26, 2022

Debugging, monitoring and visualization for Python Machine Learning and Data Science
Welcome to TensorWatch TensorWatch is a debugging and visualization tool designed for data science, deep learning and reinforcement learning from Micr
 3.3k Dec 27, 2022
Tools for writing, submitting, debugging, and monitoring Storm topologies in pure Python
Petrel Tools for writing, submitting, debugging, and monitoring Storm topologies in pure Python. NOTE: The base Storm package provides storm.py, which
 247 Dec 18, 2021
Cross-platform lib for process and system monitoring in Python
Home Install Documentation Download Forum Blog Funding What's new Summary psutil (process and system utilities) is a cross-platform library for retrie
9k Jan 2, 2023
Real-time monitor and web admin for Celery distributed task queue
Flower Flower is a web based tool for monitoring and administrating Celery clusters. Features Real-time monitoring using Celery Events Task progress a
5.5k Dec 28, 2022