Create 3d loss surface visualizations, with optimizer path. Issues welcome!

Overview

MLVTK PyPI - Python Version PyPI

A loss surface visualization tool

Png

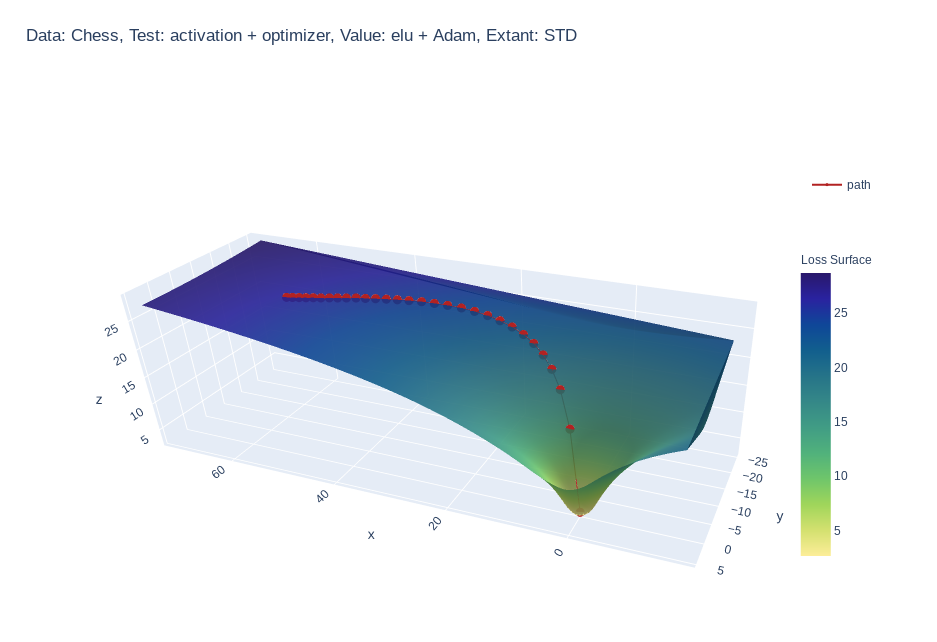
Simple feed-forward network trained on chess data, using elu activation and Adam optimizer


Gif

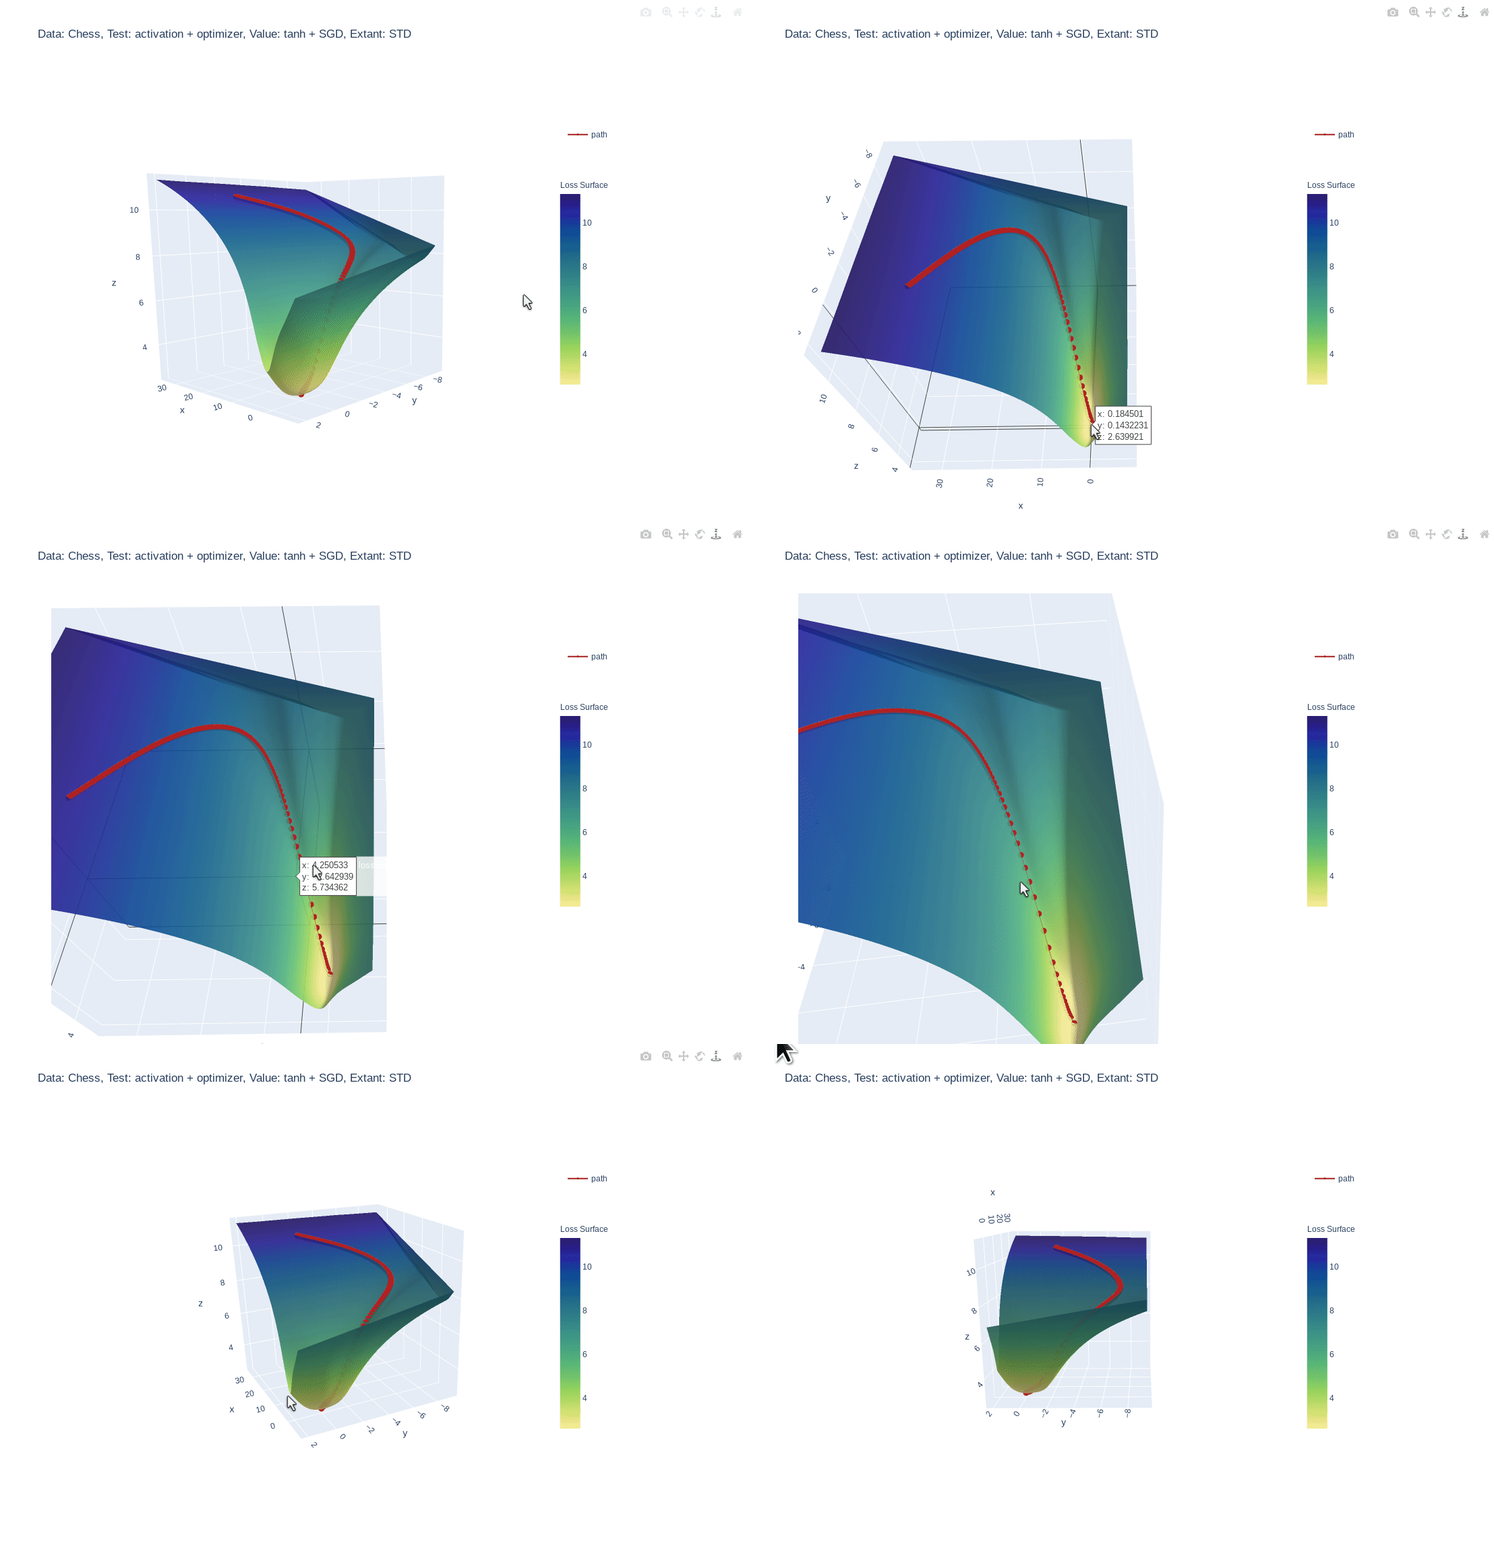
Simple feed-forward network trained on chess data, using tanh activation and SGD optimizer


Gif

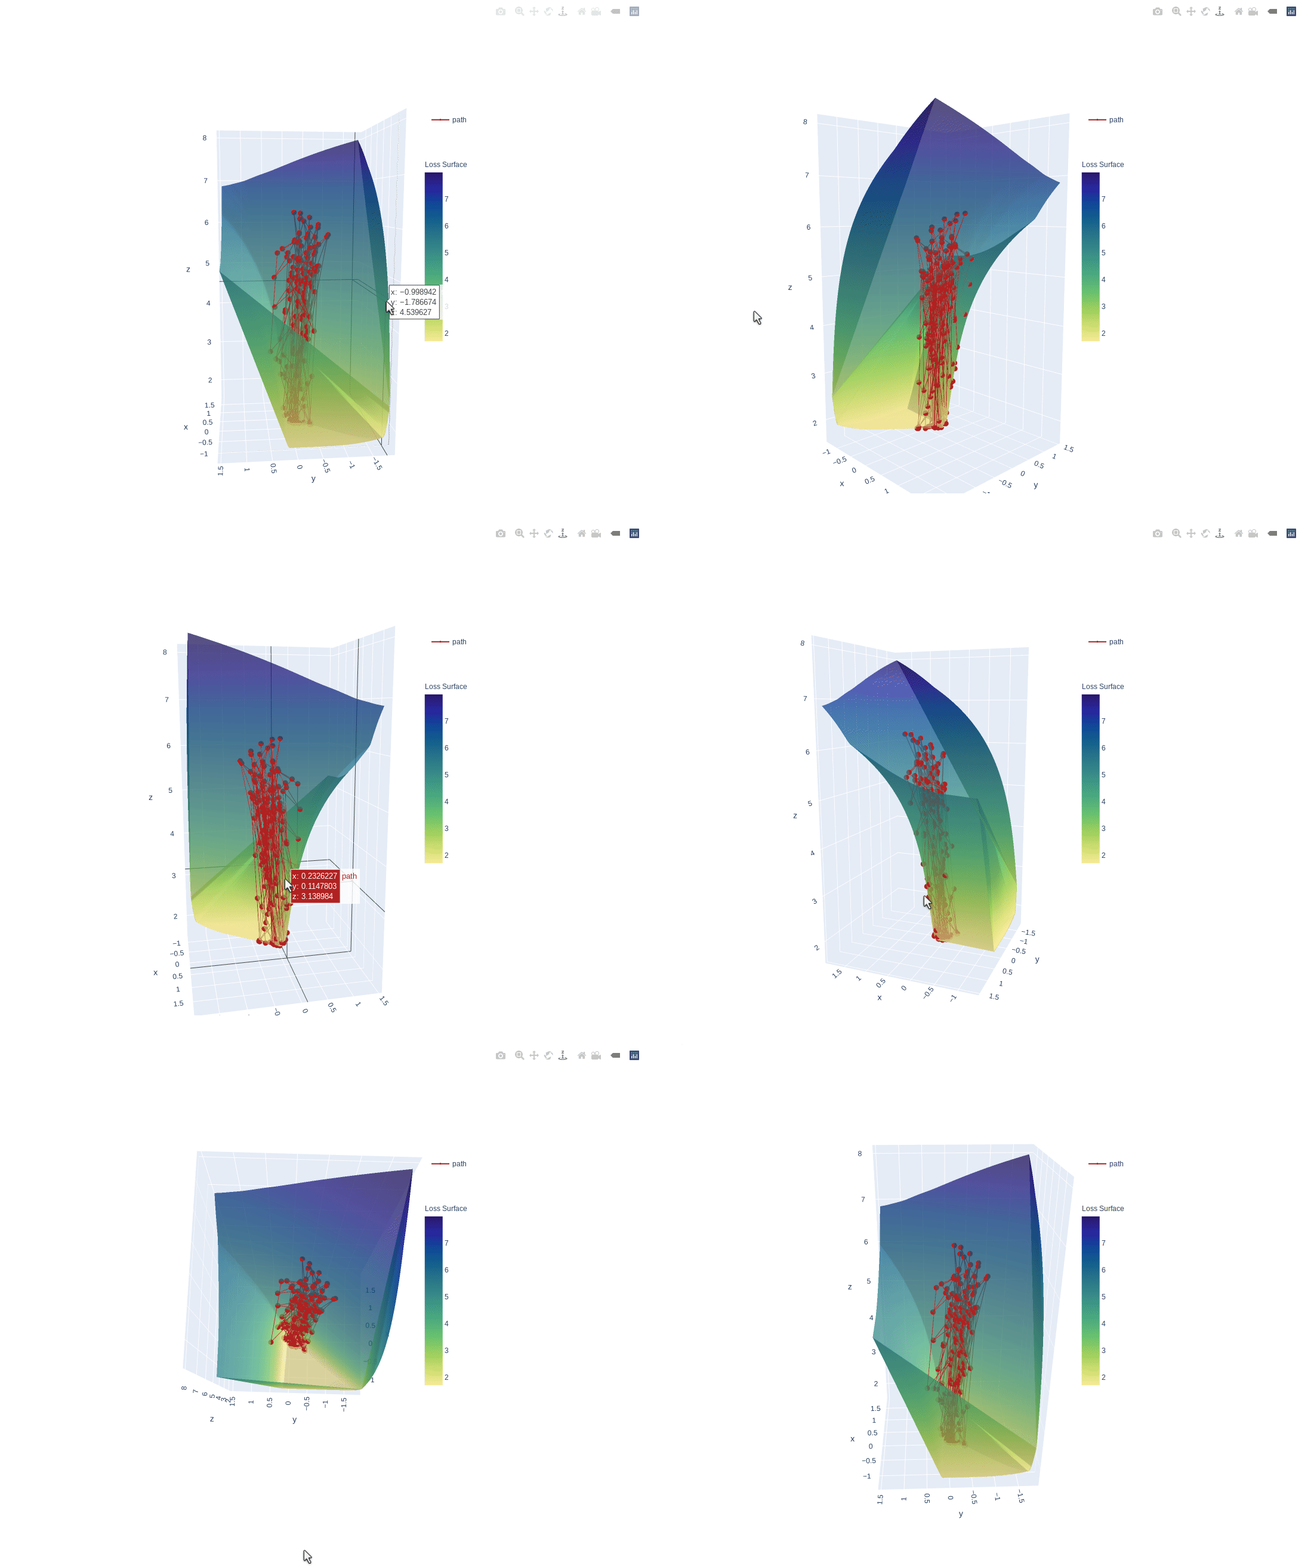
3 layer feed-forward network trained on hand written letters data, using relu activation, SGD optimizer and learning rate of 2.0. Example of what happens to path when learning rate is too high


Gif

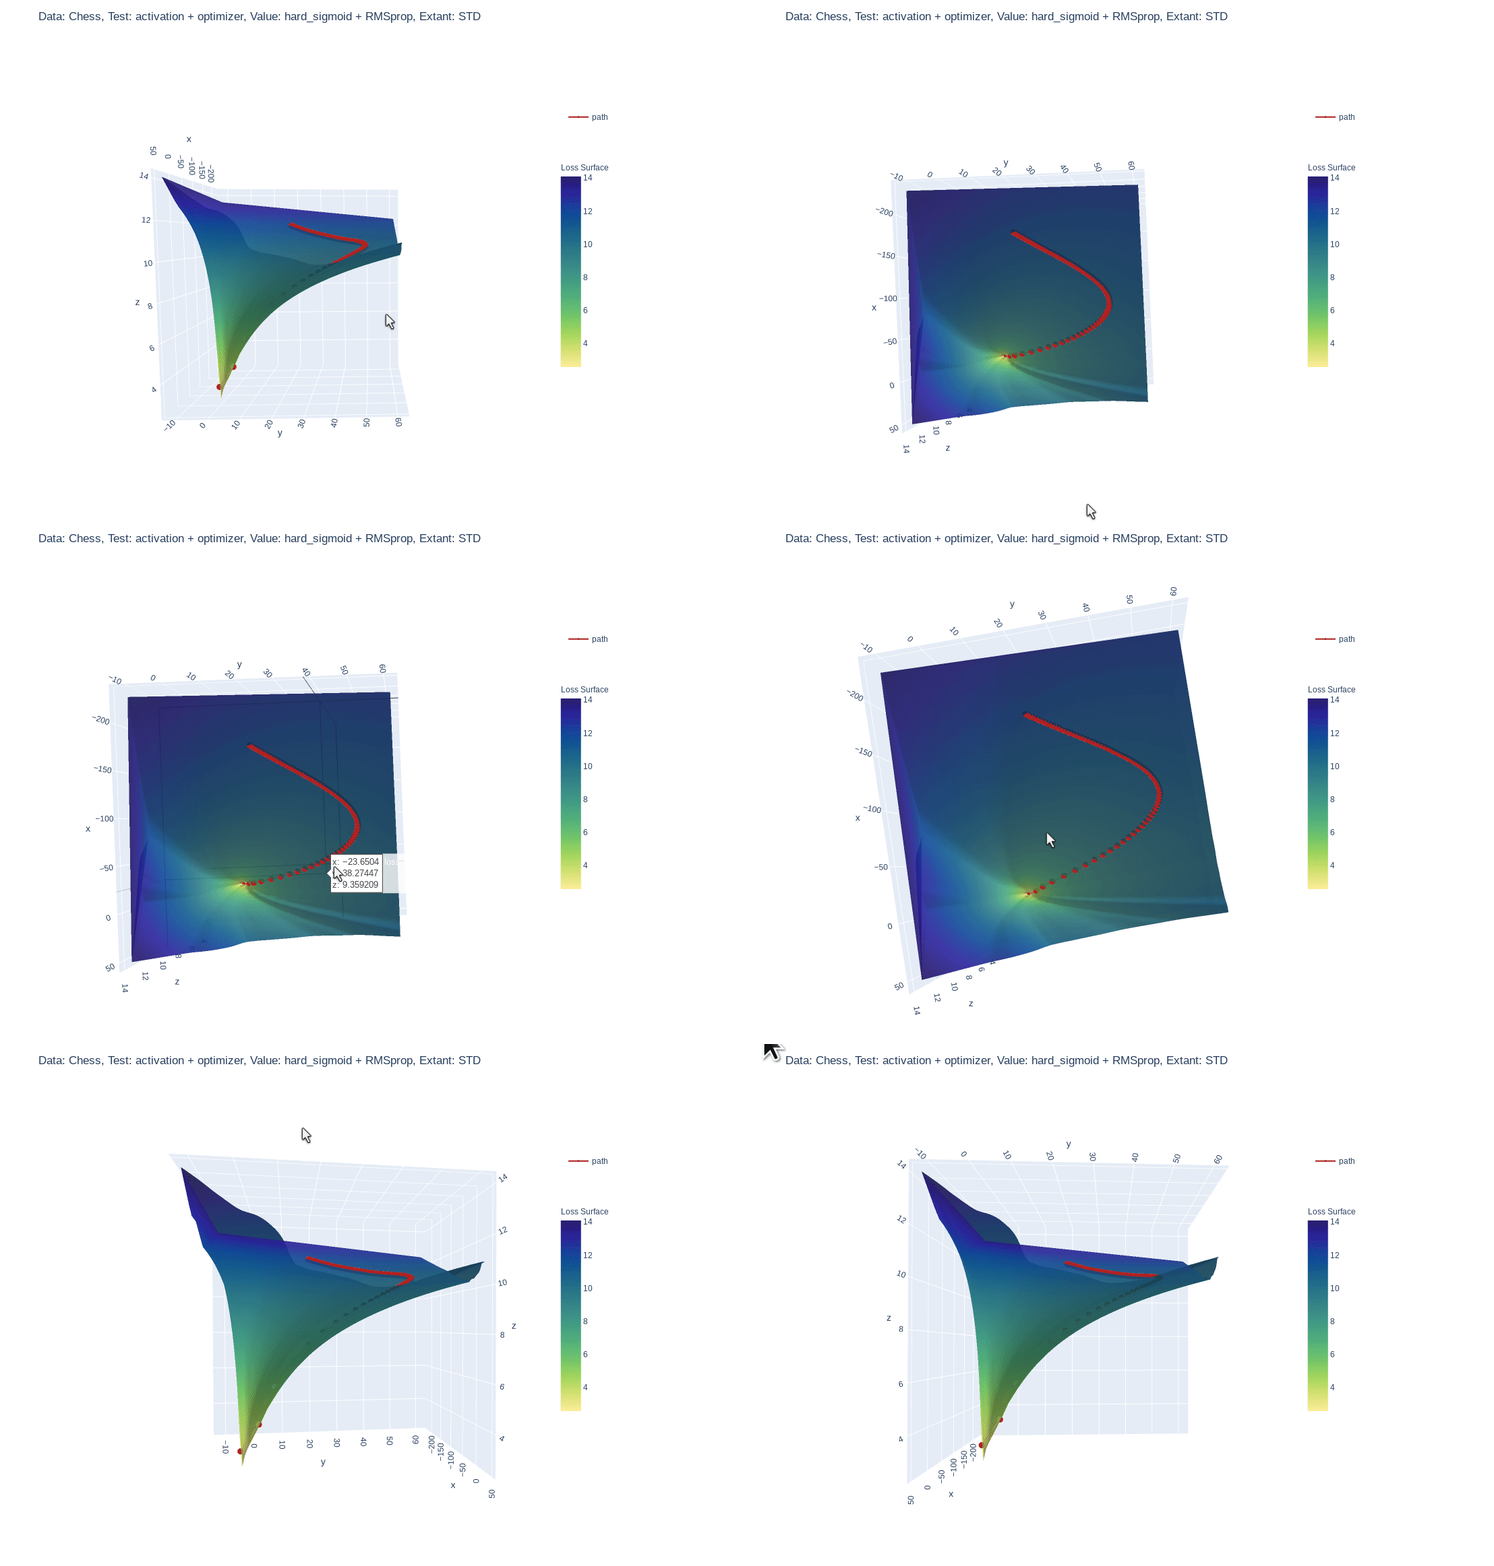
Simple feed-forward network trained on chess data, using hard-sigmoid activation and RMSprop optimizer

Why?

  • :shipit: Simple: A single line addition is all that is needed.
  • Informative: Gain insight into what your model is seeing.
  • 📓 Educational: See how your hyper parameters and architecture impact your models perception.

Quick Start

Requires version
python >= 3.6.1
tensorflow >= 2.3.1
plotly >=4.9.0

Install locally (Also works in google Colab!):

pip install mlvtk

Optionally for use with jupyter notebook/lab:

Notebook

=5.3" "ipywidgets==7.5"">
pip install "notebook>=5.3" "ipywidgets==7.5"

Lab

pip install jupyterlab "ipywidgets==7.5"

# Basic JupyterLab renderer support
jupyter labextension install [email protected]

# OPTIONAL: Jupyter widgets extension for FigureWidget support
jupyter labextension install @jupyter-widgets/jupyterlab-manager [email protected]

Basic Example

from mlvtk.base import Vmodel
import tensorflow as tf
import numpy as np

# NN with 1 hidden layer
inputs = tf.keras.layers.Input(shape=(None,100))
dense_1 = tf.keras.layers.Dense(50, activation='relu')(inputs)
outputs = tf.keras.layers.Dense(10, activation='softmax')(dense_1)
_model = tf.keras.Model(inputs, outputs)

# Wrap with Vmodel
model = Vmodel(_model)
model.compile(optimizer=tf.keras.optimizers.SGD(),
loss=tf.keras.losses.CategoricalCrossentropy(), metrics=['accuracy'])

# All tf.keras.(Model/Sequential/Functional) methods/properties are accessible
# from Vmodel

model.summary()
model.get_config()
model.get_weights()
model.layers

# Create random example data
x = np.random.rand(3, 10, 100)
y = np.random.randint(9, size=(3, 10, 10))
xval = np.random.rand(1, 10, 100)
yval = np.random.randint(9, size=(1,10,10))

# Only difference, model.fit requires validation_data (tf.data.Dataset, or
# other container
history = model.fit(x, y, validation_data=(xval, yval), epochs=10, verbose=0)

# Calling model.surface_plot() returns a plotly.graph_objs.Figure
# model.surface_plot() will attempt to display the figure inline

fig = model.surface_plot()

# fig can save an interactive plot to an html file,
fig.write_html("surface_plot.html")

# or display the plot in jupyter notebook/lab or other compatible tool.
fig.show()
You might also like...
These data visualizations were created for my introductory computer science course using Python

Homework 2: Matplotlib and Data Visualization Overview These data visualizations were created for my introductory computer science course using Python

These data visualizations were created as homework for my CS40 class. I hope you enjoy!

Data Visualizations These data visualizations were created as homework for my CS40 class. I hope you enjoy! Nobel Laureates by their Country of Birth

Generate visualizations of GitHub user and repository statistics using GitHub Actions.

GitHub Stats Visualization Generate visualizations of GitHub user and repository statistics using GitHub Actions. This project is currently a work-in-

A Python package for caclulations and visualizations in geological sciences.

geo_calcs A Python package for caclulations and visualizations in geological sciences. Free software: MIT license Documentation: https://geo-calcs.rea

Make scripted visualizations in blender

Scripted visualizations in blender The goal of this project is to script 3D scientific visualizations using blender. To achieve this, we aim to bring

Standardized plots and visualizations in Python

Standardized plots and visualizations in Python pltviz is a Python package for standardized visualization. Routine and novel plotting approaches are f

Generate visualizations of GitHub user and repository statistics using GitHub Actions.

GitHub Stats Visualization Generate visualizations of GitHub user and repository statistics using GitHub Actions. This project is currently a work-in-

Visualizations of some specific solutions of different differential equations.

Diff_sims Visualizations of some specific solutions of different differential equations. Heat Equation in 1 Dimension (A very beautiful and elegant ex

Data aggregated from the reports found at the MCPS COVID Dashboard into a set of visualizations.

Montgomery County Public Schools COVID-19 Visualizer Contents About this project Data Support this project About this project Data All data we use can

Owner
Research analyst
null
Automatically Visualize any dataset, any size with a single line of code. Created by Ram Seshadri. Collaborators Welcome. Permission Granted upon Request.

AutoViz Automatically Visualize any dataset, any size with a single line of code. AutoViz performs automatic visualization of any dataset with one lin

AutoViz and Auto_ViML 1k Jan 2, 2023
Automatically Visualize any dataset, any size with a single line of code. Created by Ram Seshadri. Collaborators Welcome. Permission Granted upon Request.

AutoViz Automatically Visualize any dataset, any size with a single line of code. AutoViz performs automatic visualization of any dataset with one lin

AutoViz and Auto_ViML 299 Feb 13, 2021
Sprint planner considering JIRA issues and google calendar meetings schedule.

Sprint planner Sprint planner is a Python script for planning your Jira tasks based on your calendar availability. Installation Use the package manage

Apptension 2 Dec 5, 2021
Visualizations for machine learning datasets

Introduction The facets project contains two visualizations for understanding and analyzing machine learning datasets: Facets Overview and Facets Dive

PAIR code 7.1k Jan 7, 2023
Visualizations for machine learning datasets

Introduction The facets project contains two visualizations for understanding and analyzing machine learning datasets: Facets Overview and Facets Dive

PAIR code 6.5k Feb 17, 2021
A collection of 100 Deep Learning images and visualizations

A collection of Deep Learning images and visualizations. The project has been developed by the AI Summer team and currently contains almost 100 images.

AI Summer 65 Sep 12, 2022
Visualizations of linear algebra algorithms for people who want a deep understanding

Visualising algorithms on symmetric matrices Examples QR algorithm and LR algorithm Here, we have a GIF animation of an interactive visualisation of t

ogogmad 3 May 5, 2022
GitHub Stats Visualizations : Transparent

GitHub Stats Visualizations : Transparent Generate visualizations of GitHub user and repository statistics using GitHub Actions. ⚠️ Disclaimer The pro

YuanYap 7 Apr 5, 2022
📊📈 Serves up Pandas dataframes via the Django REST Framework for use in client-side (i.e. d3.js) visualizations and offline analysis (e.g. Excel)

???? Serves up Pandas dataframes via the Django REST Framework for use in client-side (i.e. d3.js) visualizations and offline analysis (e.g. Excel)

wq framework 1.2k Jan 1, 2023
Glue is a python project to link visualizations of scientific datasets across many files.

Glue Glue is a python project to link visualizations of scientific datasets across many files. Click on the image for a quick demo: Features Interacti

null 675 Dec 9, 2022