These data visualizations were created for my introductory computer science course using Python

Overview

Homework 2: Matplotlib and Data Visualization

Overview

These data visualizations were created for my introductory computer science course using Python. The purpose of this homework assignment was to familiarize ourselves with Matplotlib and CSV files.

Five Most Common Ages of Bachelor contestants

Ages

In this pie chart, I wanted to look into the five most common ages of Bachelor contestants. The percentages displayed on the pie chart show the percentage each age constitutes out of the five ages. It is important to note that while these percentages add up to 100%, the ages of Bachelor contestants are not contained within these five numbers.

A big thank you to Adam Erispaha for creating this CSV file. All of this data was sourced from Data World.

More datasets on Bachelor contestants can be found at the same website!

Player Performance

Player Performance

For my second plot, I created a grouped bar chart. Here, I analyzed a few statistics of specific NBA players. I used the data of their True Shooting %(TS%), 3 Point Attempt Rate(3PAr), Free Throw Attempt Rate(FTr) to see how they are performing. It is important to note that the statistics are not completely up to date. This was solely created based off of the data from the CSV file.

A big thank you to Umut Alpaydin for creating this CSV file. All of this data was sourced from Kaggle.

If you are interested in learning what these statistics mean, below are some good articles to read more about these terms:

  1. True Shooting Percentage
  2. Basketball Glossary

The project instructions can be found here! More datasets on the NBA 2020-2021 Season Player Stats can be found at the same website!

Credits

Here are some helpful resources I used for this project:

  1. Corey Schafer's Matplotlib Playlist
  2. Article on How to Create a Grouped Bar Chart with Pandas
  3. Video on How to Create a Grouped Bar Chart with Pandas
  4. CSV files and Pandas
You might also like...
A collection of 100 Deep Learning images and visualizations

A collection of Deep Learning images and visualizations. The project has been developed by the AI Summer team and currently contains almost 100 images.

Visualizations of linear algebra algorithms for people who want a deep understanding

Visualising algorithms on symmetric matrices Examples QR algorithm and LR algorithm Here, we have a GIF animation of an interactive visualisation of t

 GitHub Stats Visualizations : Transparent
GitHub Stats Visualizations : Transparent

GitHub Stats Visualizations : Transparent Generate visualizations of GitHub user and repository statistics using GitHub Actions. ⚠️ Disclaimer The pro

📊📈 Serves up Pandas dataframes via the Django REST Framework for use in client-side (i.e. d3.js) visualizations and offline analysis (e.g. Excel)

📊📈 Serves up Pandas dataframes via the Django REST Framework for use in client-side (i.e. d3.js) visualizations and offline analysis (e.g. Excel)

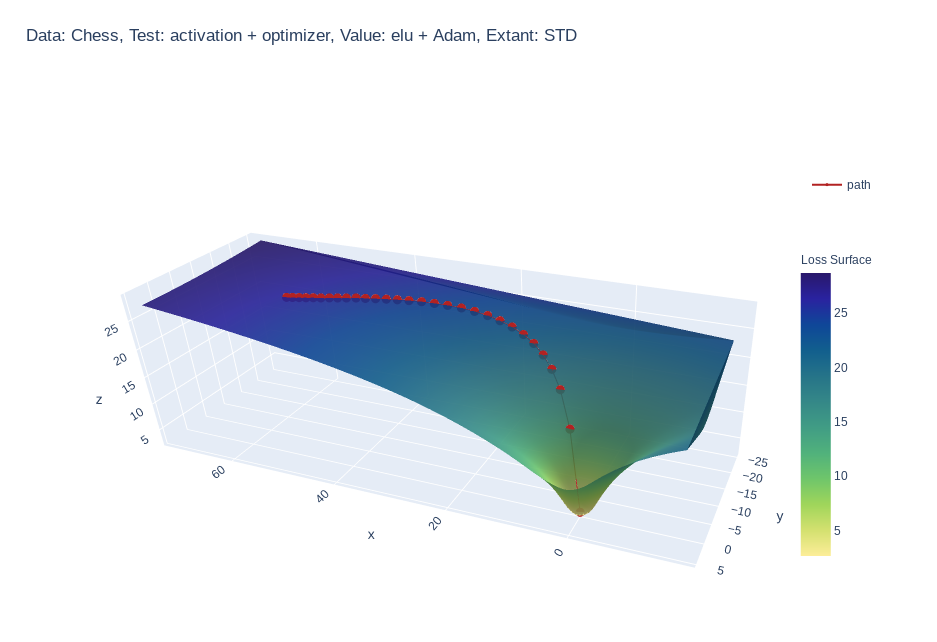
Create 3d loss surface visualizations, with optimizer path. Issues welcome!

MLVTK A loss surface visualization tool Simple feed-forward network trained on chess data, using elu activation and Adam optimizer Simple feed-forward

Make scripted visualizations in blender

Scripted visualizations in blender The goal of this project is to script 3D scientific visualizations using blender. To achieve this, we aim to bring

Visualizations of some specific solutions of different differential equations.

Diff_sims Visualizations of some specific solutions of different differential equations. Heat Equation in 1 Dimension (A very beautiful and elegant ex

Create matplotlib visualizations from the command-line

MatplotCLI Create matplotlib visualizations from the command-line MatplotCLI is a simple utility to quickly create plots from the command-line, levera

Debugging, monitoring and visualization for Python Machine Learning and Data Science

Welcome to TensorWatch TensorWatch is a debugging and visualization tool designed for data science, deep learning and reinforcement learning from Micr

Owner
Sophia Huang
Sophia Huang
metedraw is a project mainly for data visualization projects of Atmospheric Science, Marine Science, Environmental Science or other majors

It is mainly for data visualization projects of Atmospheric Science, Marine Science, Environmental Science or other majors.

Nephele 11 Jul 5, 2022
Displaying plot of death rates from past years in Poland. Data source from these years is in readme

Average-Death-Rate Displaying plot of death rates from past years in Poland The goal collect the data from a CSV file count the ADR (Average Death Rat

Oliwier Szymański 0 Sep 12, 2021
Data aggregated from the reports found at the MCPS COVID Dashboard into a set of visualizations.

Montgomery County Public Schools COVID-19 Visualizer Contents About this project Data Support this project About this project Data All data we use can

James 3 Jan 19, 2022
Generate visualizations of GitHub user and repository statistics using GitHub Actions.

GitHub Stats Visualization Generate visualizations of GitHub user and repository statistics using GitHub Actions. This project is currently a work-in-

JoelImgu 3 Dec 14, 2022
Generate visualizations of GitHub user and repository statistics using GitHub Actions.

GitHub Stats Visualization Generate visualizations of GitHub user and repository statistics using GitHub Actions. This project is currently a work-in-

Aditya Thakekar 1 Jan 11, 2022
Glue is a python project to link visualizations of scientific datasets across many files.

Glue Glue is a python project to link visualizations of scientific datasets across many files. Click on the image for a quick demo: Features Interacti

null 675 Dec 9, 2022
A Python package for caclulations and visualizations in geological sciences.

geo_calcs A Python package for caclulations and visualizations in geological sciences. Free software: MIT license Documentation: https://geo-calcs.rea

Drew Heasman 1 Jul 12, 2022
Standardized plots and visualizations in Python

Standardized plots and visualizations in Python pltviz is a Python package for standardized visualization. Routine and novel plotting approaches are f

Andrew Tavis McAllister 0 Jul 9, 2022
Visualizations for machine learning datasets

Introduction The facets project contains two visualizations for understanding and analyzing machine learning datasets: Facets Overview and Facets Dive

PAIR code 7.1k Jan 7, 2023
Visualizations for machine learning datasets

Introduction The facets project contains two visualizations for understanding and analyzing machine learning datasets: Facets Overview and Facets Dive

PAIR code 6.5k Feb 17, 2021