2D maze path solver visualizer implemented with python

Overview

Maze PathFinder Visualizer implemented in Python

How to use

Download:

git clone https://github.com/ss892714028/Maze-PathFinder-Visualization-Python

Install required Libraries

pip install -r requirements.txt

Settings

Go to config.py and change settings.

  • 'w': width of the board
  • 'h': height of the board
  • 'algo':'bfs' for Breadth first search
  • 'algo':'dfs' for Depth first search
  • 'algo':'astar' for A*

Run the visualization

python ./src/drawer.py
  • The first two left clicks on the board initialize start and end node
  • Click or click and drag to create obstacles
  • Press space bar and see the algorithm takes off!

Symbols

  • "@": Start and end node
  • "#": Obstacles
  • "*": Visited node
  • "+": Path

Contributions

All contributions are welcome. :)

Algorithm Implemented

  • BFS (unweighted Dijastra)
  • DFS
  • ASTAR (A*)

Breadth First Search (unweighted Dijkstra)

Breadth First Search is unweighted and guarantee a optimal path. BFS

Depth First Search

Depth First Search is unweighted and does not guarantee a optimal path. DFS

Astar (A*)

A* is weighted and guarantee a optimal path.
A* easy A*

You might also like...
A python visualization of the A* path finding algorithm

A python visualization of the A* path finding algorithm. It allows you to pick your start, end location and make obstacles and then view the process of finding the shortest path. You can also choose to include or exclude diagonal movement.

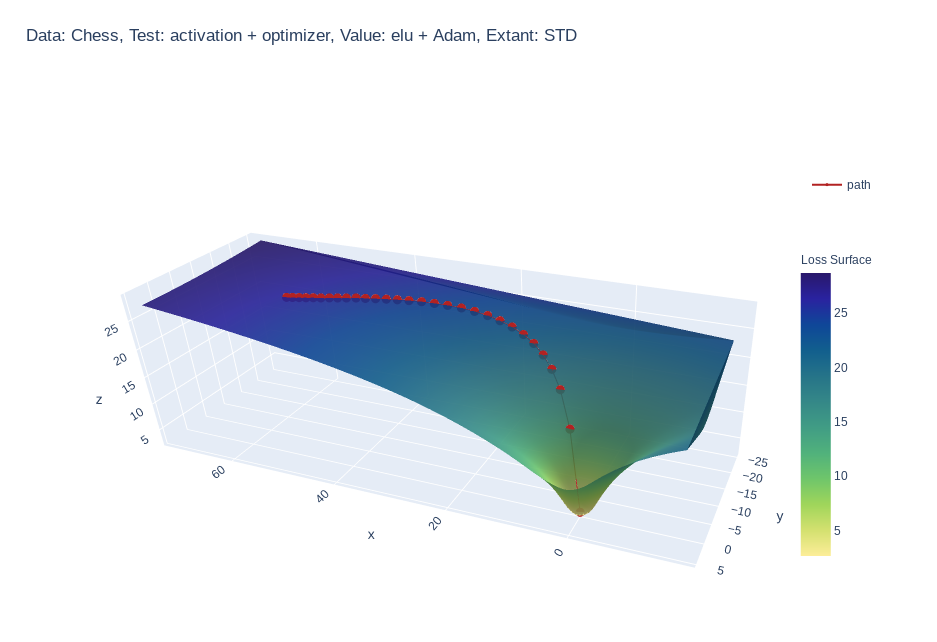
Create 3d loss surface visualizations, with optimizer path. Issues welcome!

MLVTK A loss surface visualization tool Simple feed-forward network trained on chess data, using elu activation and Adam optimizer Simple feed-forward

Fastest Gephi's ForceAtlas2 graph layout algorithm implemented for Python and NetworkX

ForceAtlas2 for Python A port of Gephi's Force Atlas 2 layout algorithm to Python 2 and Python 3 (with a wrapper for NetworkX and igraph). This is the

The visual framework is designed on the idea of module and implemented by mixin method

Visual Framework The visual framework is designed on the idea of module and implemented by mixin method. Its biggest feature is the mixins module whic

Simple plotting for Python. Python wrapper for D3xter - render charts in the browser with simple Python syntax.

PyDexter Simple plotting for Python. Python wrapper for D3xter - render charts in the browser with simple Python syntax. Setup $ pip install PyDexter

Visual Python is a GUI-based Python code generator, developed on the Jupyter Notebook environment as an extension.

Visual Python is a GUI-based Python code generator, developed on the Jupyter Notebook environment as an extension.

A Python Binder that merge 2 files with any extension by creating a new python file and compiling it to exe which runs both payloads.

Update ! ANONFILE MIGHT NOT WORK ! About A Python Binder that merge 2 files with any extension by creating a new python file and compiling it to exe w

Declarative statistical visualization library for Python

Altair http://altair-viz.github.io Altair is a declarative statistical visualization library for Python. With Altair, you can spend more time understa

Interactive Data Visualization in the browser, from  Python
Interactive Data Visualization in the browser, from Python

Bokeh is an interactive visualization library for modern web browsers. It provides elegant, concise construction of versatile graphics, and affords hi

Releases(v0.1)
Owner
SS
SS
Data Visualizer for Super Mario Kart (SNES)

Data Visualizer for Super Mario Kart (SNES)

MrL314 21 Nov 20, 2022
Log visualizer for whirl-framework

Lumberjack Log visualizer for whirl-framework Установка pip install -r requirements.txt Как пользоваться python3 lumberjack.py -l <путь до лога> -o <

Vladimir Malinovskii 2 Dec 19, 2022
This is a sorting visualizer made with Tkinter.

Sorting-Visualizer This is a sorting visualizer made with Tkinter. Make sure you've installed tkinter in your system to use this visualizer pip instal

Vishal Choubey 7 Jul 6, 2022
Alternative layout visualizer for ZSA Moonlander keyboard

General info This is a keyboard layout visualizer for ZSA Moonlander keyboard (because I didn't find their Oryx or their training tool particularly us

null 10 Jul 19, 2022
Decision Border Visualizer for Classification Algorithms

dbv Decision Border Visualizer for Classification Algorithms Project description A python package for Machine Learning Engineers who want to visualize

Sven Eschlbeck 1 Nov 1, 2021
ICS-Visualizer is an interactive Industrial Control Systems (ICS) network graph that contains up-to-date ICS metadata

ICS-Visualizer is an interactive Industrial Control Systems (ICS) network graph that contains up-to-date ICS metadata (Name, company, port, user manua

QeeqBox 2 Dec 13, 2021
ScisorWiz: Differential Isoform Visualizer for Long-Read RNA Sequencing Data

ScisorWiz: Vizualizer for Differential Isoform Expression README ScisorWiz is a linux-based R-package for visualizing differential isoform expression

Alexander Stein 6 Oct 4, 2022
Graphical visualizer for spectralyze by Lauchmelder23

spectralyze visualizer Graphical visualizer for spectralyze by Lauchmelder23 Install Install matplotlib and ffmpeg. Put ffmpeg.exe in same folder as v

Matthew 1 Dec 21, 2021
Time series visualizer is a flexible extension that provides filling world map by country from real data.

Time-series-visualizer Time series visualizer is a flexible extension that provides filling world map by country from csv or json file. You can know d

Long Ng 3 Jul 9, 2021
This project is an Algorithm Visualizer where a user can visualize algorithms like Bubble Sort, Merge Sort, Quick Sort, Selection Sort, Linear Search and Binary Search.

Algo_Visualizer This project is an Algorithm Visualizer where a user can visualize common algorithms like "Bubble Sort", "Merge Sort", "Quick Sort", "

Rahul 4 Feb 7, 2022