Front-end View
Backend View
Table of Contents
Description
This tool takes MRI datasets in the file formats (.dcm, .nii, .nii.gz or .mha) as the input.
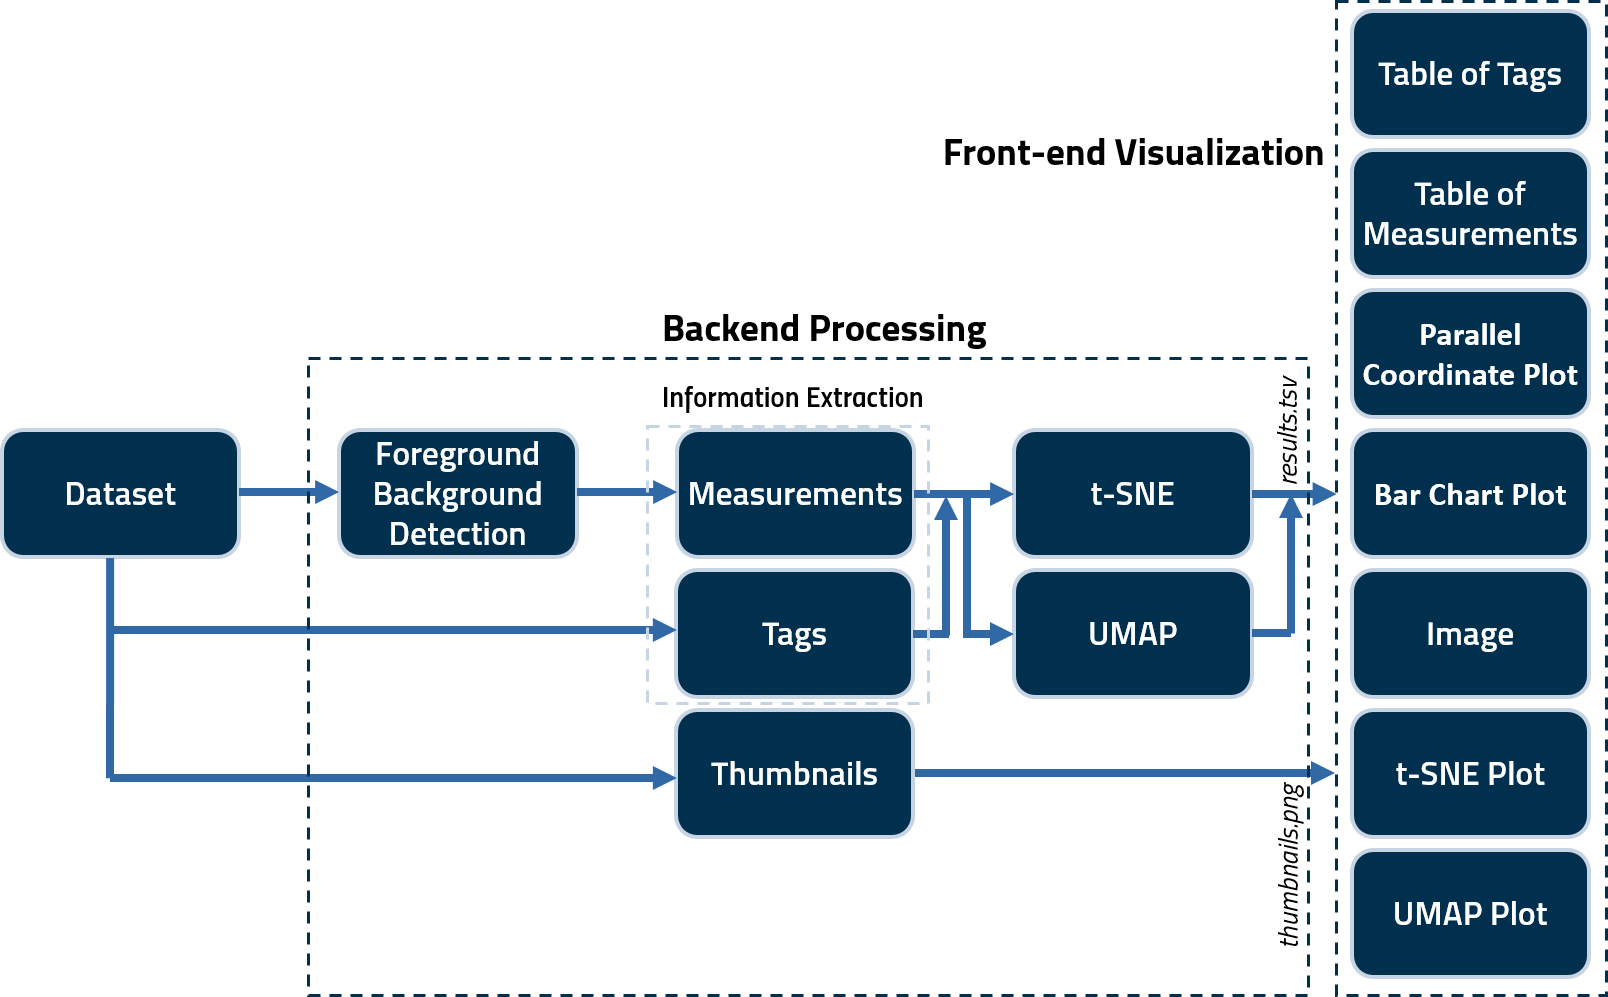
Two Python scripts (QC.py and QCF.py) are used to generate several tags and noise/information measurements for quality assessment. These scripts save the calculated measures in a .tsv file as well as generate .png thumbnails for all images in a subject volume. These are then fed to .js scripts to create the user interface (index.html) output. A schematic illustrating the framework of the tool is as follows.
Prerequisites
The current version of the tool has been tested on the Python 3.6+
You must have pipenv installed on your environment to run MRQy locally. It will pull all the dependencies listed in the diagram.
You can also likely install the python requirements using something like:
pip3 install -r requirements.txt
Running
For local development, test that the code is functional
MRQy % pipenv shell
(mrqy) MRQy% pipenv install .
(mrqy) MRQy% python -m mrqy.QC --help
The output should be
usage: QC.py [-h] output_folder_name [inputdir [inputdir ...]]

positional arguments:
  output_folder_name  the subfolder name on the
                      '...\UserInterface\Data\output_folder_name' directory.
  inputdir            input foldername consists of *.mha (*.nii or *.dcm)
                      files. For example: 'E:\Data\Rectal\input_data_folder'

optional arguments:
  -h, --help          show this help message and exit
Standard usage is to run QC.py output_folder_name “input directory” i.e.
python QC.py output_folder_name "E:\Data\Rectal\RectalCancer_Multisite\input_data_folder"
There is no need to make a subfolder in the Data directory, just specify its name in the command as in the above code.
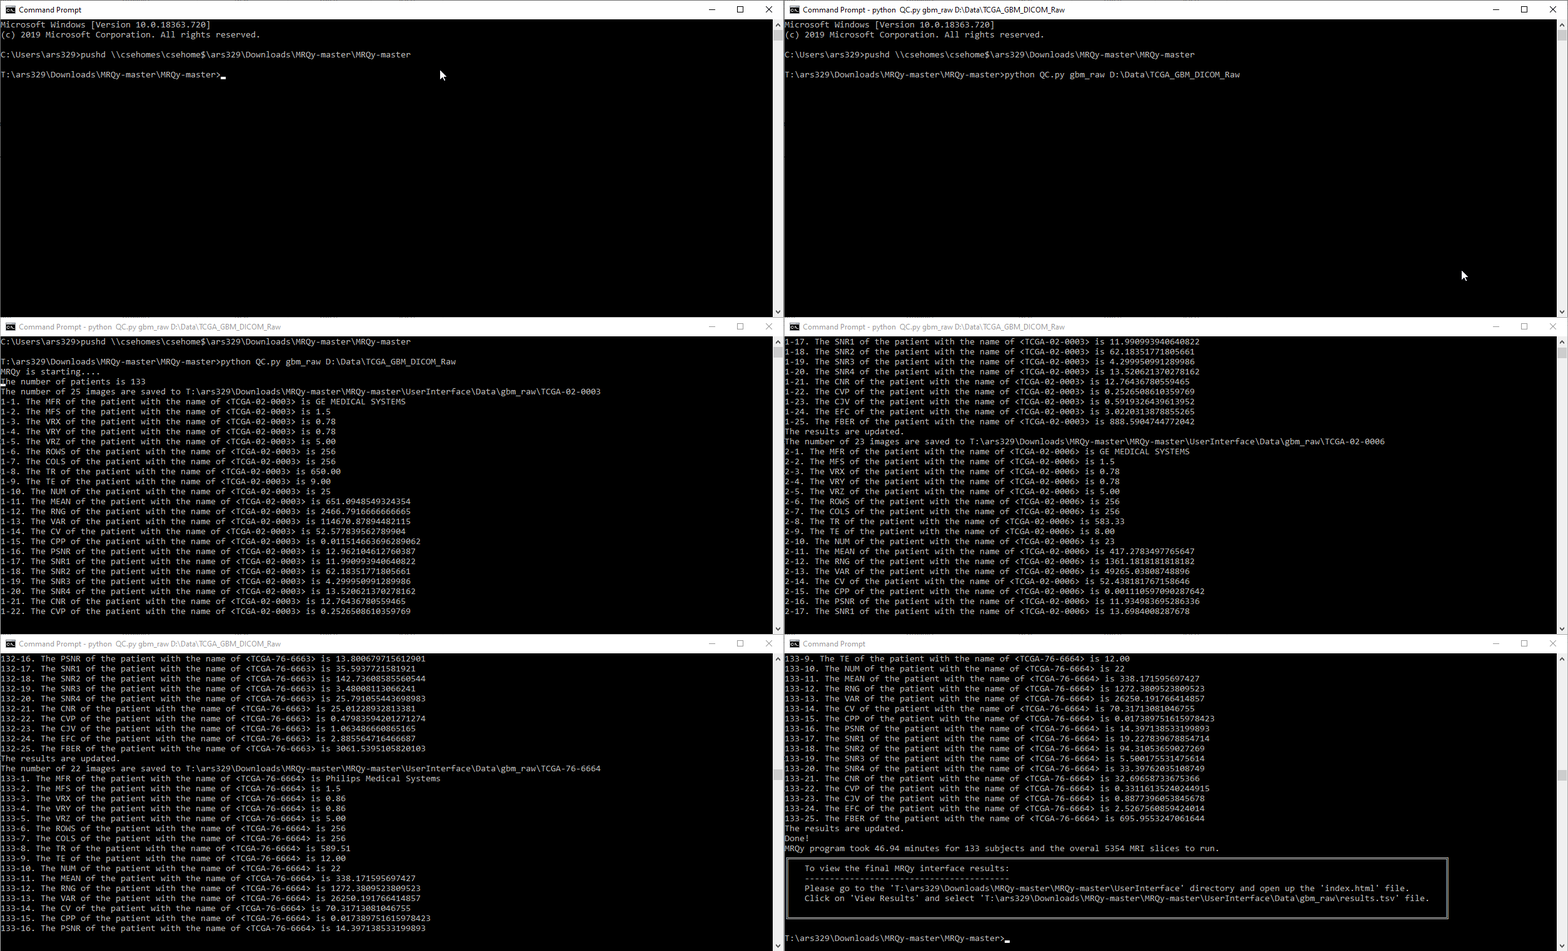
Every action will be printed in the output console.
The thumbnail images in the format of .png will be saved in "...\UserInterface\Data\output_folder_name" with its original filename as the subfolder name. Afterward, double click "index.html" (on e.g. "D:\Downloads\MRQy-master\UserInterface") to open front-end user interface, and select the respective results.tsv file from the correct location e.g. "D:\Downloads\MRQy-master\UserInterface\Data\output_folder_name" directory.
Contribution guidelines
Testing
MRQy % pipenv shell
(mrqy) MRQy% pipenv install .
(mrqy) MRQY% pipenv run -m pytest tests/
Building on Travis
The recommended path is to follow the Forking Workflow. Create a Travis CI build for your github fork to validate your fork before pushing a merge request to master.
Basic Information
Measurements
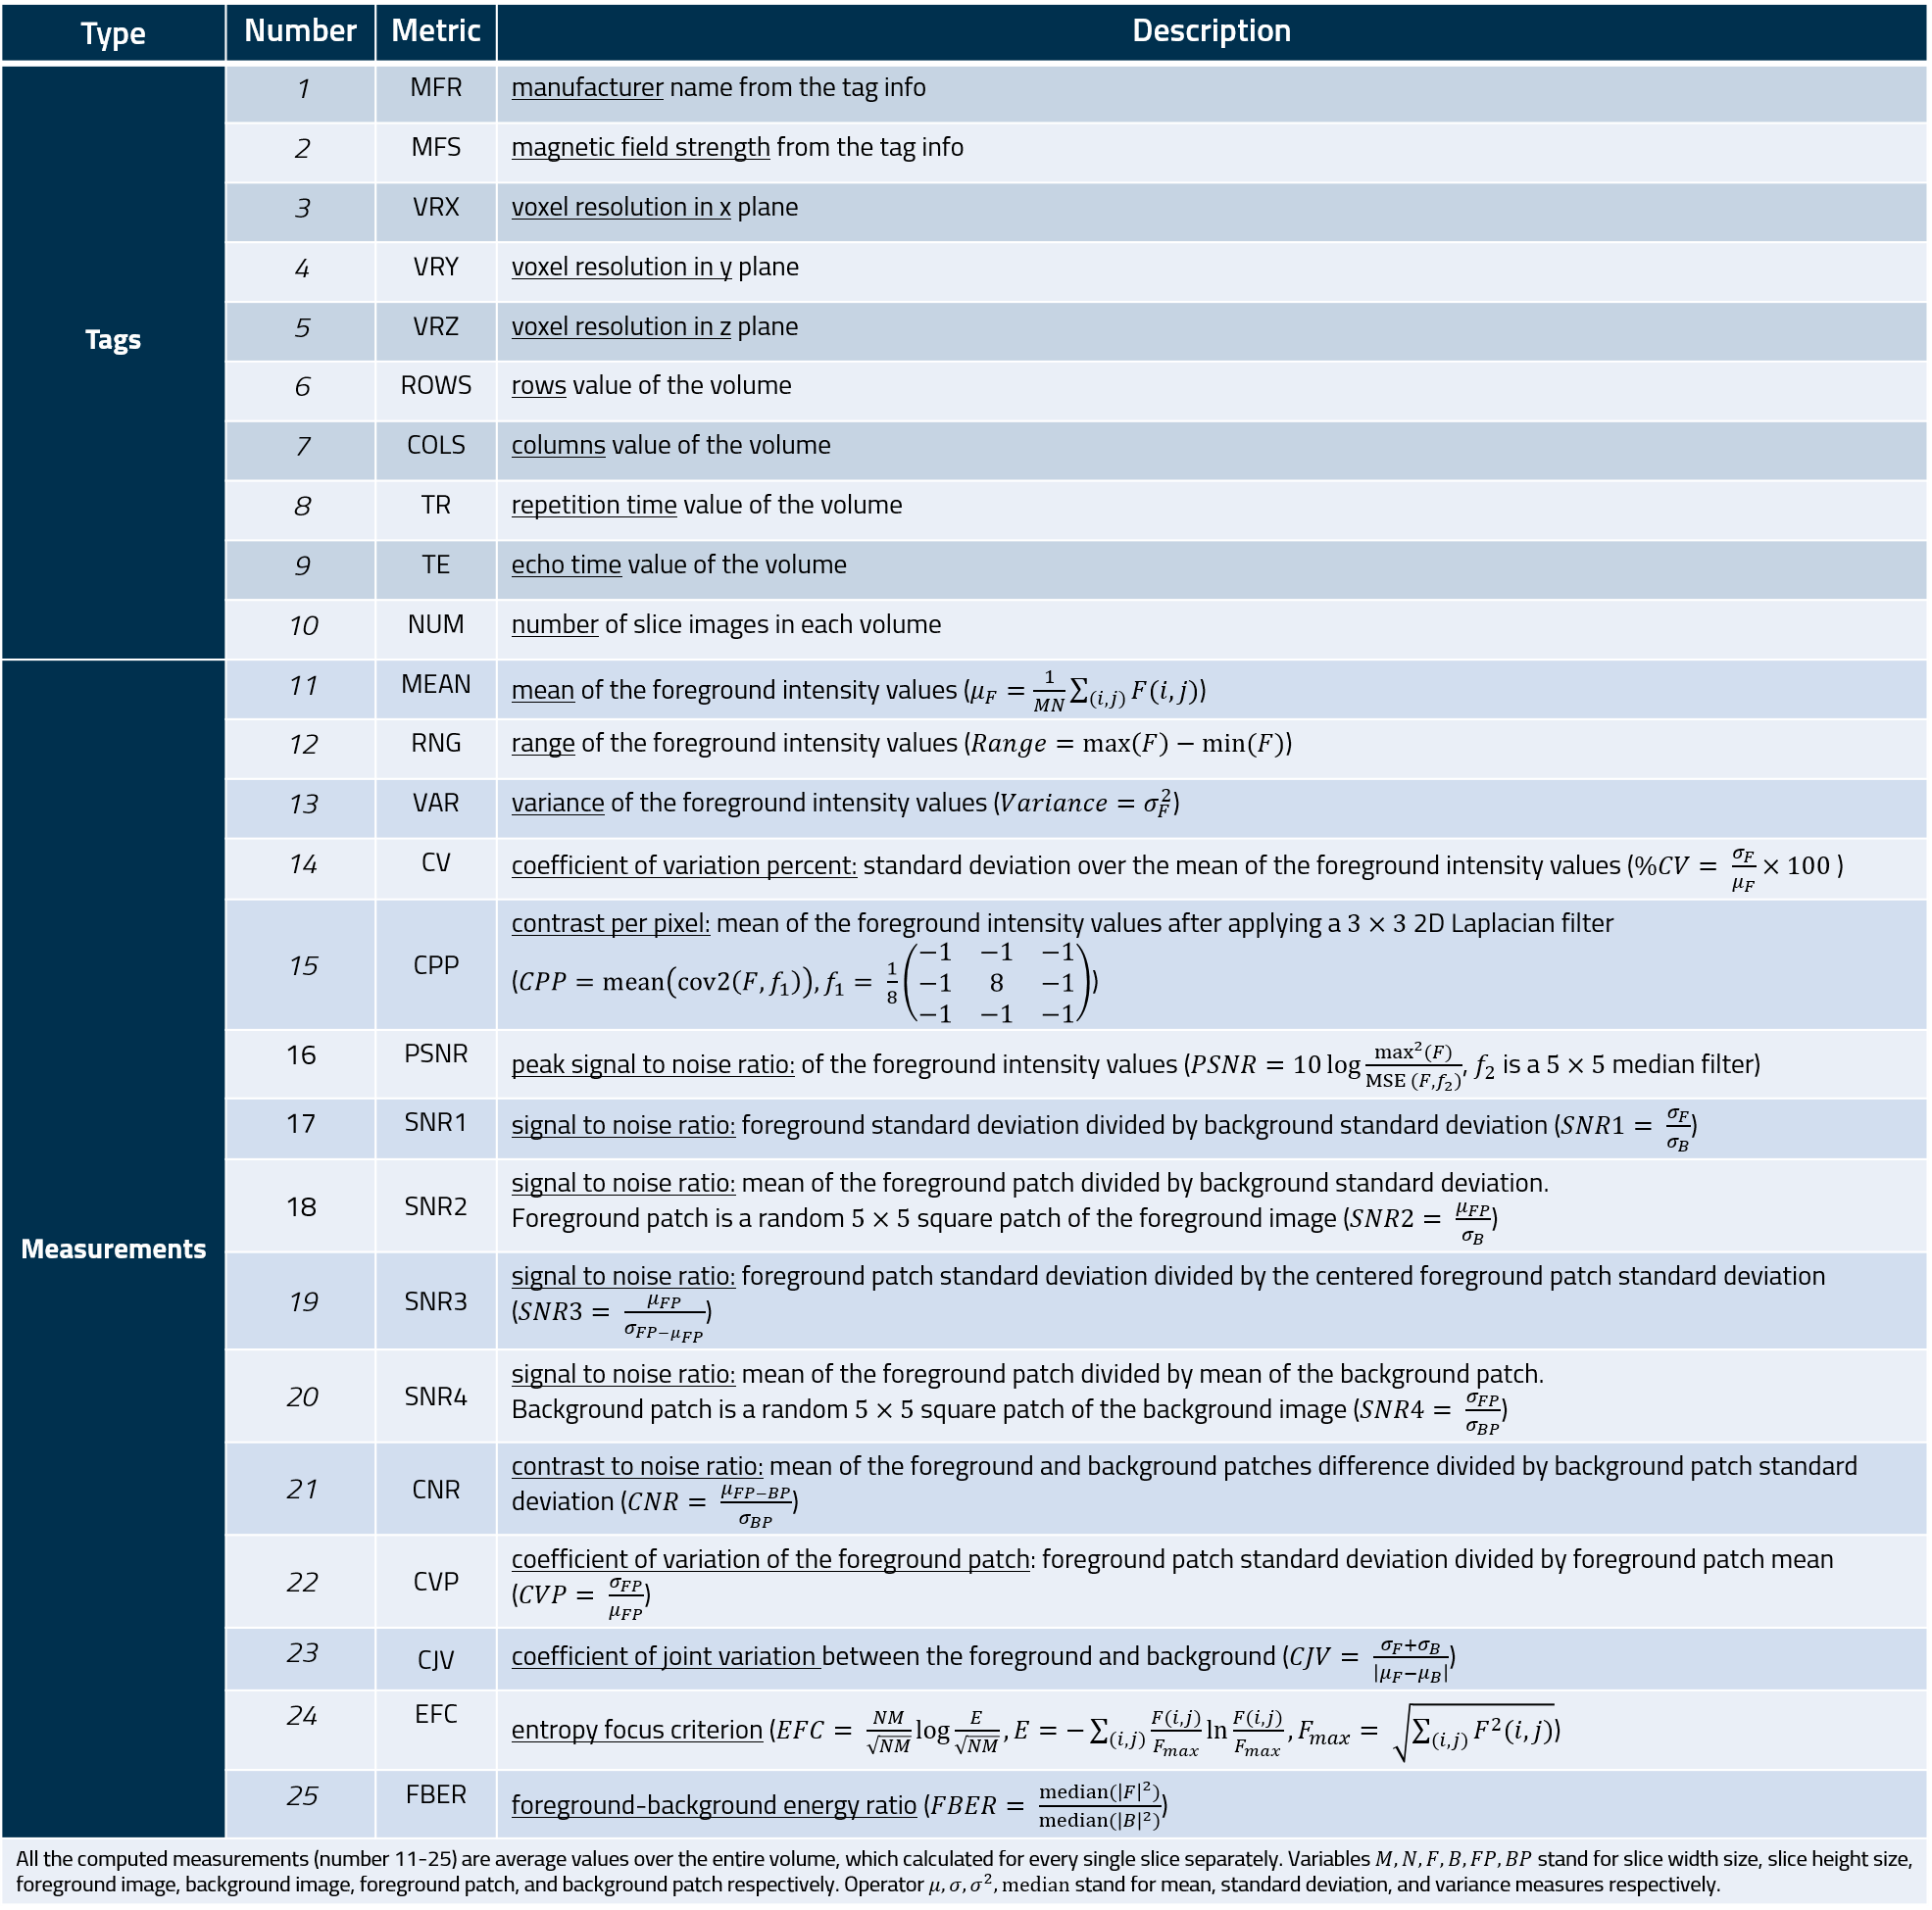
The measures of the MRQy tool are listed in the following table.
User Interface
The following figures show the user interface of the tool (index.html).
Feedback and usage
Please report and issues, bugfixes, ideas for enhancements via the "Issues" tab.
Detailed usage instructions and an example of using MRQy to analyze TCIA datasets are in the Wiki.
You can cite this in any associated publication as:
Sadri, AR, Janowczyk, A, Zou, R, Verma, R, Antunes, J, Madabhushi, A, Tiwari, P, Viswanath, SE, "MRQy: An Open-Source Tool for Quality Control of MR Imaging Data", https://arxiv.org/abs/2004.04871, 2020
If you do use the tool in your own work, please drop us a line to let us know.


