A set of three functions, useful in geographical calculations of different sorts

Overview

GreatCircle

A set of three functions, useful in geographical calculations of different sorts. Available for PHP, Python, Javascript and Ruby.

Live demo of the JavaScript implementation.

Usage with node.js

Install npm module great-circle

npm install great-circle

Usage in node.js or with browserify

var GreatCircle = require('great-circle')

Distance

Takes two sets of geographic coordinates in decimal degrees and produces distance along the great circle line. Output in kilometers by default.

PHP:

// Distance from London to Paris
echo GreatCircle::distance(51.507222, -0.1275, 48.8567, 2.3508);
// Output: 343.46748684413

Python:

print( GreatCircle.distance(51.507222, -0.1275, 48.8567, 2.3508) )

JavaScript:

document.write ( GreatCircle.distance(51.507222, -0.1275, 48.8567, 2.3508) );

Ruby

puts GreatCircle.distance(51.507222, -0.1275, 48.8567, 2.3508)

Optional fifth argument allows to specify desired units:

  • M - meters
  • KM - kilometers
  • MI - miles
  • NM - nautical miles
  • YD - yards
  • FT - feet
// Distance from JFK airport to La Guardia airport in feet
echo GreatCircle::distance(40.63980103, -73.77890015, 40.77719879, -73.87259674, "FT");
// Output: 56425.612628758

The optional argument can also be passed in form of planet radius in any unit, to produce output in this unit.

// Distance between North and South poles on Mars (3389.5 is mean radius of Mars in kilometers)
echo GreatCircle::distance(90, 0, -90, 0, 3389.5);
// Output: 10648.428299343
// Distance between Moscow and New York in furlongs (31670.092 is Earth radius in furlongs)
echo GreatCircle::distance(55.75, 37.616667, 40.7127, -74.0059, 31670.092);
// Output: 37335.295755141

Bearing

Takes two sets of geographic coordinates in decimal degrees and produces bearing (azimuth) from the first set of coordinates to the second set.

// Bearing from Paris to London in decimal degrees
echo GreatCircle::bearing(48.8567, 2.3508, 51.507222, -0.1275);
// Output: 330.03509575101

Destination

Takes one set of geographic coordinates in decimal degrees, azimuth and distance to produce a new set of coordinates, specified distance and bearing away from original.

// Coordinates of a location 100 KM away from Paris, traveling in the direction of London
$dest = GreatCircle::destination(48.8567, 2.3508, 330.035, 100);
printf("Latitude: %f, Longitude: %f", $dest["LAT"], $dest["LON"]);
// Output: Latitude: 49.633753, Longitude: 1.657274

Just like Distance, Destination assumes entered distance is in kilometers, but takes an optional argument to specify desired unit.

// Coordinates of a location 500 nautical miles away from Paris, traveling in the direction of New York
$brg = GreatCircle::bearing(48.8567, 2.3508, 40.7127, -74.0059);
$dest = GreatCircle::destination(48.8567, 2.3508, $brg, 500, "NM");
printf("Latitude: %f, Longitude: %f", $dest["LAT"], $dest["LON"]);
// Output: Latitude: 51.306719, Longitude: -10.071875
You might also like...
Domain Connectivity Analysis Tools to analyze aggregate connectivity patterns across a set of domains during security investigations

DomainCAT (Domain Connectivity Analysis Tool) Domain Connectivity Analysis Tool is used to analyze aggregate connectivity patterns across a set of dom

Set of matplotlib operations that are not trivial

Matplotlib Snippets This repository contains a set of matplotlib operations that are not trivial. Histograms Histogram with bins adapted to log scale

Realtime Viewer Mandelbrot set with Python and Taichi (cpu, opengl, cuda, vulkan, metal)

Mandelbrot-set-Realtime-Viewer- Realtime Viewer Mandelbrot set with Python and Taichi (cpu, opengl, cuda, vulkan, metal) Control: "WASD" - movement, "

A small script written in Python3 that generates a visual representation of the Mandelbrot set.

Mandelbrot Set Generator A small script written in Python3 that generates a visual representation of the Mandelbrot set. Abstract The colors in the ou

Data aggregated from the reports found at the MCPS COVID Dashboard into a set of visualizations.

Montgomery County Public Schools COVID-19 Visualizer Contents About this project Data Support this project About this project Data All data we use can

Here, I have discuss the three methods of list reversion. The three methods are built-in method, slicing method and position changing method.

Three-different-method-for-list-reversion Here, I have discuss the three methods of list reversion. The three methods are built-in method, slicing met

Customisable pharmacokinetic model accessible via bash CLI allowing for variable dose calculations as well as intravenous and subcutaneous administration calculations

Pharmacokinetic Modelling Group Project A PharmacoKinetic (PK) modelling function for analysis of injected solute dynamics over time, developed by Gro

Simple, concise geographical visualization in Python

Geographic visualizations for HoloViews. Build Status Coverage Latest dev release Latest release Docs What is it? GeoViews is a Python library that ma

python toolbox for visualizing geographical data and making maps

geoplotlib is a python toolbox for visualizing geographical data and making maps data = read_csv('data/bus.csv') geoplotlib.dot(data) geoplotlib.show(

BasstatPL is a package for performing different tabulations and calculations for descriptive statistics.

BasstatPL is a package for performing different tabulations and calculations for descriptive statistics. It provides: Frequency table constr

A small utility that sorts your files.

FileSorter A small utility that sorts your files. TODO: Scan directory to find files(thanks @corruptmemry for this!) Split extensions to determine fil

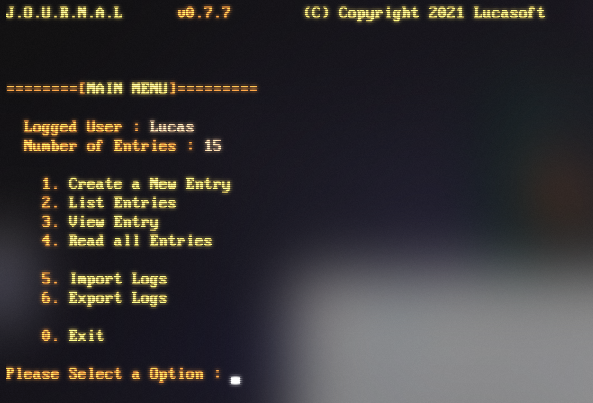
Python program that handles the creation, encryption and storage of log/journal files. Kinda works like a diary of sorts.

LucaSoft J.O.U.R.N.A.L The J.O.U.R.N.A.L (Just anOther User Redaction & Navigation Assistant by Lucaspec72) is a Python program that handles the creat

An application that on a given url, crowls a web page and gets all words,  sorts and counts them.
An application that on a given url, crowls a web page and gets all words, sorts and counts them.

Web-Scrapping-1 An application that on a given url, crowls a web page and gets all words, sorts and counts them. Installation Using the package manage

IMGUR5K handwriting set. It is a handwritten in-the-wild dataset, which contains challenging real world handwritten samples from different writers.The dataset is shared as a set of image urls with annotations. This code downloads the images and verifies the hash to the image to avoid data contamination.
Automatically download the cwru data set, and then divide it into training data set and test data set

Automatically download the cwru data set, and then divide it into training data set and test data set.自动下载cwru数据集,然后分训练数据集和测试数据集

Voxel Set Transformer: A Set-to-Set Approach to 3D Object Detection from Point Clouds (CVPR 2022)

Voxel Set Transformer: A Set-to-Set Approach to 3D Object Detection from Point Clouds (CVPR2022)[paper] Authors: Chenhang He, Ruihuang Li, Shuai Li, L

It is a useful project for developers that includes useful tools for Instagram

InstagramIG It is a useful project for developers that includes useful tools for Instagram Installation : pip install InstagramIG Logan Usage from In

Comments
  • question about bearing

    question about bearing

    Is the bearing the compass bearing at point A to begin the great circle/geodesic route to point B?

    Is there an easy way to get compass bearings as a function of distance traveled from point A? (i.e. along the entire route, from the outset?)

    Obviously any nav-guidance system could just recalculate bearing at each location as it transits the great circle, but I'm curious if your tool can provide this info at the outset.

    Thanks!

    opened by zbeekman 1
Owner
null
Bar Chart of the number of Senators from each party who are up for election in the next three General Elections

Congress-Analysis Bar Chart of the number of Senators from each party who are up for election in the next three General Elections This bar chart shows

null 11 Oct 26, 2021
Some useful extensions for Matplotlib.

mplx Some useful extensions for Matplotlib. Contour plots for functions with discontinuities plt.contour mplx.contour(max_jump=1.0) Matplotlib has pro

Nico Schlömer 519 Dec 30, 2022
A small collection of tools made by me, that you can use to visualize atomic orbitals in both 2D and 3D in different aspects.

Orbitals in Python A small collection of tools made by me, that you can use to visualize atomic orbitals in both 2D and 3D in different aspects, and o

Prakrisht Dahiya 1 Nov 25, 2021
Data-FX is an addon for Blender (2.9) that allows for the visualization of data with different charts

Data-FX Data-FX is an addon for Blender (2.9) that allows for the visualization of data with different charts Currently, there are only 2 chart option

Landon Ferguson 20 Nov 21, 2022
Visualizations of some specific solutions of different differential equations.

Diff_sims Visualizations of some specific solutions of different differential equations. Heat Equation in 1 Dimension (A very beautiful and elegant ex

null 2 Jan 13, 2022
Define fortify and autoplot functions to allow ggplot2 to handle some popular R packages.

ggfortify This package offers fortify and autoplot functions to allow automatic ggplot2 to visualize statistical result of popular R packages. Check o

Sinhrks 504 Dec 23, 2022
A Python library created to assist programmers with complex mathematical functions

libmaths was created not only as a learning experience for me, but as a way to make mathematical models in seconds for Python users using mat

Simple 73 Oct 2, 2022
3D Vision functions with end-to-end support for deep learning developers, written in Ivy.

Ivy vision focuses predominantly on 3D vision, with functions for camera geometry, image projections, co-ordinate frame transformations, forward warping, inverse warping, optical flow, depth triangulation, voxel grids, point clouds, signed distance functions, and others. Check out the docs for more info!

Ivy 61 Dec 29, 2022
Functions for easily making publication-quality figures with matplotlib.

Data-viz utils ?? Functions for data visualization in matplotlib ?? API Can be installed using pip install dvu and then imported with import dvu. You

Chandan Singh 16 Sep 15, 2022
Function Plotter: a simple application with GUI to plot mathematical functions

Function-Plotter Function Plotter is a simple application with GUI to plot mathe

Mohamed Nabawe 4 Jan 3, 2022