Investigating EV charging data

Overview

Investigating EV charging data

Introduction:

Got an opportunity to work with a home monitoring technology company over the last 6 months whose goal was to help people understand their household energy consumption, know what is going on in their homes, and ultimately reduce their energy footprint.

With the company business goal in mind formulated the following Problem statement:- Help equip customers with insights about their EVs energy consumption and help predict future charging behavior.

Dataset provided consisted of 1200 Households across the USA with one or more EVs of various brands at each Household. For each EV hourly energy consumption was provided. The dataset lacked consistency and was not uniformly populated for each EV during the time range. Some EVs had data for 6 months, while some EVs had data for just 3-4 hours.

The inconsistency started by deep diving into the dataset with two EDAs to understand the dataset better and explore factors that could be impacting the energy consumption of an individual car.

Some interesting insights from the EDA performed:

EDA Part 1: https://public.flourish.studio/story/1113717/

EDA Part 2: https://public.flourish.studio/story/1113715/

Please refer to EV Consumption PDF attached to see the EDA summary and Modeling Approach.

Equipped customers with insights about their EVs Hourly energy consumption and helped predict future charging behavior. Created energy consumption-wise clusters and LSTM model for future consumption insights. Designed sample dashboard views with insights and recommendations for customers.
You might also like...
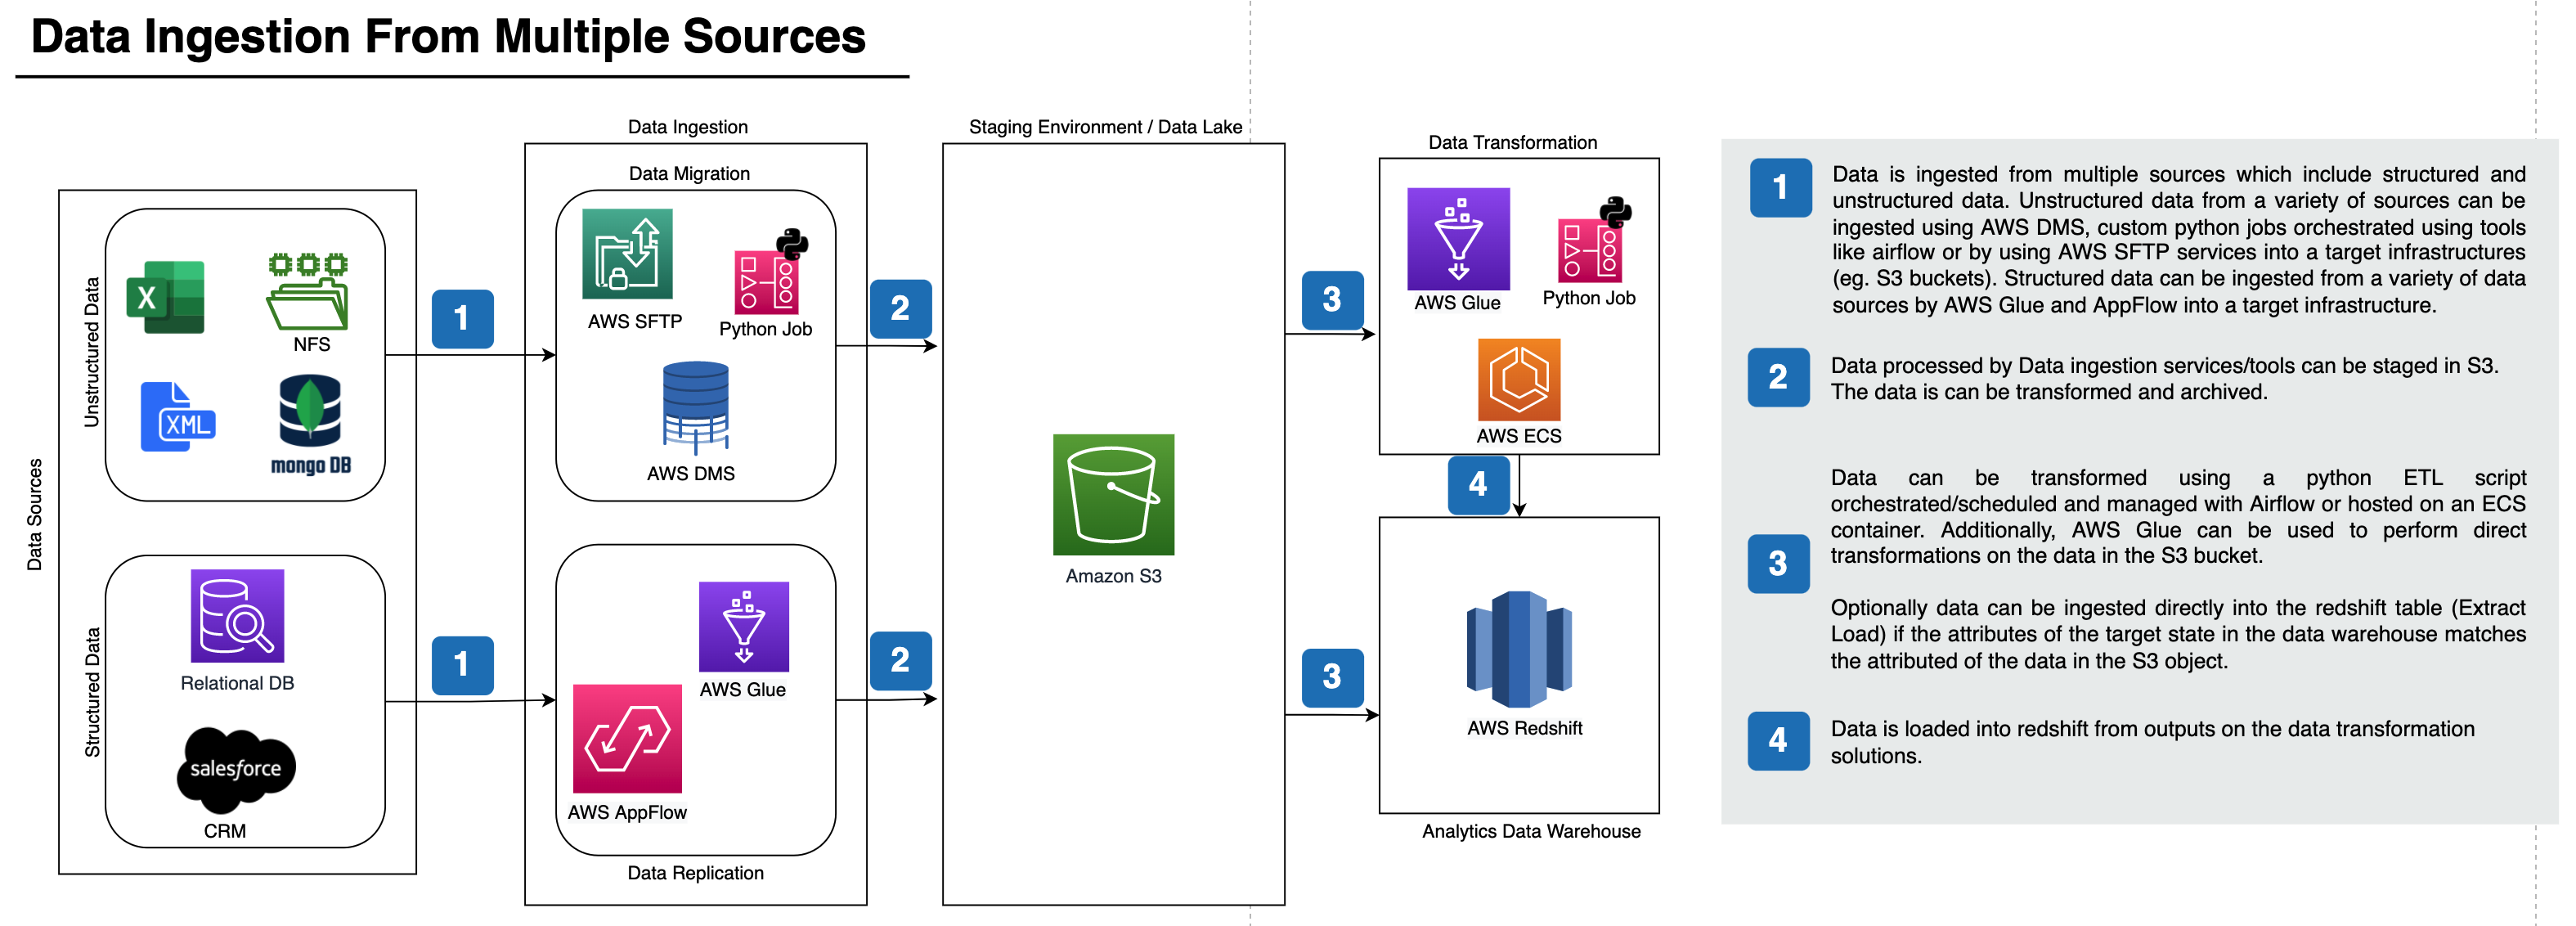
PrimaryBid - Transform application Lifecycle Data and Design and ETL pipeline architecture for ingesting data from multiple sources to redshift

Transform application Lifecycle Data and Design and ETL pipeline architecture for ingesting data from multiple sources to redshift This project is composed of two parts: Part1 and Part2

Demonstrate the breadth and depth of your data science skills by earning all of the Databricks Data Scientist credentials

Data Scientist Learning Plan Demonstrate the breadth and depth of your data science skills by earning all of the Databricks Data Scientist credentials

PostQF is a user-friendly Postfix queue data filter which operates on data produced by postqueue -j.

PostQF Copyright © 2022 Ralph Seichter PostQF is a user-friendly Postfix queue data filter which operates on data produced by postqueue -j. See the ma

Catalogue data - A Python Scripts to prepare catalogue data

catalogue_data Scripts to prepare catalogue data. Setup Clone this repo. Install

NumPy and Pandas interface to Big Data

Blaze translates a subset of modified NumPy and Pandas-like syntax to databases and other computing systems. Blaze allows Python users a familiar inte

:truck: Agile Data Preparation Workflows made easy with dask, cudf, dask_cudf and pyspark

To launch a live notebook server to test optimus using binder or Colab, click on one of the following badges: Optimus is the missing framework to prof

Find exposed data in Azure with this public blob scanner

BlobHunter A tool for scanning Azure blob storage accounts for publicly opened blobs. BlobHunter is a part of "Hunting Azure Blobs Exposes Millions of

Aggregating gridded data (xarray) to polygons

A package to aggregate gridded data in xarray to polygons in geopandas using area-weighting from the relative area overlaps between pixels and polygons. Check out the binder link above for a sample code run!

ForecastGA is a Python tool to forecast Google Analytics data using several popular time series models.

ForecastGA is a tool that combines a couple of popular libraries, Atspy and googleanalytics, with a few enhancements.

Owner
Yash
Exploring one day at a time!
Yash
🧪 Panel-Chemistry - exploratory data analysis and build powerful data and viz tools within the domain of Chemistry using Python and HoloViz Panel.

???? ??. The purpose of the panel-chemistry project is to make it really easy for you to do DATA ANALYSIS and build powerful DATA AND VIZ APPLICATIONS within the domain of Chemistry using using Python and HoloViz Panel.

Marc Skov Madsen 97 Dec 8, 2022
fds is a tool for Data Scientists made by DAGsHub to version control data and code at once.

Fast Data Science, AKA fds, is a CLI for Data Scientists to version control data and code at once, by conveniently wrapping git and dvc

DAGsHub 359 Dec 22, 2022
Tuplex is a parallel big data processing framework that runs data science pipelines written in Python at the speed of compiled code

Tuplex is a parallel big data processing framework that runs data science pipelines written in Python at the speed of compiled code. Tuplex has similar Python APIs to Apache Spark or Dask, but rather than invoking the Python interpreter, Tuplex generates optimized LLVM bytecode for the given pipeline and input data set.

Tuplex 791 Jan 4, 2023
A data parser for the internal syncing data format used by Fog of World.

A data parser for the internal syncing data format used by Fog of World. The parser is not designed to be a well-coded library with good performance, it is more like a demo for showing the data structure.

Zed(Zijun) Chen 40 Dec 12, 2022
Fancy data functions that will make your life as a data scientist easier.

WhiteBox Utilities Toolkit: Tools to make your life easier Fancy data functions that will make your life as a data scientist easier. Installing To ins

WhiteBox 3 Oct 3, 2022
A Big Data ETL project in PySpark on the historical NYC Taxi Rides data

Processing NYC Taxi Data using PySpark ETL pipeline Description This is an project to extract, transform, and load large amount of data from NYC Taxi

Unnikrishnan 2 Dec 12, 2021
Created covid data pipeline using PySpark and MySQL that collected data stream from API and do some processing and store it into MYSQL database.

Created covid data pipeline using PySpark and MySQL that collected data stream from API and do some processing and store it into MYSQL database.

null 2 Nov 20, 2021
Utilize data analytics skills to solve real-world business problems using Humana’s big data

Humana-Mays-2021-HealthCare-Analytics-Case-Competition- The goal of the project is to utilize data analytics skills to solve real-world business probl

Yongxian (Caroline) Lun 1 Dec 27, 2021
Python data processing, analysis, visualization, and data operations

Python This is a Python data processing, analysis, visualization and data operations of the source code warehouse, book ISBN: 9787115527592 Descriptio

FangWei 1 Jan 16, 2022