A game theoretic approach to explain the output of any machine learning model.

Overview


Binder Documentation Status

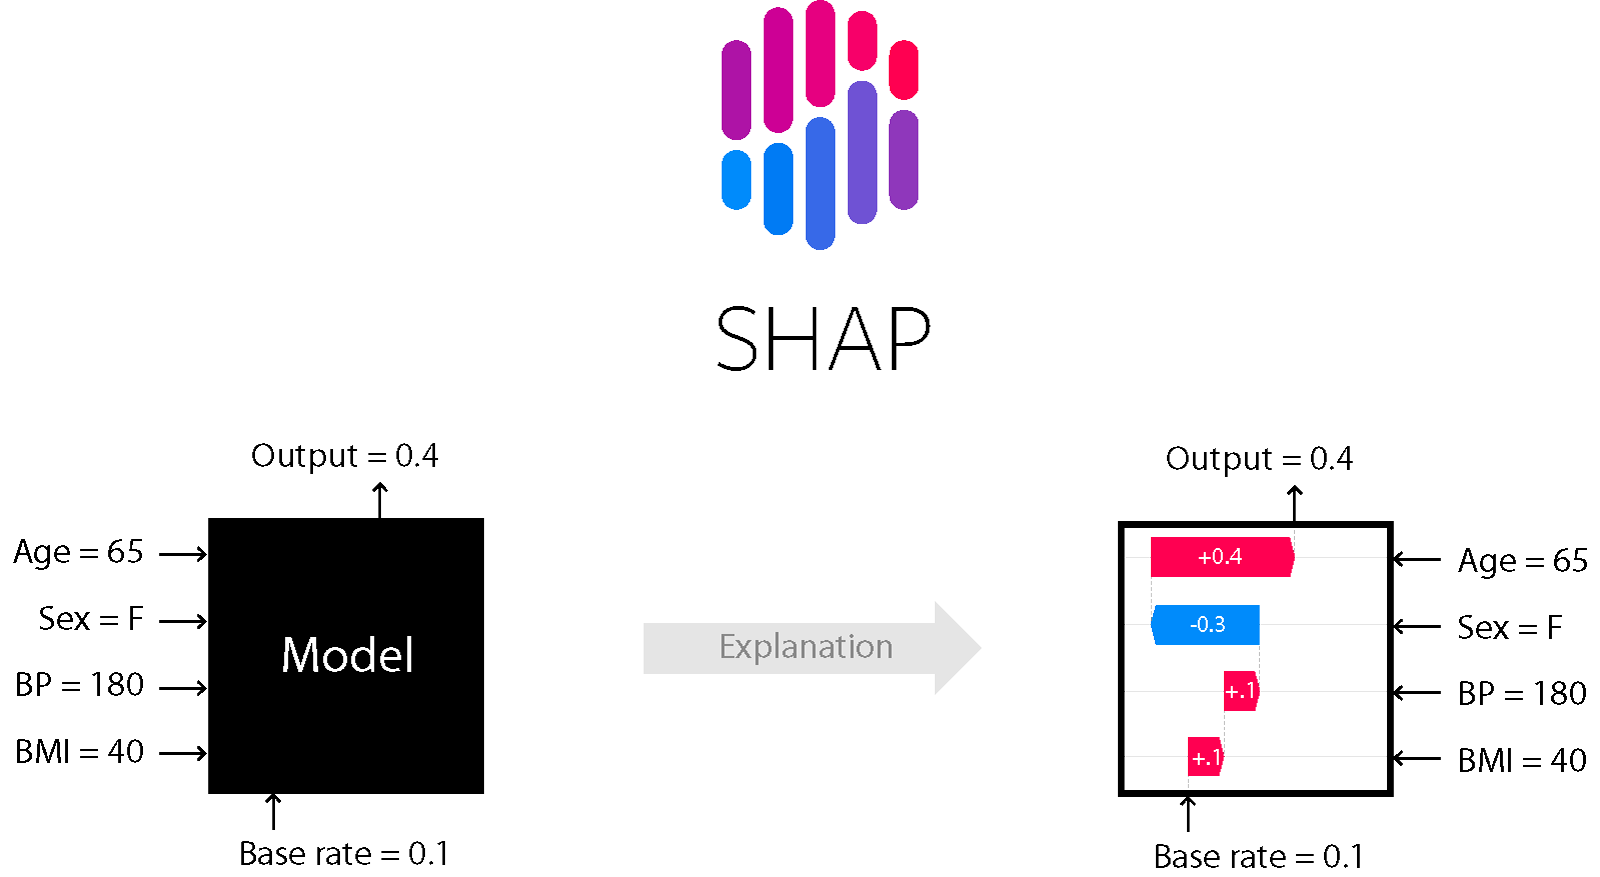
SHAP (SHapley Additive exPlanations) is a game theoretic approach to explain the output of any machine learning model. It connects optimal credit allocation with local explanations using the classic Shapley values from game theory and their related extensions (see papers for details and citations).

Install

SHAP can be installed from either PyPI or conda-forge:

pip install shap
or
conda install -c conda-forge shap

Tree ensemble example (XGBoost/LightGBM/CatBoost/scikit-learn/pyspark models)

While SHAP can explain the output of any machine learning model, we have developed a high-speed exact algorithm for tree ensemble methods (see our Nature MI paper). Fast C++ implementations are supported for XGBoost, LightGBM, CatBoost, scikit-learn and pyspark tree models:

import xgboost
import shap

# train an XGBoost model
X, y = shap.datasets.boston()
model = xgboost.XGBRegressor().fit(X, y)

# explain the model's predictions using SHAP
# (same syntax works for LightGBM, CatBoost, scikit-learn, transformers, Spark, etc.)
explainer = shap.Explainer(model)
shap_values = explainer(X)

# visualize the first prediction's explanation
shap.plots.waterfall(shap_values[0])

The above explanation shows features each contributing to push the model output from the base value (the average model output over the training dataset we passed) to the model output. Features pushing the prediction higher are shown in red, those pushing the prediction lower are in blue. Another way to visualize the same explanation is to use a force plot (these are introduced in our Nature BME paper):

# visualize the first prediction's explanation with a force plot
shap.plots.force(shap_values[0])

If we take many force plot explanations such as the one shown above, rotate them 90 degrees, and then stack them horizontally, we can see explanations for an entire dataset (in the notebook this plot is interactive):

# visualize all the training set predictions
shap.plots.force(shap_values)

To understand how a single feature effects the output of the model we can plot the SHAP value of that feature vs. the value of the feature for all the examples in a dataset. Since SHAP values represent a feature's responsibility for a change in the model output, the plot below represents the change in predicted house price as RM (the average number of rooms per house in an area) changes. Vertical dispersion at a single value of RM represents interaction effects with other features. To help reveal these interactions we can color by another feature. If we pass the whole explanation tensor to the color argument the scatter plot will pick the best feature to color by. In this case it picks RAD (index of accessibility to radial highways) since that highlights that the average number of rooms per house has less impact on home price for areas with a high RAD value.

# create a dependence scatter plot to show the effect of a single feature across the whole dataset
shap.plots.scatter(shap_values[:,"RM"], color=shap_values)

To get an overview of which features are most important for a model we can plot the SHAP values of every feature for every sample. The plot below sorts features by the sum of SHAP value magnitudes over all samples, and uses SHAP values to show the distribution of the impacts each feature has on the model output. The color represents the feature value (red high, blue low). This reveals for example that a high LSTAT (% lower status of the population) lowers the predicted home price.

# summarize the effects of all the features
shap.plots.beeswarm(shap_values)

We can also just take the mean absolute value of the SHAP values for each feature to get a standard bar plot (produces stacked bars for multi-class outputs):

shap.plots.bar(shap_values)

Natural language example (transformers)

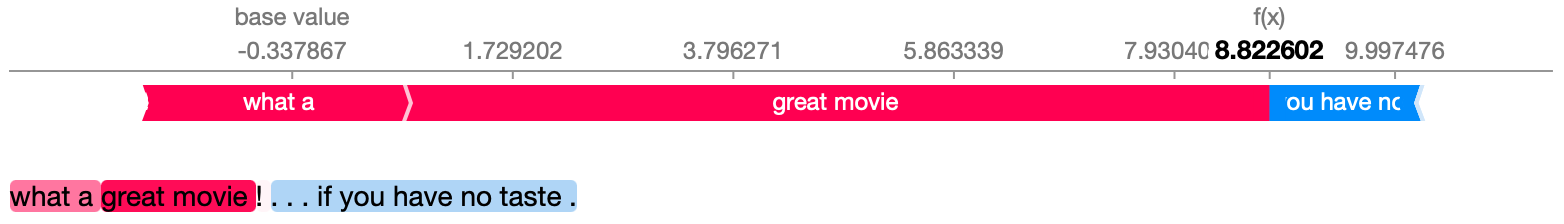
SHAP has specific support for natural language models like those in the Hugging Face transformers library. By adding coalitional rules to traditional Shapley values we can form games that explain large modern NLP model using very few function evaluations. Using this functionality is as simple as passing a supported transformers pipeline to SHAP:

import transformers
import shap

# load a transformers pipeline model
model = transformers.pipeline('sentiment-analysis', return_all_scores=True)

# explain the model on two sample inputs
explainer = shap.Explainer(model) 
shap_values = explainer(["What a great movie! ...if you have no taste."])

# visualize the first prediction's explanation for the POSITIVE output class
shap.plots.text(shap_values[0, :, "POSITIVE"])

Deep learning example with DeepExplainer (TensorFlow/Keras models)

Deep SHAP is a high-speed approximation algorithm for SHAP values in deep learning models that builds on a connection with DeepLIFT described in the SHAP NIPS paper. The implementation here differs from the original DeepLIFT by using a distribution of background samples instead of a single reference value, and using Shapley equations to linearize components such as max, softmax, products, divisions, etc. Note that some of these enhancements have also been since integrated into DeepLIFT. TensorFlow models and Keras models using the TensorFlow backend are supported (there is also preliminary support for PyTorch):

# ...include code from https://github.com/keras-team/keras/blob/master/examples/mnist_cnn.py

import shap
import numpy as np

# select a set of background examples to take an expectation over
background = x_train[np.random.choice(x_train.shape[0], 100, replace=False)]

# explain predictions of the model on four images
e = shap.DeepExplainer(model, background)
# ...or pass tensors directly
# e = shap.DeepExplainer((model.layers[0].input, model.layers[-1].output), background)
shap_values = e.shap_values(x_test[1:5])

# plot the feature attributions
shap.image_plot(shap_values, -x_test[1:5])

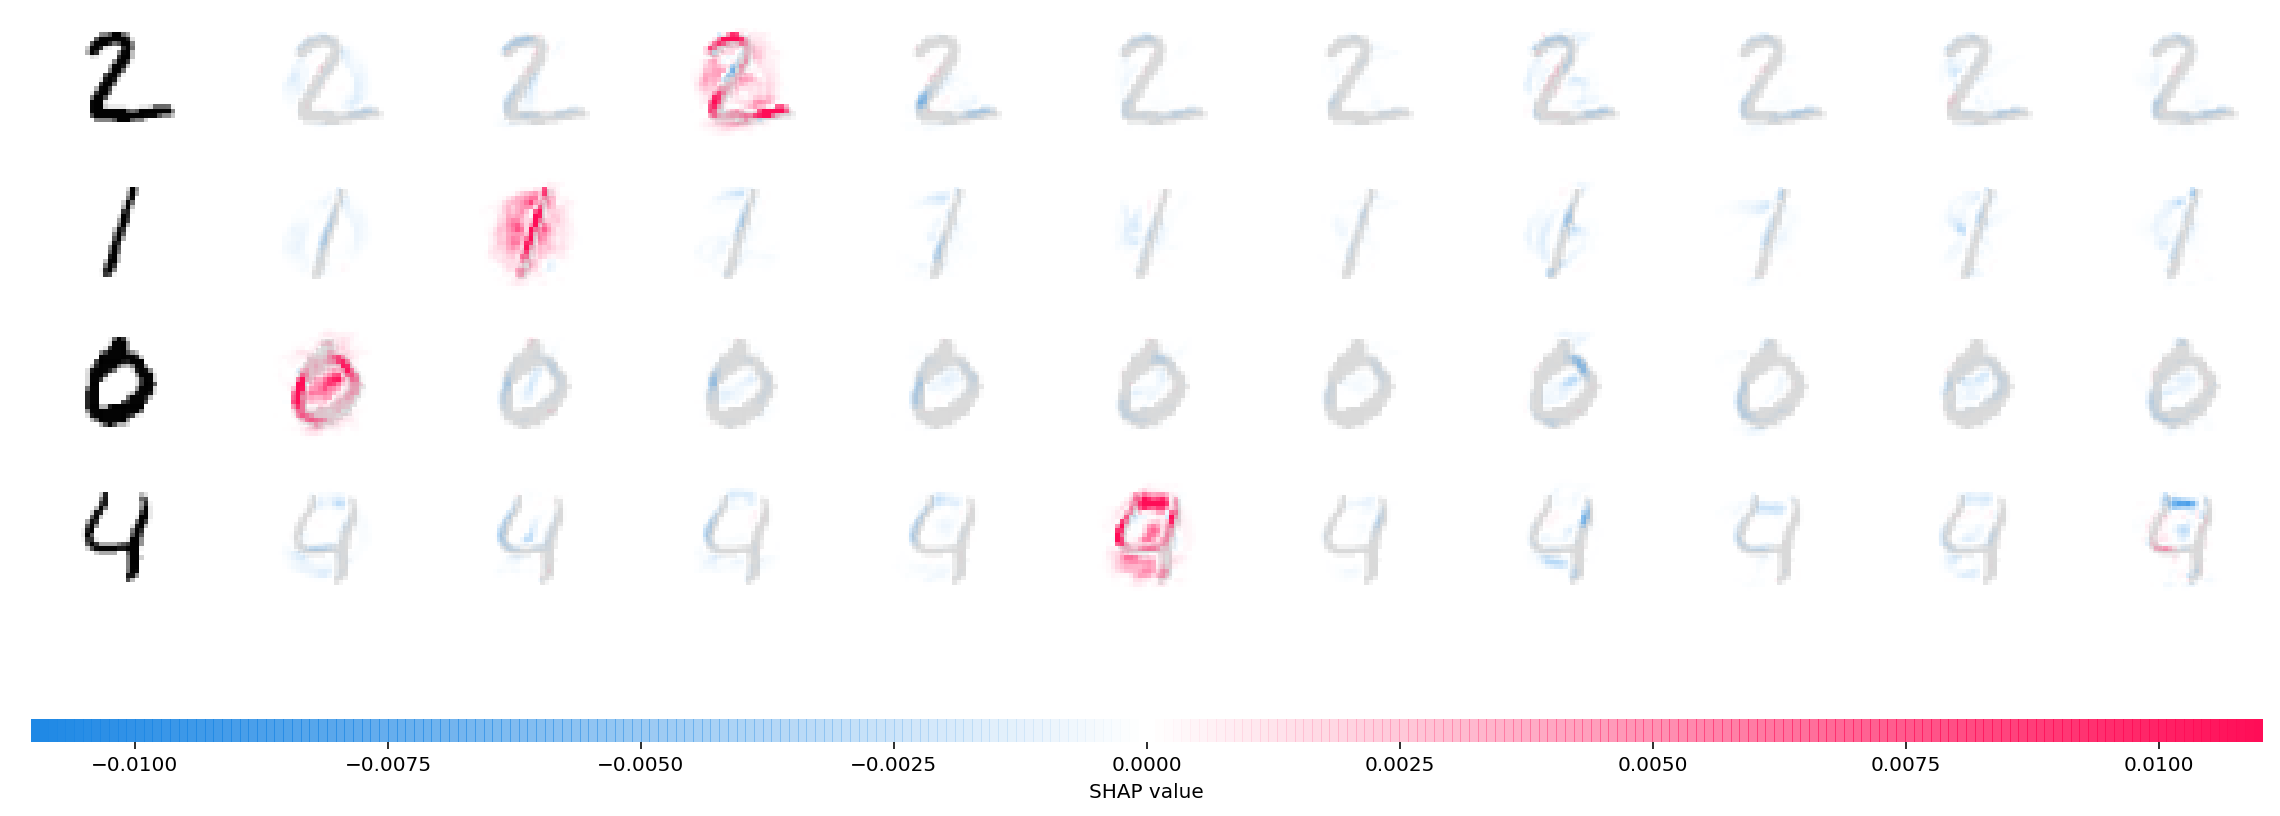
The plot above explains ten outputs (digits 0-9) for four different images. Red pixels increase the model's output while blue pixels decrease the output. The input images are shown on the left, and as nearly transparent grayscale backings behind each of the explanations. The sum of the SHAP values equals the difference between the expected model output (averaged over the background dataset) and the current model output. Note that for the 'zero' image the blank middle is important, while for the 'four' image the lack of a connection on top makes it a four instead of a nine.

Deep learning example with GradientExplainer (TensorFlow/Keras/PyTorch models)

Expected gradients combines ideas from Integrated Gradients, SHAP, and SmoothGrad into a single expected value equation. This allows an entire dataset to be used as the background distribution (as opposed to a single reference value) and allows local smoothing. If we approximate the model with a linear function between each background data sample and the current input to be explained, and we assume the input features are independent then expected gradients will compute approximate SHAP values. In the example below we have explained how the 7th intermediate layer of the VGG16 ImageNet model impacts the output probabilities.

from keras.applications.vgg16 import VGG16
from keras.applications.vgg16 import preprocess_input
import keras.backend as K
import numpy as np
import json
import shap

# load pre-trained model and choose two images to explain
model = VGG16(weights='imagenet', include_top=True)
X,y = shap.datasets.imagenet50()
to_explain = X[[39,41]]

# load the ImageNet class names
url = "https://s3.amazonaws.com/deep-learning-models/image-models/imagenet_class_index.json"
fname = shap.datasets.cache(url)
with open(fname) as f:
    class_names = json.load(f)

# explain how the input to the 7th layer of the model explains the top two classes
def map2layer(x, layer):
    feed_dict = dict(zip([model.layers[0].input], [preprocess_input(x.copy())]))
    return K.get_session().run(model.layers[layer].input, feed_dict)
e = shap.GradientExplainer(
    (model.layers[7].input, model.layers[-1].output),
    map2layer(X, 7),
    local_smoothing=0 # std dev of smoothing noise
)
shap_values,indexes = e.shap_values(map2layer(to_explain, 7), ranked_outputs=2)

# get the names for the classes
index_names = np.vectorize(lambda x: class_names[str(x)][1])(indexes)

# plot the explanations
shap.image_plot(shap_values, to_explain, index_names)

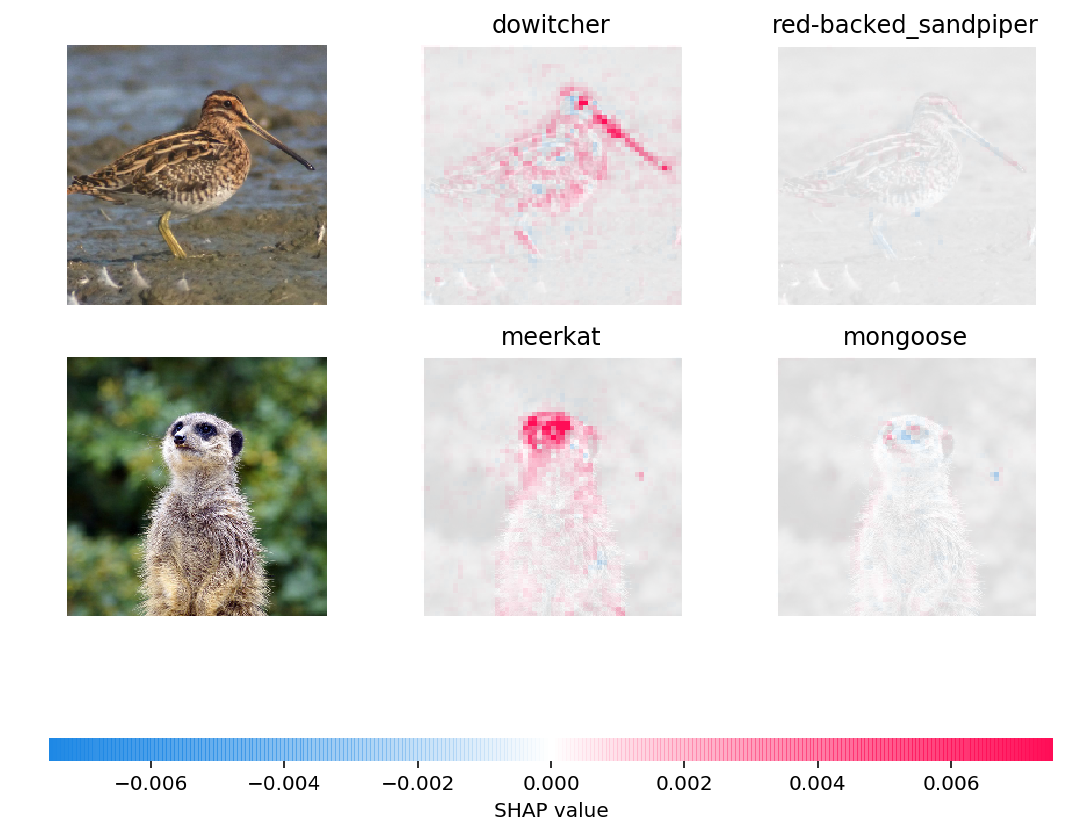
Predictions for two input images are explained in the plot above. Red pixels represent positive SHAP values that increase the probability of the class, while blue pixels represent negative SHAP values the reduce the probability of the class. By using ranked_outputs=2 we explain only the two most likely classes for each input (this spares us from explaining all 1,000 classes).

Model agnostic example with KernelExplainer (explains any function)

Kernel SHAP uses a specially-weighted local linear regression to estimate SHAP values for any model. Below is a simple example for explaining a multi-class SVM on the classic iris dataset.

import sklearn
import shap
from sklearn.model_selection import train_test_split

# print the JS visualization code to the notebook
shap.initjs()

# train a SVM classifier
X_train,X_test,Y_train,Y_test = train_test_split(*shap.datasets.iris(), test_size=0.2, random_state=0)
svm = sklearn.svm.SVC(kernel='rbf', probability=True)
svm.fit(X_train, Y_train)

# use Kernel SHAP to explain test set predictions
explainer = shap.KernelExplainer(svm.predict_proba, X_train, link="logit")
shap_values = explainer.shap_values(X_test, nsamples=100)

# plot the SHAP values for the Setosa output of the first instance
shap.force_plot(explainer.expected_value[0], shap_values[0][0,:], X_test.iloc[0,:], link="logit")

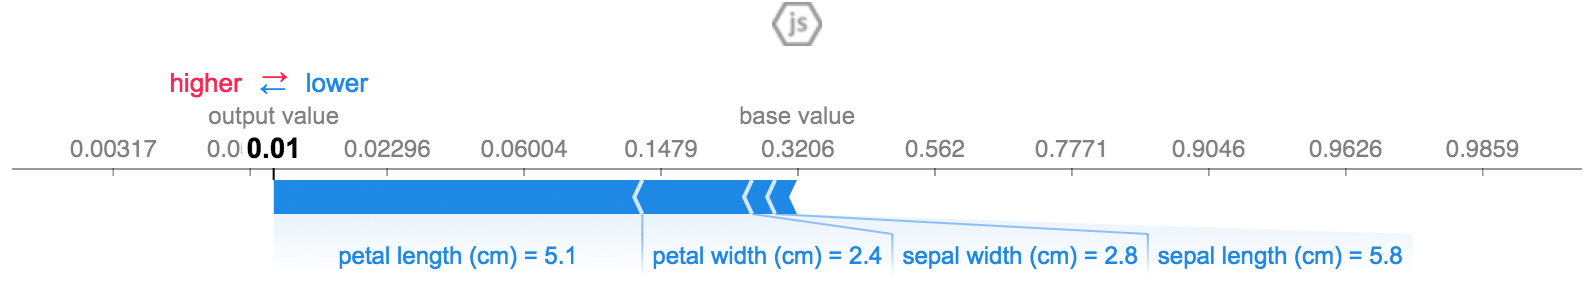
The above explanation shows four features each contributing to push the model output from the base value (the average model output over the training dataset we passed) towards zero. If there were any features pushing the class label higher they would be shown in red.

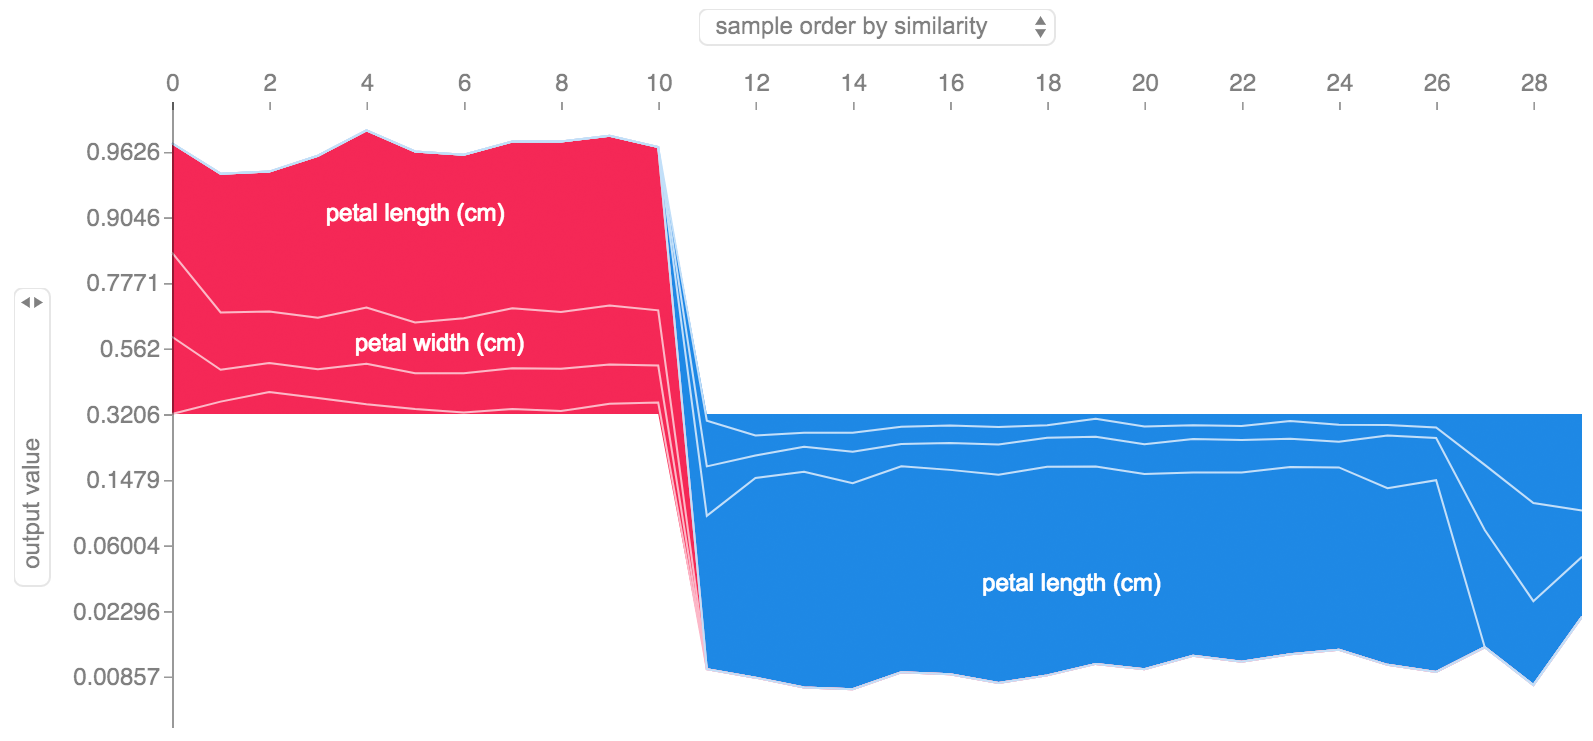
If we take many explanations such as the one shown above, rotate them 90 degrees, and then stack them horizontally, we can see explanations for an entire dataset. This is exactly what we do below for all the examples in the iris test set:

# plot the SHAP values for the Setosa output of all instances
shap.force_plot(explainer.expected_value[0], shap_values[0], X_test, link="logit")

SHAP Interaction Values

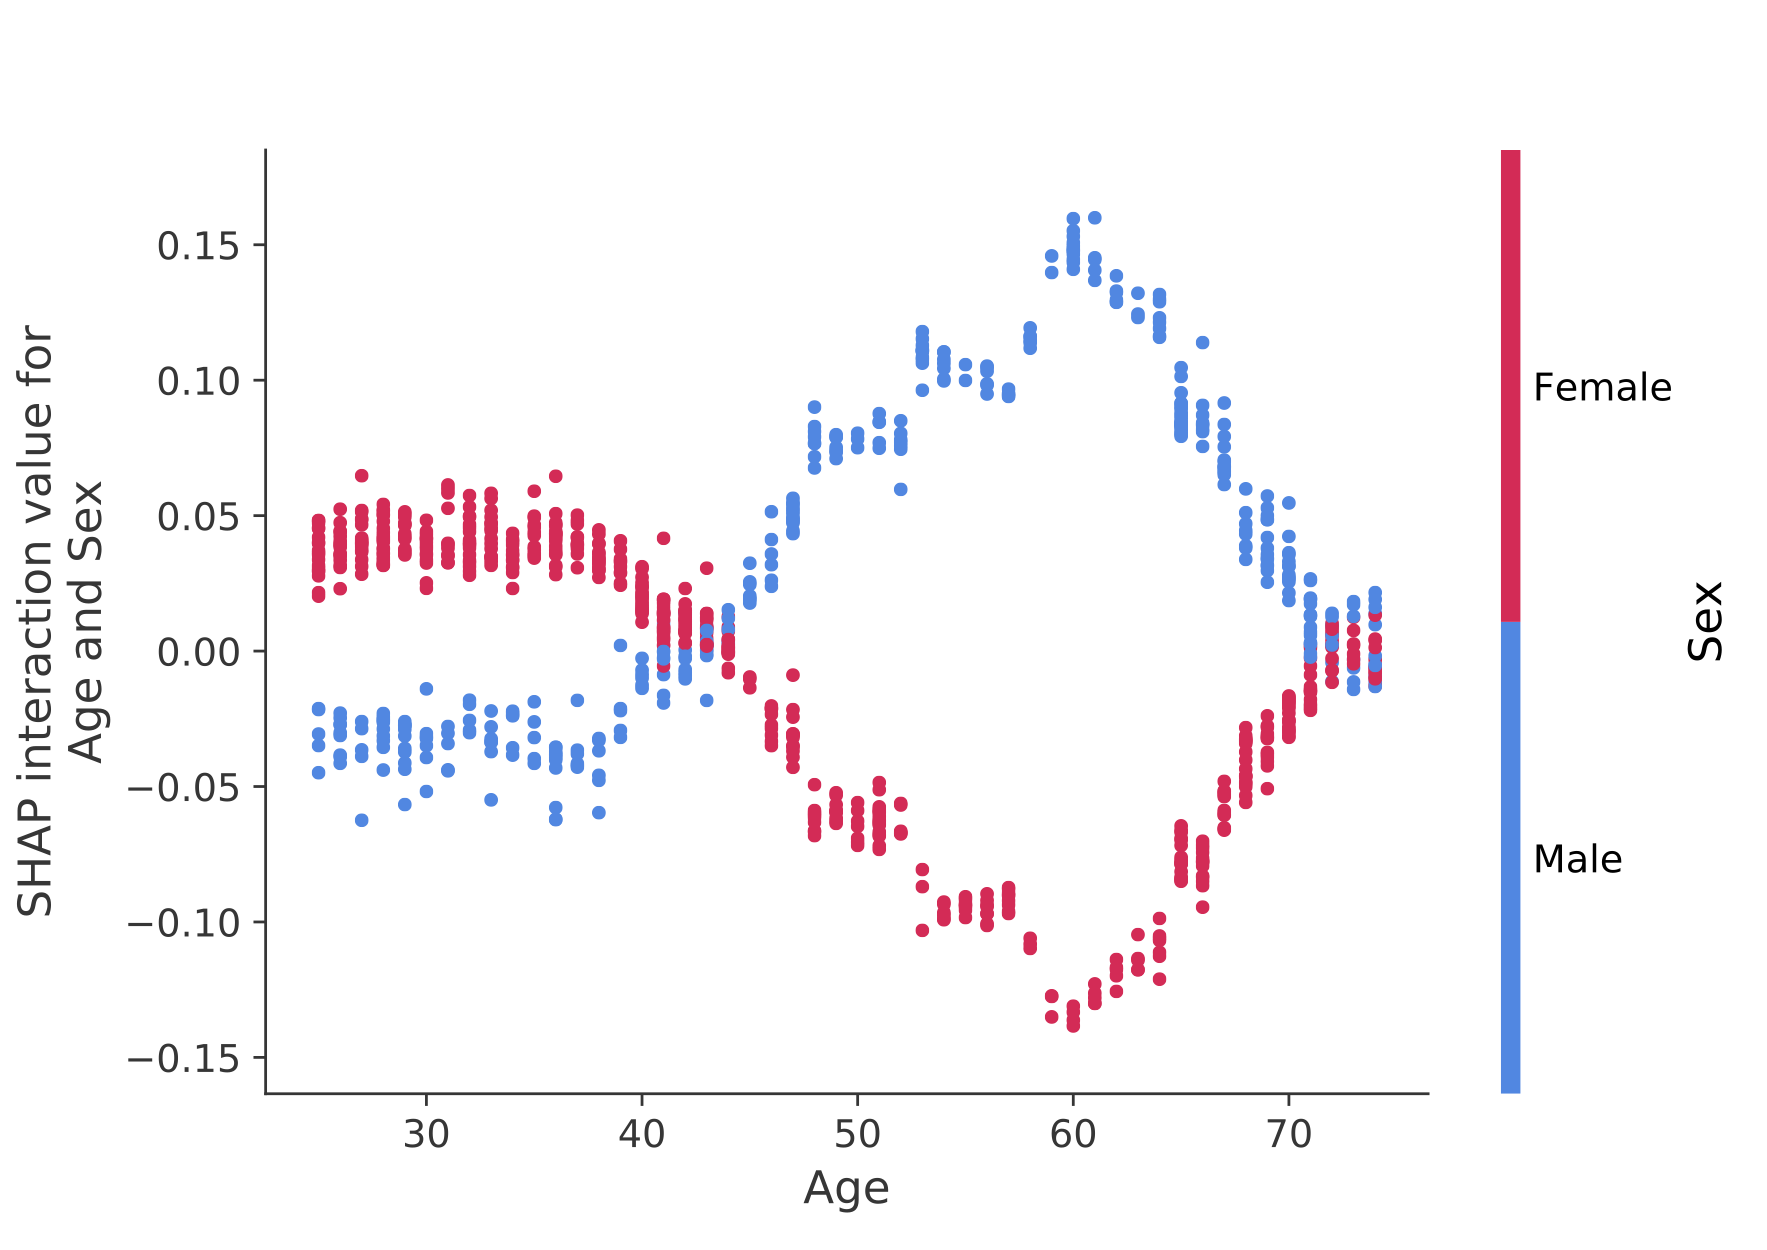
SHAP interaction values are a generalization of SHAP values to higher order interactions. Fast exact computation of pairwise interactions are implemented for tree models with shap.TreeExplainer(model).shap_interaction_values(X). This returns a matrix for every prediction, where the main effects are on the diagonal and the interaction effects are off-diagonal. These values often reveal interesting hidden relationships, such as how the increased risk of death peaks for men at age 60 (see the NHANES notebook for details):

Sample notebooks

The notebooks below demonstrate different use cases for SHAP. Look inside the notebooks directory of the repository if you want to try playing with the original notebooks yourself.

TreeExplainer

An implementation of Tree SHAP, a fast and exact algorithm to compute SHAP values for trees and ensembles of trees.

DeepExplainer

An implementation of Deep SHAP, a faster (but only approximate) algorithm to compute SHAP values for deep learning models that is based on connections between SHAP and the DeepLIFT algorithm.

GradientExplainer

An implementation of expected gradients to approximate SHAP values for deep learning models. It is based on connections between SHAP and the Integrated Gradients algorithm. GradientExplainer is slower than DeepExplainer and makes different approximation assumptions.

LinearExplainer

For a linear model with independent features we can analytically compute the exact SHAP values. We can also account for feature correlation if we are willing to estimate the feature covaraince matrix. LinearExplainer supports both of these options.

KernelExplainer

An implementation of Kernel SHAP, a model agnostic method to estimate SHAP values for any model. Because it makes not assumptions about the model type, KernelExplainer is slower than the other model type specific algorithms.

  • Census income classification with scikit-learn - Using the standard adult census income dataset, this notebook trains a k-nearest neighbors classifier using scikit-learn and then explains predictions using shap.

  • ImageNet VGG16 Model with Keras - Explain the classic VGG16 convolutional nerual network's predictions for an image. This works by applying the model agnostic Kernel SHAP method to a super-pixel segmented image.

  • Iris classification - A basic demonstration using the popular iris species dataset. It explains predictions from six different models in scikit-learn using shap.

Documentation notebooks

These notebooks comprehensively demonstrate how to use specific functions and objects.

Methods Unified by SHAP

  1. LIME: Ribeiro, Marco Tulio, Sameer Singh, and Carlos Guestrin. "Why should i trust you?: Explaining the predictions of any classifier." Proceedings of the 22nd ACM SIGKDD International Conference on Knowledge Discovery and Data Mining. ACM, 2016.

  2. Shapley sampling values: Strumbelj, Erik, and Igor Kononenko. "Explaining prediction models and individual predictions with feature contributions." Knowledge and information systems 41.3 (2014): 647-665.

  3. DeepLIFT: Shrikumar, Avanti, Peyton Greenside, and Anshul Kundaje. "Learning important features through propagating activation differences." arXiv preprint arXiv:1704.02685 (2017).

  4. QII: Datta, Anupam, Shayak Sen, and Yair Zick. "Algorithmic transparency via quantitative input influence: Theory and experiments with learning systems." Security and Privacy (SP), 2016 IEEE Symposium on. IEEE, 2016.

  5. Layer-wise relevance propagation: Bach, Sebastian, et al. "On pixel-wise explanations for non-linear classifier decisions by layer-wise relevance propagation." PloS one 10.7 (2015): e0130140.

  6. Shapley regression values: Lipovetsky, Stan, and Michael Conklin. "Analysis of regression in game theory approach." Applied Stochastic Models in Business and Industry 17.4 (2001): 319-330.

  7. Tree interpreter: Saabas, Ando. Interpreting random forests. http://blog.datadive.net/interpreting-random-forests/

Citations

The algorithms and visualizations used in this package came primarily out of research in Su-In Lee's lab at the University of Washington, and Microsoft Research. If you use SHAP in your research we would appreciate a citation to the appropriate paper(s):

Comments
  • Output value in binary classification task is outside [0, 1] range

    Output value in binary classification task is outside [0, 1] range

    Hi @slundberg,

    I've been playing with a binary classification task using XGBoost and I noticed an unexpected (for me at least) behaviour. I replicated it using the adult dataset you're providing.

    So, after training a binary classfication XGBoost model and plotting the SHAP values for a case, I'm getting the following:

    image

    Both the base value and the output value are outside the [0, 1] range. Is this the expected bahavior? If so, how can someone interpret this?

    opened by asstergi 40
  • Reshap error for SHAP calculation

    Reshap error for SHAP calculation

    Hi Scott,

    We got a reshape error when trying to test SHAP on our data. Have you seen something similar? ValueError: cannot reshape array of size 207506055 into shape (255235,0,815)

    Also please see similar errors reported here https://github.com/dmlc/xgboost/issues/4276 https://discuss.xgboost.ai/t/scala-spark-xgboost-v0-81-shap-problem/817/2

    Let me know if you need to more information to investigate.

    Best, Wei

    bug 
    opened by kongwei9901 32
  • Saving SHAP plots programmatically in Python

    Saving SHAP plots programmatically in Python

    First off, thanks a lot for such an awesome tool!

    I think I might be missing something obvious, but I'm trying to save SHAP plots from Python, that I'm displaying with the shap plotting functions. I tried a couple ways:

    import matplotlib.pyplot as plt
    ...
    shap.summary_plot(shap_values, final_model_features)
    plt.savefig('scratch.png')
    

    and...

    import matplotlib.pyplot as plt
    ...
    fig = shap.summary_plot(shap_values, final_model_features)
    plt.savefig('scratch.png')
    

    but each just saves a blank image. Is there something obvious I'm missing to programmatically save these awesome plots from Python? Or should I just be re-generating them in matplotlib off the SHAP values matrix to do that? Thanks!

    opened by MaxPowerWasTaken 31
  • TreeExplainer with xgboost model trained on GPU dies.

    TreeExplainer with xgboost model trained on GPU dies.

    Hi, I've train quite a huge model using GPU, and save/load it before using with TreeExplainer(). The problem is the jupyter kernel dies when I call TreeExplainer(model).

    I supposed that it's because the model is too big to fit GPU memory, so I tried to change the model's parameter to 'cpu_predictor' using set_params method, so that the SHAP internally use CPU & RAM for the calculation.

    But it doesn't work as I expected. Even if I changed the predictor to use CPU, the jupyter kernel still dies. There's no error log so I couldn't attach here. The program just dies. What can I do with this?

    Here's my code

    def load_model(fname):
        model = xgb.XGBClassifier()
        model.load_model(fname)
        with open(fname.replace('.xgboost', '.json'), encoding='utf-8') as fin:
            params = json.load(fin)
        model.set_params(**params)
        return model
    
    model = load_model('./model/model_2-gram_2019-02-20T15-10-38.xgboost')
    
    params = {
         'tree_method': 'hist',
         'nthread': 4,
         'predictor': 'cpu_predictor', 
         'n_gpus': 1
    }
    model.set_params(**params)
    
    # compute the SHAP values for every prediciton in the validation dataset
    # DIES HERE!
    explainer = shap.TreeExplainer(model)
    
    todo 
    opened by kyoungrok0517 28
  • How to speed up SHAP computation

    How to speed up SHAP computation

    Hi,

    The package itself is really interesting and intuitive to use. I notice however it takes quite long time to run on neural network with practical feature & sample size using KernelExplainer. Question, is there any document to explain how to properly choose

    1. sample size fed into shap.KernelExplainer, and what is the guiding principal to choose these samples;
    2. number of samples fed into function explainer.shap_values, I would assume it has something to do with number of features(columns)

    For example, I have over 1 million record with 400 raw features (continuous + unencoded categorical). Any suggestion would be appreciated.

    screen shot 2018-05-08 at 2 50 41 pm

    Above screen shot is the example using 50 samples in KernelExplainer as typical feature values and 2000 case with 500 repeats in shap_values perturbation.

    opened by bingojojstu 28
  • shap.summary_plot displaying gray plot

    shap.summary_plot displaying gray plot

    screen shot 2019-01-23 at 8 56 37 pm

    I'm facing this issue where the features are not getting the expected blue and red colors. Does anyone have any idea why this might be so? Thank you!

    opened by terryyylim 23
  • IndexError: list index out of range

    IndexError: list index out of range

    I am running the following code:

    from catboost.datasets import *
    train_df, _ = catboost.datasets.amazon()
    ix = 100
    X_train = train_df.drop('ACTION', axis=1)[:ix]
    y_train = train_df.ACTION[:ix]
    X_val = train_df.drop('ACTION', axis=1)[ix:ix+20]
    y_val = train_df.ACTION[ix:ix+20]
    model = CatBoostClassifier(iterations=100, learning_rate=0.5, random_seed=12)
    model.fit(X_train, y_train, eval_set=(X_val, y_val), verbose=False, plot=False)
    shap.TreeExplainer(model)
    

    I get the following error:

    ---------------------------------------------------------------------------
    IndexError                                Traceback (most recent call last)
    <ipython-input-2-6d52aef09dc8> in <module>
          8 model = CatBoostClassifier(iterations=100, learning_rate=0.5, random_seed=12)
          9 model.fit(X_train, y_train, eval_set=(X_val, y_val), verbose=False, plot=False)
    ---> 10 shap.TreeExplainer(model)
    
    ~/prb/anaconda3/lib/python3.6/site-packages/shap/explainers/tree.py in __init__(self, model, data, model_output, feature_dependence)
         94         self.feature_dependence = feature_dependence
         95         self.expected_value = None
    ---> 96         self.model = TreeEnsemble(model, self.data, self.data_missing)
         97 
         98         assert feature_dependence in feature_dependence_codes, "Invalid feature_dependence option!"
    
    ~/prb/anaconda3/lib/python3.6/site-packages/shap/explainers/tree.py in __init__(self, model, data, data_missing)
        594             self.dtype = np.float32
        595             cb_loader = CatBoostTreeModelLoader(model)
    --> 596             self.trees = cb_loader.get_trees(data=data, data_missing=data_missing)
        597             self.tree_output = "log_odds"
        598             self.objective = "binary_crossentropy"
    
    ~/prb/anaconda3/lib/python3.6/site-packages/shap/explainers/tree.py in get_trees(self, data, data_missing)
       1120 
       1121             # load the per-tree params
    -> 1122             depth = len(self.loaded_cb_model['oblivious_trees'][tree_index]['splits'])
       1123 
       1124             # load the nodes
    
    IndexError: list index out of range
    

    This error was spotted with Catboost version 0.15.2, I upgraded to the latest version (0.16.4 as of today), but the error persists. I have Shap version: '0.29.3'

    opened by ibuda 22
  • initial distributed summary plot

    initial distributed summary plot

    As per #16, plus a few additions to support scatter, and a few tweaks. @slundberg - it's not finished yet, but can you give some initial feedback:

    • function call: I put all the arguments at the end so as to be backward compatible, but it's not as clean
    • do you have any idea about the sum of individual kdes not equalling the overall kde?
    • any comments on the visuals and changes, including code style etc.

    Examples below. Note that the 2nd and 7th from bottom have only two unique values (i.e. one-hot encoding). These two don't quite seem to match the scatterplot, which makes me somewhat suspicious.

    hidden_names = [str(i) for i in range(len(X_train.columns))]
    summary_plot(shap_values, hidden_names, max_display=20, features=X_train.as_matrix())
    summary_plot(shap_values, hidden_names, color="#cccccc", max_display=20, features=X_train.as_matrix())
    summary_plot(shap_values, hidden_names, max_display=10, violin=False, features=X_train.as_matrix(), alpha=0.01)
    summary_plot(shap_values, hidden_names, max_display=10, violin=False, features=X_train.as_matrix(), width=0., alpha=0.01)
    

    image image image image

    opened by kodonnell 22
  • Compute shap value with tweedie objective function in xgboost

    Compute shap value with tweedie objective function in xgboost

    Following: /issues/454

    Tested to see if I could get back the prediction with the shap values computed and it works.

    only works with feature_perturbation = "interventional"

    Would be nice to have it working with "tree_path_dependent".

    opened by jfrery 20
  • SHAP Values for ensemble of XGBoost models

    SHAP Values for ensemble of XGBoost models

    First, thank for all your work for this very excellent package! It's very easy to use and produces insightful plots that have been proving useful in my day-to-day work.

    I'm currently working on a model that is an ensemble of 10 XGBoost models. What's the best way to obtain SHAP values for this ensemble? Is it even sensible to get 10 sets of SHAP values and then average them? Or is there a better way?

    opened by sergeyf 19
  • #38 add support for pyspark trees in shap explainer

    #38 add support for pyspark trees in shap explainer

    This pull request add support for pyspark Decision Trees (Random Forest and GBT) in the explainer. It doesn't use spark to explain the model, big dataset still need to be reduced and converted as panda DF in order to run the explainer.

    Limitations:

    • Categorical split aren't supported, I haven't seen this feature being supported in SHAP, if it is I'd be happy to add it but I don't see a simple way to add it
    • Variance impurity isn't supported
    • the .predict() function doesn't support prediction with spark
    opened by QuentinAmbard 18
  • Bump json5 from 1.0.1 to 1.0.2 in /javascript

    Bump json5 from 1.0.1 to 1.0.2 in /javascript

    Bumps json5 from 1.0.1 to 1.0.2.

    Release notes

    Sourced from json5's releases.

    v1.0.2

    • Fix: Properties with the name __proto__ are added to objects and arrays. (#199) This also fixes a prototype pollution vulnerability reported by Jonathan Gregson! (#295). This has been backported to v1. (#298)
    Changelog

    Sourced from json5's changelog.

    Unreleased [code, diff]

    v2.2.3 [code, diff]

    v2.2.2 [code, diff]

    • Fix: Properties with the name __proto__ are added to objects and arrays. (#199) This also fixes a prototype pollution vulnerability reported by Jonathan Gregson! (#295).

    v2.2.1 [code, diff]

    • Fix: Removed dependence on minimist to patch CVE-2021-44906. (#266)

    v2.2.0 [code, diff]

    • New: Accurate and documented TypeScript declarations are now included. There is no need to install @types/json5. (#236, #244)

    v2.1.3 [code, diff]

    • Fix: An out of memory bug when parsing numbers has been fixed. (#228, #229)

    v2.1.2 [code, diff]

    ... (truncated)

    Commits

    Dependabot compatibility score

    Dependabot will resolve any conflicts with this PR as long as you don't alter it yourself. You can also trigger a rebase manually by commenting @dependabot rebase.


    Dependabot commands and options

    You can trigger Dependabot actions by commenting on this PR:

    • @dependabot rebase will rebase this PR
    • @dependabot recreate will recreate this PR, overwriting any edits that have been made to it
    • @dependabot merge will merge this PR after your CI passes on it
    • @dependabot squash and merge will squash and merge this PR after your CI passes on it
    • @dependabot cancel merge will cancel a previously requested merge and block automerging
    • @dependabot reopen will reopen this PR if it is closed
    • @dependabot close will close this PR and stop Dependabot recreating it. You can achieve the same result by closing it manually
    • @dependabot ignore this major version will close this PR and stop Dependabot creating any more for this major version (unless you reopen the PR or upgrade to it yourself)
    • @dependabot ignore this minor version will close this PR and stop Dependabot creating any more for this minor version (unless you reopen the PR or upgrade to it yourself)
    • @dependabot ignore this dependency will close this PR and stop Dependabot creating any more for this dependency (unless you reopen the PR or upgrade to it yourself)
    • @dependabot use these labels will set the current labels as the default for future PRs for this repo and language
    • @dependabot use these reviewers will set the current reviewers as the default for future PRs for this repo and language
    • @dependabot use these assignees will set the current assignees as the default for future PRs for this repo and language
    • @dependabot use this milestone will set the current milestone as the default for future PRs for this repo and language

    You can disable automated security fix PRs for this repo from the Security Alerts page.

    dependencies 
    opened by dependabot[bot] 0
  • SHAP dependence plots with histograms and regression lines from Kernalexplainer and multioutput regression, wrapper tree based ensemble models.

    SHAP dependence plots with histograms and regression lines from Kernalexplainer and multioutput regression, wrapper tree based ensemble models.

    I want to draw SHAP partial dependence plots with regression lines + and histograms.

    I am using kernal explainer for multioutput regression as a wrapper models for xgboost / lgbm/ xgbr/ RF/ etc.

    Representing SHAP partial dependence plots (scatter plot and a regression line represented with line and shade) + histogram on the right and top are the distribution of the SHAP and values of variables.

    Reference Article : https://www.nature.com/articles/s41598-021-99920-7

    Here are the visual graphs.

    Reference codes for shap multioutput plots : https://shap.readthedocs.io/en/latest/example_notebooks/tabular_examples/model_agnostic/Multioutput%20Regression%20SHAP.html

    But I am unable to draw these kinds of graphs. Because i couldn't develop code for masker and shap values for these kid of plots. mmexport1672866881472 mmexport1672866883019 mmexport1672866887334

    opened by junaid1990 1
  • Can we plot shape dependence plots with histogram at x&y axis in Kernalexplainer for multioutput regression (wrapper models of ensemble methods)?

    Can we plot shape dependence plots with histogram at x&y axis in Kernalexplainer for multioutput regression (wrapper models of ensemble methods)?

    Can we plot shape dependence plots with histogram at x&y axis in Kernalexplainer for multioutput regression (wrapper models of ensemble methods)? Like in examples Screenshot_2023-01-05-05-01-25-311_com android chrome

    opened by junaid1990 1
  • Displaying two beeswarm plots side by side in the same figure using matplotlib

    Displaying two beeswarm plots side by side in the same figure using matplotlib

    Hello,

    I wonder how to place two independent beeswarm plots into the same figure but in different axes. I am using matplotlib version 3.4.2, shap version 0.39.0, and Python 3.8. I am trying using a single figure and two axes but realize that the beeswarm method does not handle the axis as parameter (error: TypeError: beeswarm() got an unexpected keyword argument 'ax'). Any recommendation is welcome. Thanks in advance.

    from matplotlib import pyplot as plt
    import shap
    
    fig, axes = plt.subplots(1, 2, figsize=(35, 7), gridspec_kw = {"wspace":1.0}) 
    
    shap.plots.beeswarm(explainer_a(X_test_a), max_display=10, ax = axes[0])
    shap.plots.beeswarm(explainer_b(X_test_b), max_display=10, ax = axes[1])
    
    plt.show()
    
    opened by pmoriano 0
  • Bump json5, webpack and webpack-cli in /javascript

    Bump json5, webpack and webpack-cli in /javascript

    Bumps json5 to 2.2.3 and updates ancestor dependencies json5, webpack and webpack-cli. These dependencies need to be updated together.

    Updates json5 from 2.1.3 to 2.2.3

    Release notes

    Sourced from json5's releases.

    v2.2.3

    v2.2.2

    • Fix: Properties with the name __proto__ are added to objects and arrays. (#199) This also fixes a prototype pollution vulnerability reported by Jonathan Gregson! (#295).

    v2.2.1

    • Fix: Removed dependence on minimist to patch CVE-2021-44906. (#266)

    v2.2.0

    • New: Accurate and documented TypeScript declarations are now included. There is no need to install @types/json5. (#236, #244)
    Changelog

    Sourced from json5's changelog.

    v2.2.3 [code, diff]

    v2.2.2 [code, diff]

    • Fix: Properties with the name __proto__ are added to objects and arrays. (#199) This also fixes a prototype pollution vulnerability reported by Jonathan Gregson! (#295).

    v2.2.1 [code, diff]

    • Fix: Removed dependence on minimist to patch CVE-2021-44906. (#266)

    v2.2.0 [code, diff]

    • New: Accurate and documented TypeScript declarations are now included. There is no need to install @types/json5. (#236, #244)
    Commits
    • c3a7524 2.2.3
    • 94fd06d docs: update CHANGELOG for v2.2.3
    • 3b8cebf docs(security): use GitHub security advisories
    • f0fd9e1 docs: publish a security policy
    • 6a91a05 docs(template): bug -> bug report
    • 14f8cb1 2.2.2
    • 10cc7ca docs: update CHANGELOG for v2.2.2
    • 7774c10 fix: add proto to objects and arrays
    • edde30a Readme: slight tweak to intro
    • 97286f8 Improve example in readme
    • Additional commits viewable in compare view

    Updates webpack from 4.42.1 to 5.75.0

    Release notes

    Sourced from webpack's releases.

    v5.75.0

    Bugfixes

    • experiments.* normalize to false when opt-out
    • avoid NaN%
    • show the correct error when using a conflicting chunk name in code
    • HMR code tests existance of window before trying to access it
    • fix eval-nosources-* actually exclude sources
    • fix race condition where no module is returned from processing module
    • fix position of standalong semicolon in runtime code

    Features

    • add support for @import to extenal CSS when using experimental CSS in node
    • add i64 support to the deprecated WASM implementation

    Developer Experience

    • expose EnableWasmLoadingPlugin
    • add more typings
    • generate getters instead of readonly properties in typings to allow overriding them

    v5.74.0

    Features

    • add resolve.extensionAlias option which allows to alias extensions
      • This is useful when you are forced to add the .js extension to imports when the file really has a .ts extension (typescript + "type": "module")
    • add support for ES2022 features like static blocks
    • add Tree Shaking support for ProvidePlugin

    Bugfixes

    • fix persistent cache when some build dependencies are on a different windows drive
    • make order of evaluation of side-effect-free modules deterministic between concatenated and non-concatenated modules
    • remove left-over from debugging in TLA/async modules runtime code
    • remove unneeded extra 1s timestamp offset during watching when files are actually untouched
      • This sometimes caused an additional second build which are not really needed
    • fix shareScope option for ModuleFederationPlugin
    • set "use-credentials" also for same origin scripts

    Performance

    • Improve memory usage and performance of aggregating needed files/directories for watching
      • This affects rebuild performance

    Extensibility

    • export HarmonyImportDependency for plugins

    v5.73.0

    ... (truncated)

    Commits

    Updates webpack-cli from 3.3.11 to 5.0.1

    Release notes

    Sourced from webpack-cli's releases.

    v5.0.1

    5.0.1 (2022-12-05)

    Bug Fixes

    • make define-process-env-node-env alias node-env (#3514) (346a518)

    v5.0.0

    5.0.0 (2022-11-17)

    Bug Fixes

    • improve description of the --disable-interpret option (#3364) (bdb7e20)
    • remove the redundant utils export (#3343) (a9ce5d0)
    • respect NODE_PATH env variable (#3411) (83d1f58)
    • show all CLI specific flags in the minimum help output (#3354) (35843e8)

    Features

    • failOnWarnings option (#3317) (c48c848)
    • update commander to v9 (#3460) (6621c02)
    • added the --define-process-env-node-env option
    • update interpret to v3 and rechoir to v0.8
    • add an option for preventing interpret (#3329) (c737383)

    BREAKING CHANGES

    • the minimum supported webpack version is v5.0.0 (#3342) (b1af0dc), closes #3342
    • webpack-cli no longer supports webpack v4, the minimum supported version is webpack v5.0.0
    • webpack-cli no longer supports webpack-dev-server v3, the minimum supported version is webpack-dev-server v4.0.0
    • remove the migrate command (#3291) (56b43e4), closes #3291
    • remove the --prefetch option in favor the PrefetchPlugin plugin
    • remove the --node-env option in favor --define-process-env-node-env
    • remove the --hot option in favor of directly using the HotModuleReplacement plugin (only for build command, for serve it will work)
    • the behavior logic of the --entry option has been changed - previously it replaced your entries, now the option adds a specified entry, if you want to return the previous behavior please use webpack --entry-reset --entry './src/my-entry.js'

    v4.10.0

    4.10.0 (2022-06-13)

    Bug Fixes

    Features

    v4.9.2

    4.9.2 (2022-01-24)

    ... (truncated)

    Changelog

    Sourced from webpack-cli's changelog.

    5.0.1 (2022-12-05)

    Bug Fixes

    • make define-process-env-node-env alias node-env (#3514) (346a518)

    5.0.0 (2022-11-17)

    Bug Fixes

    • improve description of the --disable-interpret option (#3364) (bdb7e20)
    • remove the redundant utils export (#3343) (a9ce5d0)
    • respect NODE_PATH env variable (#3411) (83d1f58)
    • show all CLI specific flags in the minimum help output (#3354) (35843e8)

    Features

    • failOnWarnings option (#3317) (c48c848)
    • update commander to v9 (#3460) (6621c02)
    • added the --define-process-env-node-env option
    • update interpret to v3 and rechoir to v0.8
    • add an option for preventing interpret (#3329) (c737383)

    BREAKING CHANGES

    • the minimum supported webpack version is v5.0.0 (#3342) (b1af0dc), closes #3342
    • webpack-cli no longer supports webpack v4, the minimum supported version is webpack v5.0.0
    • webpack-cli no longer supports webpack-dev-server v3, the minimum supported version is webpack-dev-server v4.0.0
    • remove the migrate command (#3291) (56b43e4), closes #3291
    • remove the --prefetch option in favor the PrefetchPlugin plugin
    • remove the --node-env option in favor --define-process-env-node-env
    • remove the --hot option in favor of directly using the HotModuleReplacement plugin (only for build command, for serve it will work)
    • the behavior logic of the --entry option has been changed - previously it replaced your entries, now the option adds a specified entry, if you want to return the previous behavior please use webpack --entry-reset --entry './src/my-entry.js'

    4.10.0 (2022-06-13)

    Bug Fixes

    Features

    4.9.2 (2022-01-24)

    Bug Fixes

    • respect negatedDescription for flags from schema (#3102) (463b731)

    ... (truncated)

    Commits
    • 4a0f893 chore(release): publish new version
    • 9de982c chore: fix cspell
    • 32d26c8 chore(deps-dev): bump cspell from 6.15.1 to 6.16.0 (#3517)
    • 2788bf9 chore(deps-dev): bump eslint from 8.28.0 to 8.29.0 (#3516)
    • ac88ee4 chore(deps-dev): bump lint-staged from 13.0.4 to 13.1.0 (#3515)
    • 346a518 fix: make define-process-env-node-env alias node-env (#3514)
    • 3ec7b16 chore(deps): bump yeoman-environment from 3.12.1 to 3.13.0 (#3508)
    • c8adfa6 chore(deps-dev): bump @​types/node from 18.11.9 to 18.11.10 (#3513)
    • 0ad8cc2 chore(deps-dev): bump cspell from 6.15.0 to 6.15.1 (#3512)
    • d30f261 chore(deps-dev): bump ts-loader from 9.4.1 to 9.4.2 (#3511)
    • Additional commits viewable in compare view
    Maintainer changes

    This version was pushed to npm by evilebottnawi, a new releaser for webpack-cli since your current version.


    Dependabot will resolve any conflicts with this PR as long as you don't alter it yourself. You can also trigger a rebase manually by commenting @dependabot rebase.


    Dependabot commands and options

    You can trigger Dependabot actions by commenting on this PR:

    • @dependabot rebase will rebase this PR
    • @dependabot recreate will recreate this PR, overwriting any edits that have been made to it
    • @dependabot merge will merge this PR after your CI passes on it
    • @dependabot squash and merge will squash and merge this PR after your CI passes on it
    • @dependabot cancel merge will cancel a previously requested merge and block automerging
    • @dependabot reopen will reopen this PR if it is closed
    • @dependabot close will close this PR and stop Dependabot recreating it. You can achieve the same result by closing it manually
    • @dependabot ignore this major version will close this PR and stop Dependabot creating any more for this major version (unless you reopen the PR or upgrade to it yourself)
    • @dependabot ignore this minor version will close this PR and stop Dependabot creating any more for this minor version (unless you reopen the PR or upgrade to it yourself)
    • @dependabot ignore this dependency will close this PR and stop Dependabot creating any more for this dependency (unless you reopen the PR or upgrade to it yourself)
    • @dependabot use these labels will set the current labels as the default for future PRs for this repo and language
    • @dependabot use these reviewers will set the current reviewers as the default for future PRs for this repo and language
    • @dependabot use these assignees will set the current assignees as the default for future PRs for this repo and language
    • @dependabot use this milestone will set the current milestone as the default for future PRs for this repo and language

    You can disable automated security fix PRs for this repo from the Security Alerts page.

    dependencies 
    opened by dependabot[bot] 0
Releases(v0.41.0)
  • v0.41.0(Jun 16, 2022)

    Lots of bugs fixes and API improvements.

    • Fixed rare bug with XGBoost model loading by @TheZL @lrjball
    • Fixed the beeswarm plot so it does not modify the passed explanation object, @ravwojdyla
    • Automatic wheel building using GH actions by @quantumtec
    • GC collection for memory in KernelExplainer by @Qingtian-Zou
    • Fixed max_evals params for PartitionExplainer
    • JIT optimize the PartitionExplainer
    • Fix colorbar formatting issues @SleepyPepperHead
    • New benchmark notebooks
    • Use display_data for plotting when possible @yuuuxt
    • Improved GPUTreeShap compilation and params @RAMitchell
    • Fix TF API change in DeepExplainer @filusn
    • Add torch tensor support for plots @alexander-pv
    • Switch to Github actions for testing instead of Travis
    • New California demo dataset @swalsh1123
    • Fix waterfall plot bug @RichardScottOZ
    • Handle missing matplotlib installation @klieret
    • Add linearize link support for Additive explainer (Nandish Gupta)
    • Fix exceptions to be more specific @alexisdrakopoulos @collinb9
    • Add color map option for plotting @tlabarta
    • Release fixed numpy version requirement @rmehyde
    • And many other contributions kindly made by @WeichenXu123 @imatiach-msft @zeshengli @nkthiebaut @songololo @GiovannaNicora @joshzwiebel @Ashishbodla @navdeep-G @smathewmanuel @ycouble @anubhavmaity @adityasaini70 @ngupta20 @jckkvs @abs428 @JulesCollenne @Tiagosf00 @javirandor and @Thuener
    Source code(tar.gz)
    Source code(zip)
  • v0.40.0(Oct 20, 2021)

    This release contains many bugs fixes and lots of new functionality, specifically for transformer based NLP models. Some highlights include:

    • New plots, bug fixes, docs, and features for NLP model explanations (see docs for details).
    • important permutation explainer performance fix by @sander-sn
    • New joint scatter plots to plot many at once on the same y-scale
    • better tree model memory usage by @morriskurz
    • new docs by @coryroyce
    • new wheel building by @PrimozGodec
    • dark mode improvements for the docs by @gialmisi
    • api tweaks by @c56pony @nsorros @jebarb
    Source code(tar.gz)
    Source code(zip)
  • v0.39.0(Mar 3, 2021)

    Lots of new text explainer work courtesy of @ryserrao and serialization courtesy of @vivekchettiar! (will note all the other changes later)

    Source code(tar.gz)
    Source code(zip)
  • v0.38.1(Jan 15, 2021)

  • v0.38.0(Jan 14, 2021)

    This release contains improved support for explanations of transformer text models and support for the new Explanation object based API. Specific improvements include:

    • Transformer model support in the Text explainer courtesy of @ryserrao
    • Interventional Tree explainer GPU support courtesy of @RAMitchell
    • Image captioning model support courtesy of @anusham1990
    • Benchmarking improvements courtesy of @maggiewu19
    • New text and image visualizations courtesy of @vivekchettiar
    • New explainer serialization support courtesy of @vivekchettiar
    • Bug fixes for Linear explainer and the new API courtesy of @heimengqi
    • Fix for categorical plots courtesy of @jeffreyftang
    • CUDA support improvements courtesy of @JohnZed
    • Support for econML model courtesy of @vasilismsr
    • Many other bug fixes and API improvements.
    Source code(tar.gz)
    Source code(zip)
  • v0.37.0(Nov 4, 2020)

    This release contains more support for the new API, many bug fixes, and preliminary model agnostic text/image explainer support (still beta). Specific contributions include:

    • Fix Sampling explainer sample counting issue courtesy of @tcbegley
    • Add multi-bar plotting support.
    • Preliminary support for cohorts.
    • Fixed an import error courtesy of @suragnair
    • Fix Tree explainer issues with isolation forests with max_features < 1 courtesy of @zhanjiezhu
    • Huge documentation cleanup and update courtesy of @lrjball
    • Typo fix courtesy of @anusham1990
    • Added a documentation notebook for the Exact explainer.
    • Text and Image explainers courtesy of @anusham1990 and Ryan Serrao
    • Bug fix for shap.utils.hclust
    • Initial support for InterpretML EBM models.
    • Added column grouping functionality to Explainer objects.
    • Fix for loop index bug in Deep explainer for PyTorch courtesy of @quentinRaq
    • Initial text to text visualization concepts courtesy of @vivekchettiar
    • Color conversion warning fix courtesy of @wangjoshuah
    • Fix invertibility issues in Kernel explainer with the pseudoinverse courtesy of @PrimozGodec
    • New benchmark code courtesy of @maggiewu19 and @vivekchettiar
    • Other small bug fixes and enhancements.
    Source code(tar.gz)
    Source code(zip)
  • v0.36.0(Aug 27, 2020)

    This version contains a significant refactoring of the SHAP code base into a new (cleaner) API. Full backwards compatibility should be retained, but most things are now available in locations with the new API. Note that this API is still in a beta form, so refrain from depending on it for production code until the next release. Highlights include:

    • A new shap.Explainer object that auto-chooses the explainer based on the given model and masking dataset.
    • A new shap.Explanation object that allows for parallel slicing of data, SHAP values, base values (expected values), and other explanation-specific elements.
    • A new shap.maskers.* module that separates the various ways to mask (i.e. perturb/hide) features from the algorithms themselves.
    • A new shap.explainers.Partition explainer that can explain any text or image models very quickly.
    • A new shap.maskers.Partition masker that ensures tightly grouped features are perturbed in unison, so preventing "unrealistic" model inputs from inappropriately influencing the model prediction. It also allows for the exact quadratic time computation of SHAP values for the 'structured games' (with coalitions structured according to a hierarchical clustering).
    • A new shap.plots.* module with revamped plot types that all support the new API. Plots are now named more directly, so summary_plot (default) becomes beeswarm, and dependent_plot becomes scatter. Not all the plots have been ported over to the new API, but most have.
    • A new notebooks/plots/* directory given examples of how to use the new plotting functions.
    • A new shap.plots.bar function to directly create bar plots and also display hierarchical clustering structures to group redundant features together, and show the structure used by a Partition explainer (that relied on Owen values, which are an extension of Shapley values).
    • Equally check fixes courtesy of @jameslamb
    • Sparse kmeans support courtesy of @PrimozGodec
    • Pytorch bug fixes courtesy of @rightx2
    • NPM JS code clean up courtesy of @SachinVarghese
    • Fix logit force plot bug courtesy of @ehuijzer
    • Decision plot documentation updates courtesy of @floidgilbert
    • sklearn GBM fix courtesy of @ChemEngDataSci
    • XGBoost 1.1 fix courtesy of @lrjball
    • Make SHAP spark serializable courtesy of @QuentinAmbard
    • Custom summary plot color maps courtesy of @nasir-bhanpuri
    • Support string inputs for KernelSHAP courtesy of @YotamElor
    • Doc fixes courtesy of @imatiach-msft
    • Support for GPBoost courtesy of @fabsig
    • Import bug fix courtesy of @gracecarrillo and @aokeson
    Source code(tar.gz)
    Source code(zip)
  • 0.35.0(Feb 27, 2020)

    This release includes:

    • Better support for TensorFlow 2 (thanks @imatiach-msft)
    • Support for NGBoost models in TreeExplainer (thanks @zhiruiwang)
    • TreeExplainer support for the new sklearn.ensemble.HistGradientBoosting model.
    • New improved versions of PartitionExplainer for images and text.
    • IBM zOS compatibility courtesy of @DorianCzichotzki.
    • Support for XGBoost 1.0
    • Many bug fixes courtesy of Ivan, Christian Paul, @RandallJEllis, and @ibuda.
    Source code(tar.gz)
    Source code(zip)
  • 0.34.0(Dec 27, 2019)

    This release includes:

    • Many small bug fixes.
    • Better matplotlib text alignment during rotation courtesy of @koomie
    • Cleaned up the C++ transformer code to allow easier PRs.
    • Fixed a too tight check_additivity tolerance in TreeExplainer #950
    • Updated the LinearExplainer API to match TreeExplainer
    • Allow custom class ordering in a summary_plot courtesy of @SimonStreicher
    Source code(tar.gz)
    Source code(zip)
  • 0.33.0(Dec 11, 2019)

    This release contains various bug fixes and new features including:

    • Added PySpark support for TreeExplainer courtesy of @QuentinAmbard
    • A new type of plot that is an alternative to the force_plot, a waterfall_plot
    • A new PermutationExplainer that is an alternative to KernelExplainer and SamplingExplainer.
    • Added return_variances to GradientExplainer for PyTorch courtesy of @s6juncheng
    • Now we use exceptions rather than assertions in TreeExplainer courtesy of @ssaamm
    • Fixed image_plot transpose issue courtesy of @Jimbotsai
    • Fix color bar axis attachment issue courtesy of Lasse Valentini Jensen
    • Fix tensor attachment issue in PyTorch courtesy of @gabrieltseng
    • Fix color clipping ranges in summary_pot courtesy of @joelostblom
    • Address sklearn 0.22 API changes courtesy of @lemon-yellow
    • Ensure matplotlib is optional courtesy of @imatiach-msft
    Source code(tar.gz)
    Source code(zip)
  • 0.32.1(Nov 6, 2019)

  • 0.32.0(Nov 6, 2019)

    This release includes:

    • Support for sklearn isolation forest courtesy of @JiechengZhao
    • New check_additivity tests to ensure no errors in DeepExplainer and TreeExplainer
    • Fix #861, #860
    • Fix missing readme example html file
    • Support for spark decision tree regressor courtesy of @QuentinAmbard
    • Better safe isinstance checking courtesy of @parsatorb
    • Fix eager execution in TF < 2 courtesy of @bottydim
    Source code(tar.gz)
    Source code(zip)
  • 0.31.0(Oct 21, 2019)

    This release contains several new features and bug fixes:

    • GradientExplainer now supports TensorFlow 2.0.
    • We now do a lazy load of the plotting dependencies, which means a pip install no longer needs to also pull in matplotlib, skimage, and ipython. This should make installs much lighter, especially those that don't need plotting :)
    • Added a new BruteForceExplainer for easy testing and comparison on small problems.
    • Added a new partial_dependence_plot function. This function will be used to illustrate the close connections between partial dependence plots and SHAP values in future example notebooks.
    • Handle the multiclass case with no intercept in LinearExplainer courtesy of @gabrieltseng
    • Some extras_require options during the pip install courtesy of @AbdealiJK
    • Other small bug fixes and updates
    Source code(tar.gz)
    Source code(zip)
  • 0.30.2(Oct 9, 2019)

    This release is primarily to remove a dependency on dill that was not in setup.py. It also includes:

    • A typo fix in force.py courtesy of @jonlwowski012
    • Test code cleanup courtesy of @jorgecarleitao
    Source code(tar.gz)
    Source code(zip)
  • 0.30.1(Sep 9, 2019)

    • Fix floating point rounding mismatches in recent sklearn versions of tree models
    • An update to allow easier loading of custom tree ensemble models by TreeExplainer.
    • decision_plot documentation updates courtesy of @floidgilbert
    Source code(tar.gz)
    Source code(zip)
  • 0.30.0(Aug 31, 2019)

    • New decision_plot function courtesy of @floidgilbert
    • Add alpha version of the new model agnostic PartitionExplainer
    • ensure data is all on the same device for pytorch in DeepExplainer courtesy of @gabrieltseng
    • fix lightgbm edge case issue courtesy of @imatiach-msft
    • create binder setup for shap courtesy of @jamesmyatt
    • Allow for multiple inputs in the gradient explainer courtesy of @gabrieltseng
    • New KernelExplainer unit tests courtesy of @jorgecarleitao
    • Add python 2/3 trove classifiers courtesy of @proinsias
    • support for pyspark trees courtesy of @QuentinAmbard
    • many other bug fixes courtesy of @Rygu, @Kylecrif, @trams, @imatiach-msft, @yunchuankong, @invokermain, @lupusomniator, @satyarta, @jotsif, @parkerzf, @jaller94, @gabrieltseng, and others
    Source code(tar.gz)
    Source code(zip)
  • 0.29.3(Jun 19, 2019)

  • 0.29.2(Jun 19, 2019)

    Various bug fixes and improvements including:

    • adding SHAP values for binary classification to CatBoost courtesy of @dvpolyakov
    • Integer division fix for plots courtesy of @pmeier-tiplu
    • Support passing in an Axes object to dependence_plot courtesy of @mqk
    • Add adaptive average pooling and conv transpose layers courtesy of of @gabrieltseng
    • fix import errors on a missing matplotlib backend courtesy of @hchandola
    • fix TreeExplainer GradientBoostingClassifier bug courtesy of @prempiyush
    • make tqdm play nicer with notebooks courtesy of @KOLANICH
    • Allow deep_pytorch to use cuda models courtesy of @juliusbierk
    • Fix sklearn GradientBoostingRegressor bug courtesy of @nasir-bhanpuri
    • adding sparse support to shap linear explainer courtesy of @imatiach-msft
    Source code(tar.gz)
    Source code(zip)
  • 0.29.1(May 15, 2019)

  • 0.29.0(May 14, 2019)

    A few contribution highlights of this release (in chronological order)

    • Better testing courtesy of @jorgecarleitao
    • Image plot customizations courtesy of @verdimrc
    • Batch norm support for PyTorch in DeepExplainer courtesy of @JiechengZhao
    • Leaky ReLU and other conv layer support for pytorch deep explainer courtesy of @gabrieltseng
    • Fixed keras multi input in gradient explainer and improved random seeds courtesy of @moritzaugustin
    • Support for catBoost ranker courtesy of @doramir
    • Added XGBRanker and LGBMRanker to TreeExplainer courtesy of @imatiach-msft
    • Fix embedding lookup with tf.keras in DeepExplainer courtesy of @andriy-nikolov
    • Custom dependence_plot colors maps courtesy of @rcarneva
    • Fix divide by zero issues possible with CatBoost models courtesy of @dvpolyakov
    • Lots of other bug fixes/improvements!
    Source code(tar.gz)
    Source code(zip)
  • 0.28.5(Feb 16, 2019)

  • 0.28.4(Feb 16, 2019)

    • Fixes memory corruption error from TreeExplainer (courtesy of @imatiach-msft)
    • Adds support for skopt Random Forest and ExtraTrees Regressors (courtesy of @Bacoknight)
    • Adds support for matplotlib forceplot with text rotation (courtesy of @vatsan)
    • Adds a save_html function
    Source code(tar.gz)
    Source code(zip)
  • 0.28.3(Jan 24, 2019)

  • 0.28.2(Jan 23, 2019)

  • 0.28.1(Jan 23, 2019)

    • Fixes a byte-alignment issue on Windows when loading XGBoost models.
    • Now matches tree_limit use in XGBoost models courtesy of @HughChen
    • Fix an issue with the expected_value of transformed model outputs in TreeExplainer
    Source code(tar.gz)
    Source code(zip)
  • 0.28.0(Jan 21, 2019)

    • Add support for rank-based feature selection in KernelExplainer.
    • Depreciate l1_reg="auto" in KernelExplainer in favor of eventually defaulting to l1_reg="num_features(10)"
    • New color scales based on the Lch color space.
    • Better auto-color choices for multi-class summary plots.
    • Better plotting of NaN values in dependence_plots
    • Updates for Pytorch 1.0 courtesy of @gabrieltseng
    • Fix the sklearn DecisionTreeClassifier handling to correctly normalize to a probability output
    • Enable multi-output model support for TreeExplainer when feature_dependence="independent"
    • Correctly load the objective of LightGBM models for use in explaining the model loss.
    • Fix numerical precision mismatch with sklearn models.
    • Fix numerical precision mismatch with XGBoost models by now directly loading from memory instead of JSON.
    Source code(tar.gz)
    Source code(zip)
  • 0.27.0(Jan 1, 2019)

    • Better hierarchal clustering orderings that now rotate subtrees to give more continuity.
    • Work around XGBoost JSON issue.
    • Account for NaNs when doing auto interaction detection.
    • PyTorch fixes.
    • Updated LinearExplainer.
    Source code(tar.gz)
    Source code(zip)
  • 0.26.0(Dec 12, 2018)

    • Complete refactor of TreeExplainer to support deeper C++ integration
    • The ability to explain transformed outputs of tree models in TreeExplainer, including the loss. In collaboration with @HughChen
    • Allow for a dynamic reference value in DeepExplainer courtesy of @AvantiShri
    • Add x_jitter option for categorical dependence plots courtesy of @ihopethiswillfi
    • Added support for GradientBoostingRegressor with quantile loss courtesy of @dmilad
    • Better plotting support for NaN values
    • Fixes several bugs.
    Source code(tar.gz)
    Source code(zip)
  • 0.25.2(Nov 9, 2018)

    • Allows ordering_keys to be given to force_plot courtesy of @JasonTam
    • Fixes sparse nonzero background issue with KernelExplainer courtesy of @imatiach-msft
    • Fix to support tf.concat in DeepExplainer.
    Source code(tar.gz)
    Source code(zip)
  • 0.25.1(Nov 8, 2018)

Owner
Scott Lundberg
Scott Lundberg
A data-driven approach to quantify the value of classifiers in a machine learning ensemble.

Documentation | External Resources | Research Paper Shapley is a Python library for evaluating binary classifiers in a machine learning ensemble. The

Benedek Rozemberczki 187 Dec 27, 2022
Lime: Explaining the predictions of any machine learning classifier

lime This project is about explaining what machine learning classifiers (or models) are doing. At the moment, we support explaining individual predict

Marco Tulio Correia Ribeiro 10.3k Jan 1, 2023
Visual analysis and diagnostic tools to facilitate machine learning model selection.

Yellowbrick Visual analysis and diagnostic tools to facilitate machine learning model selection. What is Yellowbrick? Yellowbrick is a suite of visual

District Data Labs 3.9k Dec 30, 2022
Visualizer for neural network, deep learning, and machine learning models

Netron is a viewer for neural network, deep learning and machine learning models. Netron supports ONNX (.onnx, .pb, .pbtxt), Keras (.h5, .keras), Tens

Lutz Roeder 20.9k Dec 28, 2022
Visualizer for neural network, deep learning, and machine learning models

Netron is a viewer for neural network, deep learning and machine learning models. Netron supports ONNX, TensorFlow Lite, Keras, Caffe, Darknet, ncnn,

Lutz Roeder 16.3k Sep 27, 2021
Algorithms for monitoring and explaining machine learning models

Alibi is an open source Python library aimed at machine learning model inspection and interpretation. The focus of the library is to provide high-qual

Seldon 1.9k Dec 30, 2022
A library for debugging/inspecting machine learning classifiers and explaining their predictions

ELI5 ELI5 is a Python package which helps to debug machine learning classifiers and explain their predictions. It provides support for the following m

null 2.6k Dec 30, 2022
FairML - is a python toolbox auditing the machine learning models for bias.

======== FairML: Auditing Black-Box Predictive Models FairML is a python toolbox auditing the machine learning models for bias. Description Predictive

Julius Adebayo 338 Nov 9, 2022
A library that implements fairness-aware machine learning algorithms

Themis ML themis-ml is a Python library built on top of pandas and sklearnthat implements fairness-aware machine learning algorithms. Fairness-aware M

Niels Bantilan 105 Dec 30, 2022
Interpretability and explainability of data and machine learning models

AI Explainability 360 (v0.2.1) The AI Explainability 360 toolkit is an open-source library that supports interpretability and explainability of datase

null 1.2k Dec 29, 2022
A collection of research papers and software related to explainability in graph machine learning.

A collection of research papers and software related to explainability in graph machine learning.

AstraZeneca 1.9k Dec 26, 2022
JittorVis - Visual understanding of deep learning model.

JittorVis is a deep neural network computational graph visualization library based on Jittor.

null 182 Jan 6, 2023
Code for "High-Precision Model-Agnostic Explanations" paper

Anchor This repository has code for the paper High-Precision Model-Agnostic Explanations. An anchor explanation is a rule that sufficiently “anchors”

Marco Tulio Correia Ribeiro 735 Jan 5, 2023
Python Library for Model Interpretation/Explanations

Skater Skater is a unified framework to enable Model Interpretation for all forms of model to help one build an Interpretable machine learning system

Oracle 1k Dec 27, 2022
Model analysis tools for TensorFlow

TensorFlow Model Analysis TensorFlow Model Analysis (TFMA) is a library for evaluating TensorFlow models. It allows users to evaluate their models on

null 1.2k Dec 26, 2022
Tool for visualizing attention in the Transformer model (BERT, GPT-2, Albert, XLNet, RoBERTa, CTRL, etc.)

Tool for visualizing attention in the Transformer model (BERT, GPT-2, Albert, XLNet, RoBERTa, CTRL, etc.)

Jesse Vig 4.7k Jan 1, 2023
Quickly and easily create / train a custom DeepDream model

Dream-Creator This project aims to simplify the process of creating a custom DeepDream model by using pretrained GoogleNet models and custom image dat

null 56 Jan 3, 2023
L2X - Code for replicating the experiments in the paper Learning to Explain: An Information-Theoretic Perspective on Model Interpretation.

L2X Code for replicating the experiments in the paper Learning to Explain: An Information-Theoretic Perspective on Model Interpretation at ICML 2018,

Jianbo Chen 113 Sep 6, 2022
Khandakar Muhtasim Ferdous Ruhan 1 Dec 30, 2021
Officile code repository for "A Game-Theoretic Perspective on Risk-Sensitive Reinforcement Learning"

CvarAdversarialRL Official code repository for "A Game-Theoretic Perspective on Risk-Sensitive Reinforcement Learning". Initial setup Create a virtual

Mathieu Godbout 1 Nov 19, 2021