Tweets your monthly GitHub Contributions as Wordle grid

Overview

wordle-github-contributions

Tweets your monthly GitHub Contributions as Wordle grid

kizie-1488349199779389443

with tweepy support

name: Wordle GitHub Contributions

on:
  schedule:
    # at 08:00 on day-of-month 1
    - cron: "0 8 1 * *"

jobs:
  tweet-contribution-chart:
    runs-on: ubuntu-latest
    steps:
      - uses: actions/checkout@v2
      - uses: vchrombie/wordle-github-contributions@master
        env:
          GH_TOKEN: ${{ secrets.GITHUB_TOKEN }}
          TWITTER_CONSUMER_KEY: ${{ secrets.TWITTER_CONSUMER_KEY }}
          TWITTER_CONSUMER_SECRET: ${{ secrets.TWITTER_CONSUMER_SECRET }}
          TWITTER_ACCESS_TOKEN: ${{ secrets.TWITTER_ACCESS_TOKEN }}
          TWITTER_ACCESS_TOKEN_SECRET: ${{ secrets.TWITTER_ACCESS_TOKEN_SECRET }}
You might also like...
Python script for writing text on github contribution chart.

Github Contribution Drawer Python script for writing text on github contribution chart. Requirements Python 3.X Getting Started Create repository Put

Visualise top-rated GitHub repositories in a barchart by keyword

This python script was written for simple purpose -- to visualise top-rated GitHub repositories in a barchart by keyword. Script generates html-page with barchart and information about repository owner, description, create date and update date.

OpenStats is a library built on top of streamlit that extracts data from the Github API and shows the main KPIs

Open Stats Discover and share the KPIs of your OpenSource project. OpenStats is a library built on top of streamlit that extracts data from the Github

Automatically generate GitHub activity!

Commit Bot Automatically generate GitHub activity! We've all wanted to be the developer that commits every day, but that requires a lot of work. Let's

Create Badges with stats of Scratch User, Project and Studio. Use those badges in Github readmes, etc.

Scratch-Stats-Badge Create customized Badges with stats of Scratch User, Studio or Project. Use those badges in Github readmes, etc. Examples Document

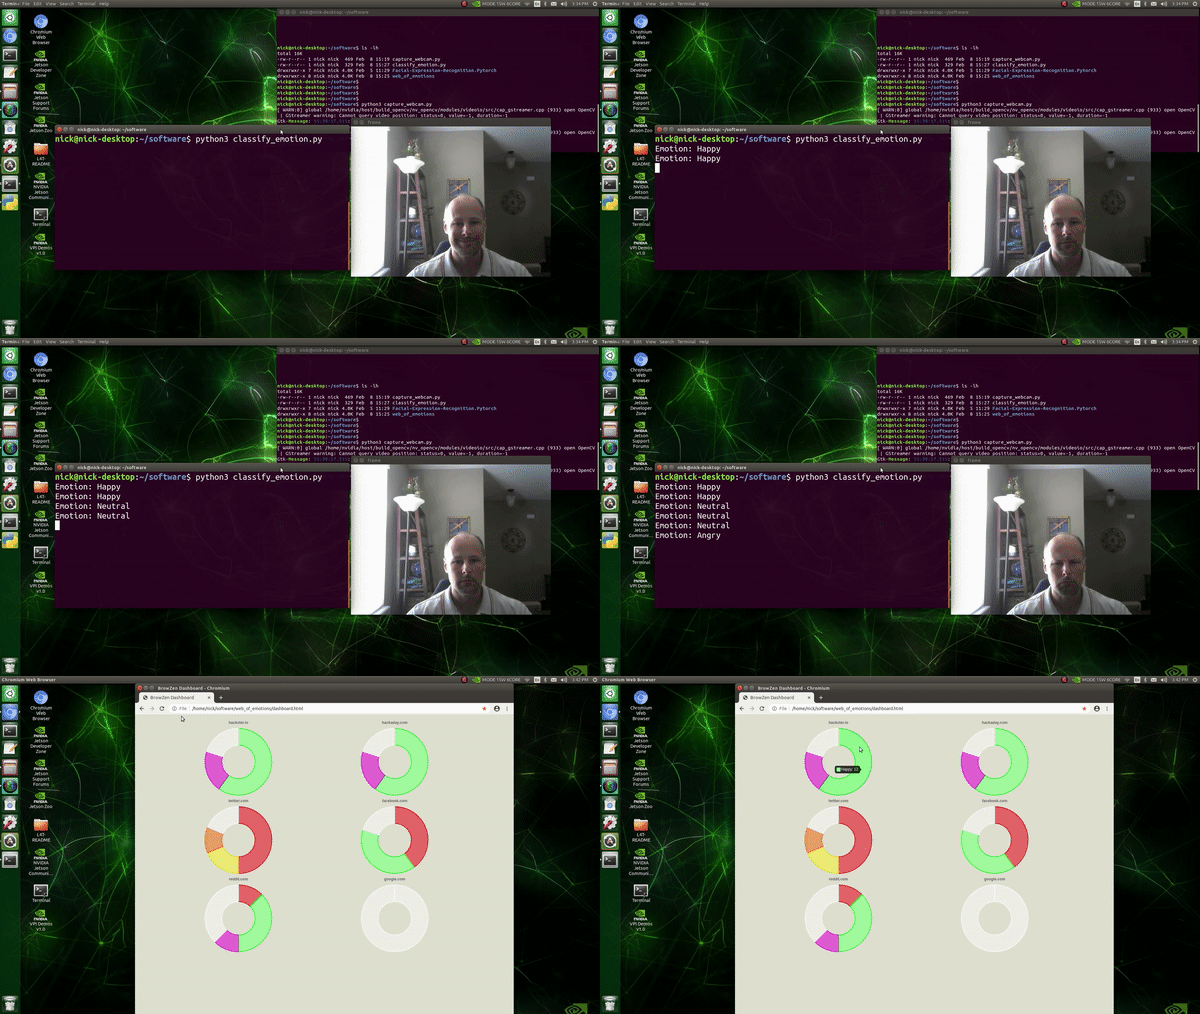
BrowZen correlates your emotional states with the web sites you visit to give you actionable insights about how you spend your time browsing the web.

BrowZen BrowZen correlates your emotional states with the web sites you visit to give you actionable insights about how you spend your time browsing t

An application that allows you to design and test your own stock trading algorithms in an attempt to beat the market.

StockBot is a Python application for designing and testing your own daily stock trading algorithms. Installation Use the

With Holoviews, your data visualizes itself.

HoloViews Stop plotting your data - annotate your data and let it visualize itself. HoloViews is an open-source Python library designed to make data a

With Holoviews, your data visualizes itself.

HoloViews Stop plotting your data - annotate your data and let it visualize itself. HoloViews is an open-source Python library designed to make data a

Releases(v0.2.0)
  • v0.2.0(Feb 15, 2022)

    New Features

    • f7650cb - Add support for adding custom hashtags to the tweet Now, you can add custom hashtags to your tweet. You need to define the hashtags in the workflow configuration file as a string.
            - uses: vchrombie/wordle-github-contributions@master
            with:
              HASHTAGS: 'wordle github contributions'
            env:
              GH_TOKEN: ${{ secrets.GITHUB_TOKEN }}
      

    Full Changelog: https://github.com/vchrombie/wordle-github-contributions/compare/v0.1.0...v0.2.0

    Source code(tar.gz)
    Source code(zip)
  • v0.1.0(Feb 14, 2022)

Owner
Venu Vardhan Reddy Tekula
Data Detective
Venu Vardhan Reddy Tekula
Simple implementation of Self Organizing Maps (SOMs) with rectangular and hexagonal grid topologies

py-self-organizing-map Simple implementation of Self Organizing Maps (SOMs) with rectangular and hexagonal grid topologies. A SOM is a simple unsuperv

Jonas Grebe 1 Feb 10, 2022
Generate visualizations of GitHub user and repository statistics using GitHub Actions.

GitHub Stats Visualization Generate visualizations of GitHub user and repository statistics using GitHub Actions. This project is currently a work-in-

JoelImgu 3 Dec 14, 2022
Generate visualizations of GitHub user and repository statistics using GitHub Actions.

GitHub Stats Visualization Generate visualizations of GitHub user and repository statistics using GitHub Actions. This project is currently a work-in-

Aditya Thakekar 1 Jan 11, 2022
GitHubPoster - Make everything a GitHub svg poster

GitHubPoster Make everything a GitHub svg poster 支持 Strava 开心词场 扇贝 Nintendo Switch GPX 多邻国 Issue

yihong 1.3k Jan 2, 2023
A simple script that displays pixel-based animation on GitHub Activity

GitHub Activity Animator This project contains a simple Javascript snippet that produces an animation on your GitHub activity tracker. The project als

null 16 Nov 15, 2021
paintable GitHub contribute table

githeart paintable github contribute table how to use: Functions key color select 1,2,3,4,5 clear c drawing mode mode on turn off e print paint matrix

Bahadır Araz 27 Nov 24, 2022
GitHub Stats Visualizations : Transparent

GitHub Stats Visualizations : Transparent Generate visualizations of GitHub user and repository statistics using GitHub Actions. ⚠️ Disclaimer The pro

YuanYap 7 Apr 5, 2022
An easy to use burndown chart generator for GitHub Project Boards.

Burndown Chart for GitHub Projects An easy to use burndown chart generator for GitHub Project Boards. Table of Contents Features Installation Assumpti

Joseph Hale 15 Dec 28, 2022
GitHub English Top Charts

Help you discover excellent English projects and get rid of the interference of other spoken language.

kon9chunkit 529 Jan 2, 2023
Generate SVG (dark/light) images visualizing (private/public) GitHub repo statistics for profile/website.

Generate daily updated visualizations of GitHub user and repository statistics from the GitHub API using GitHub Actions for any combination of private and public repositories, whether owned or contributed to - no server required.

Adam Ross 2 Dec 16, 2022