BrowZen correlates your emotional states with the web sites you visit to give you actionable insights about how you spend your time browsing the web.

Overview

BrowZen

BrowZen correlates your emotional states with the web sites you visit to give you actionable insights about how you spend your time browsing the web.

How It Works

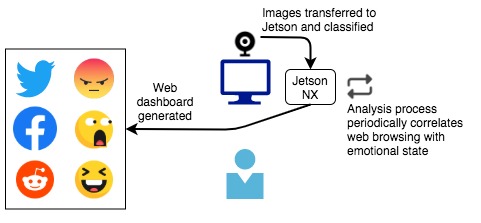
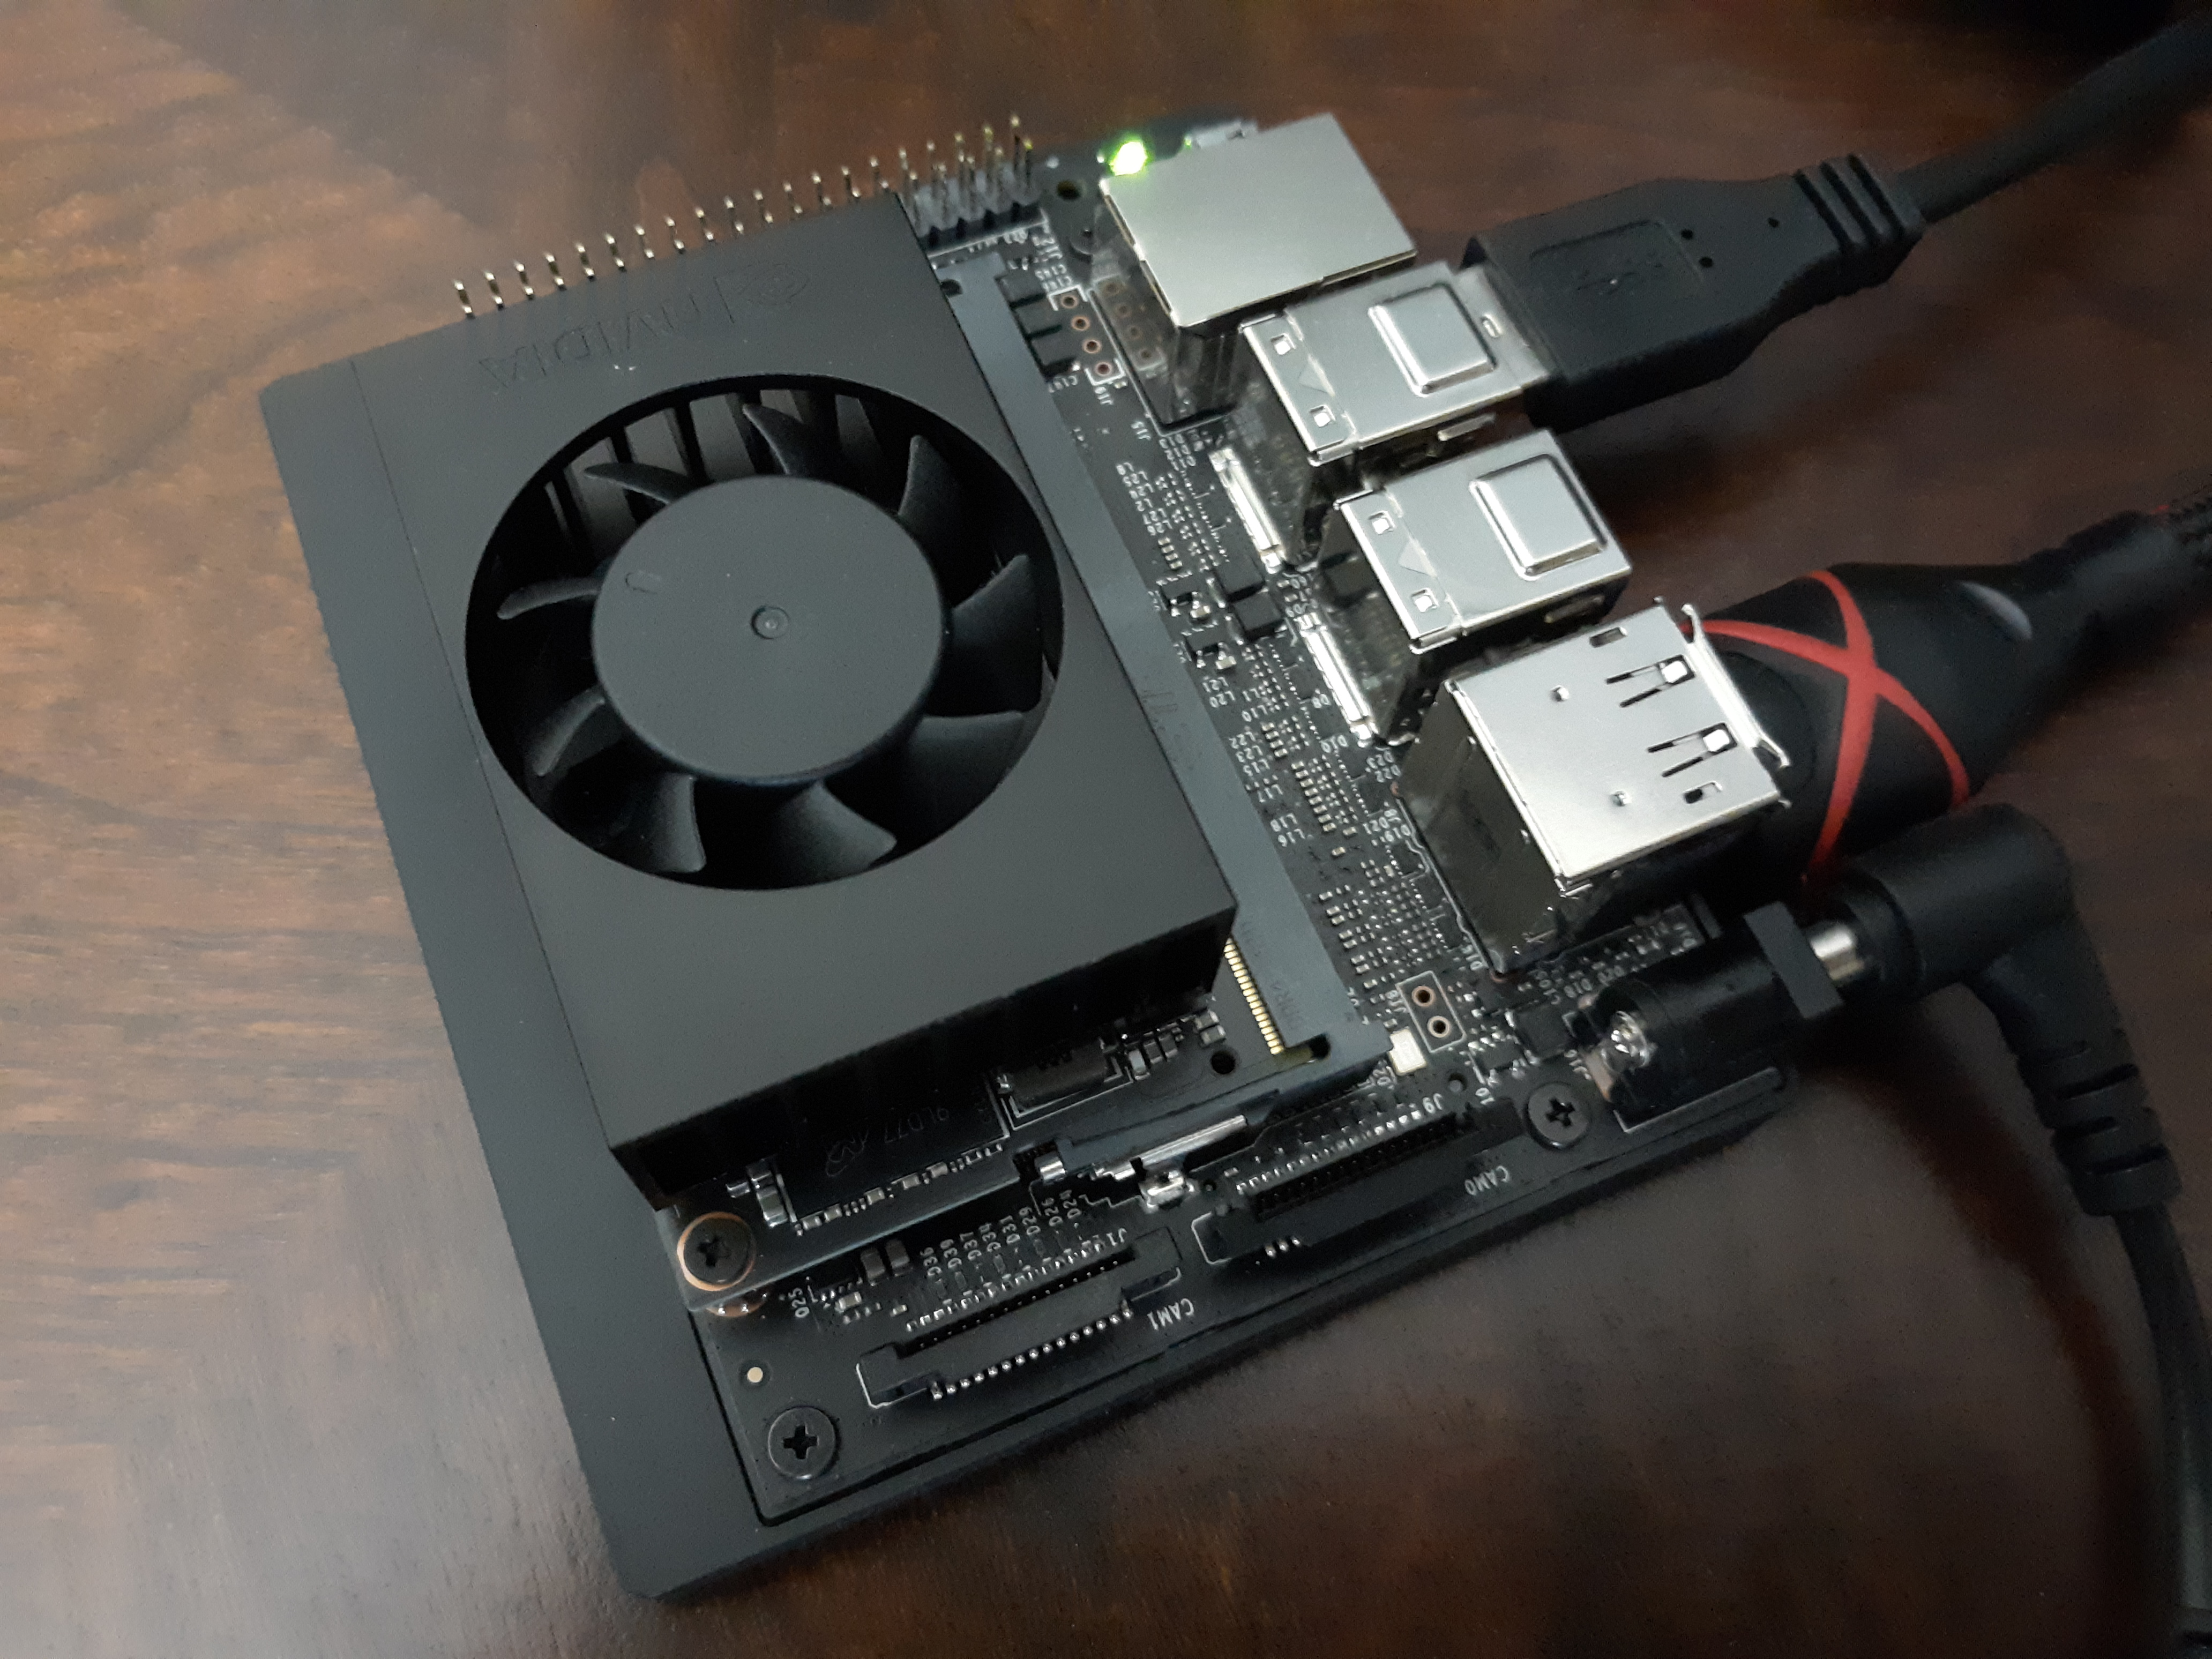
A webcam attached to an NVIDIA Jetson Xavier NX captures periodic images of the user of the computer as a background process. These images are classified (see classify_emotion.py) by a VGG19 convolutional neural network that has been pretrained to recognize seven emotional states ("Angry", "Disgust", "Fear", "Happy", "Sad", "Surprise", and "Neutral"). Observations (emotional state, datetime stamp) are recorded in an SQLite3 database. For privacy protection, images are destroyed after classification, and all processing takes place locally—nothing is sent to the cloud.

Next, analysis.py connects to the SQLite3 database that stores web history in Chrome/Chromium and correlates web site visit times with the database of emotional state observations created by the classification step. The result of the analysis, the sum of each emotional state observed while visiting each web site, is stored in an SQLite3 database table.

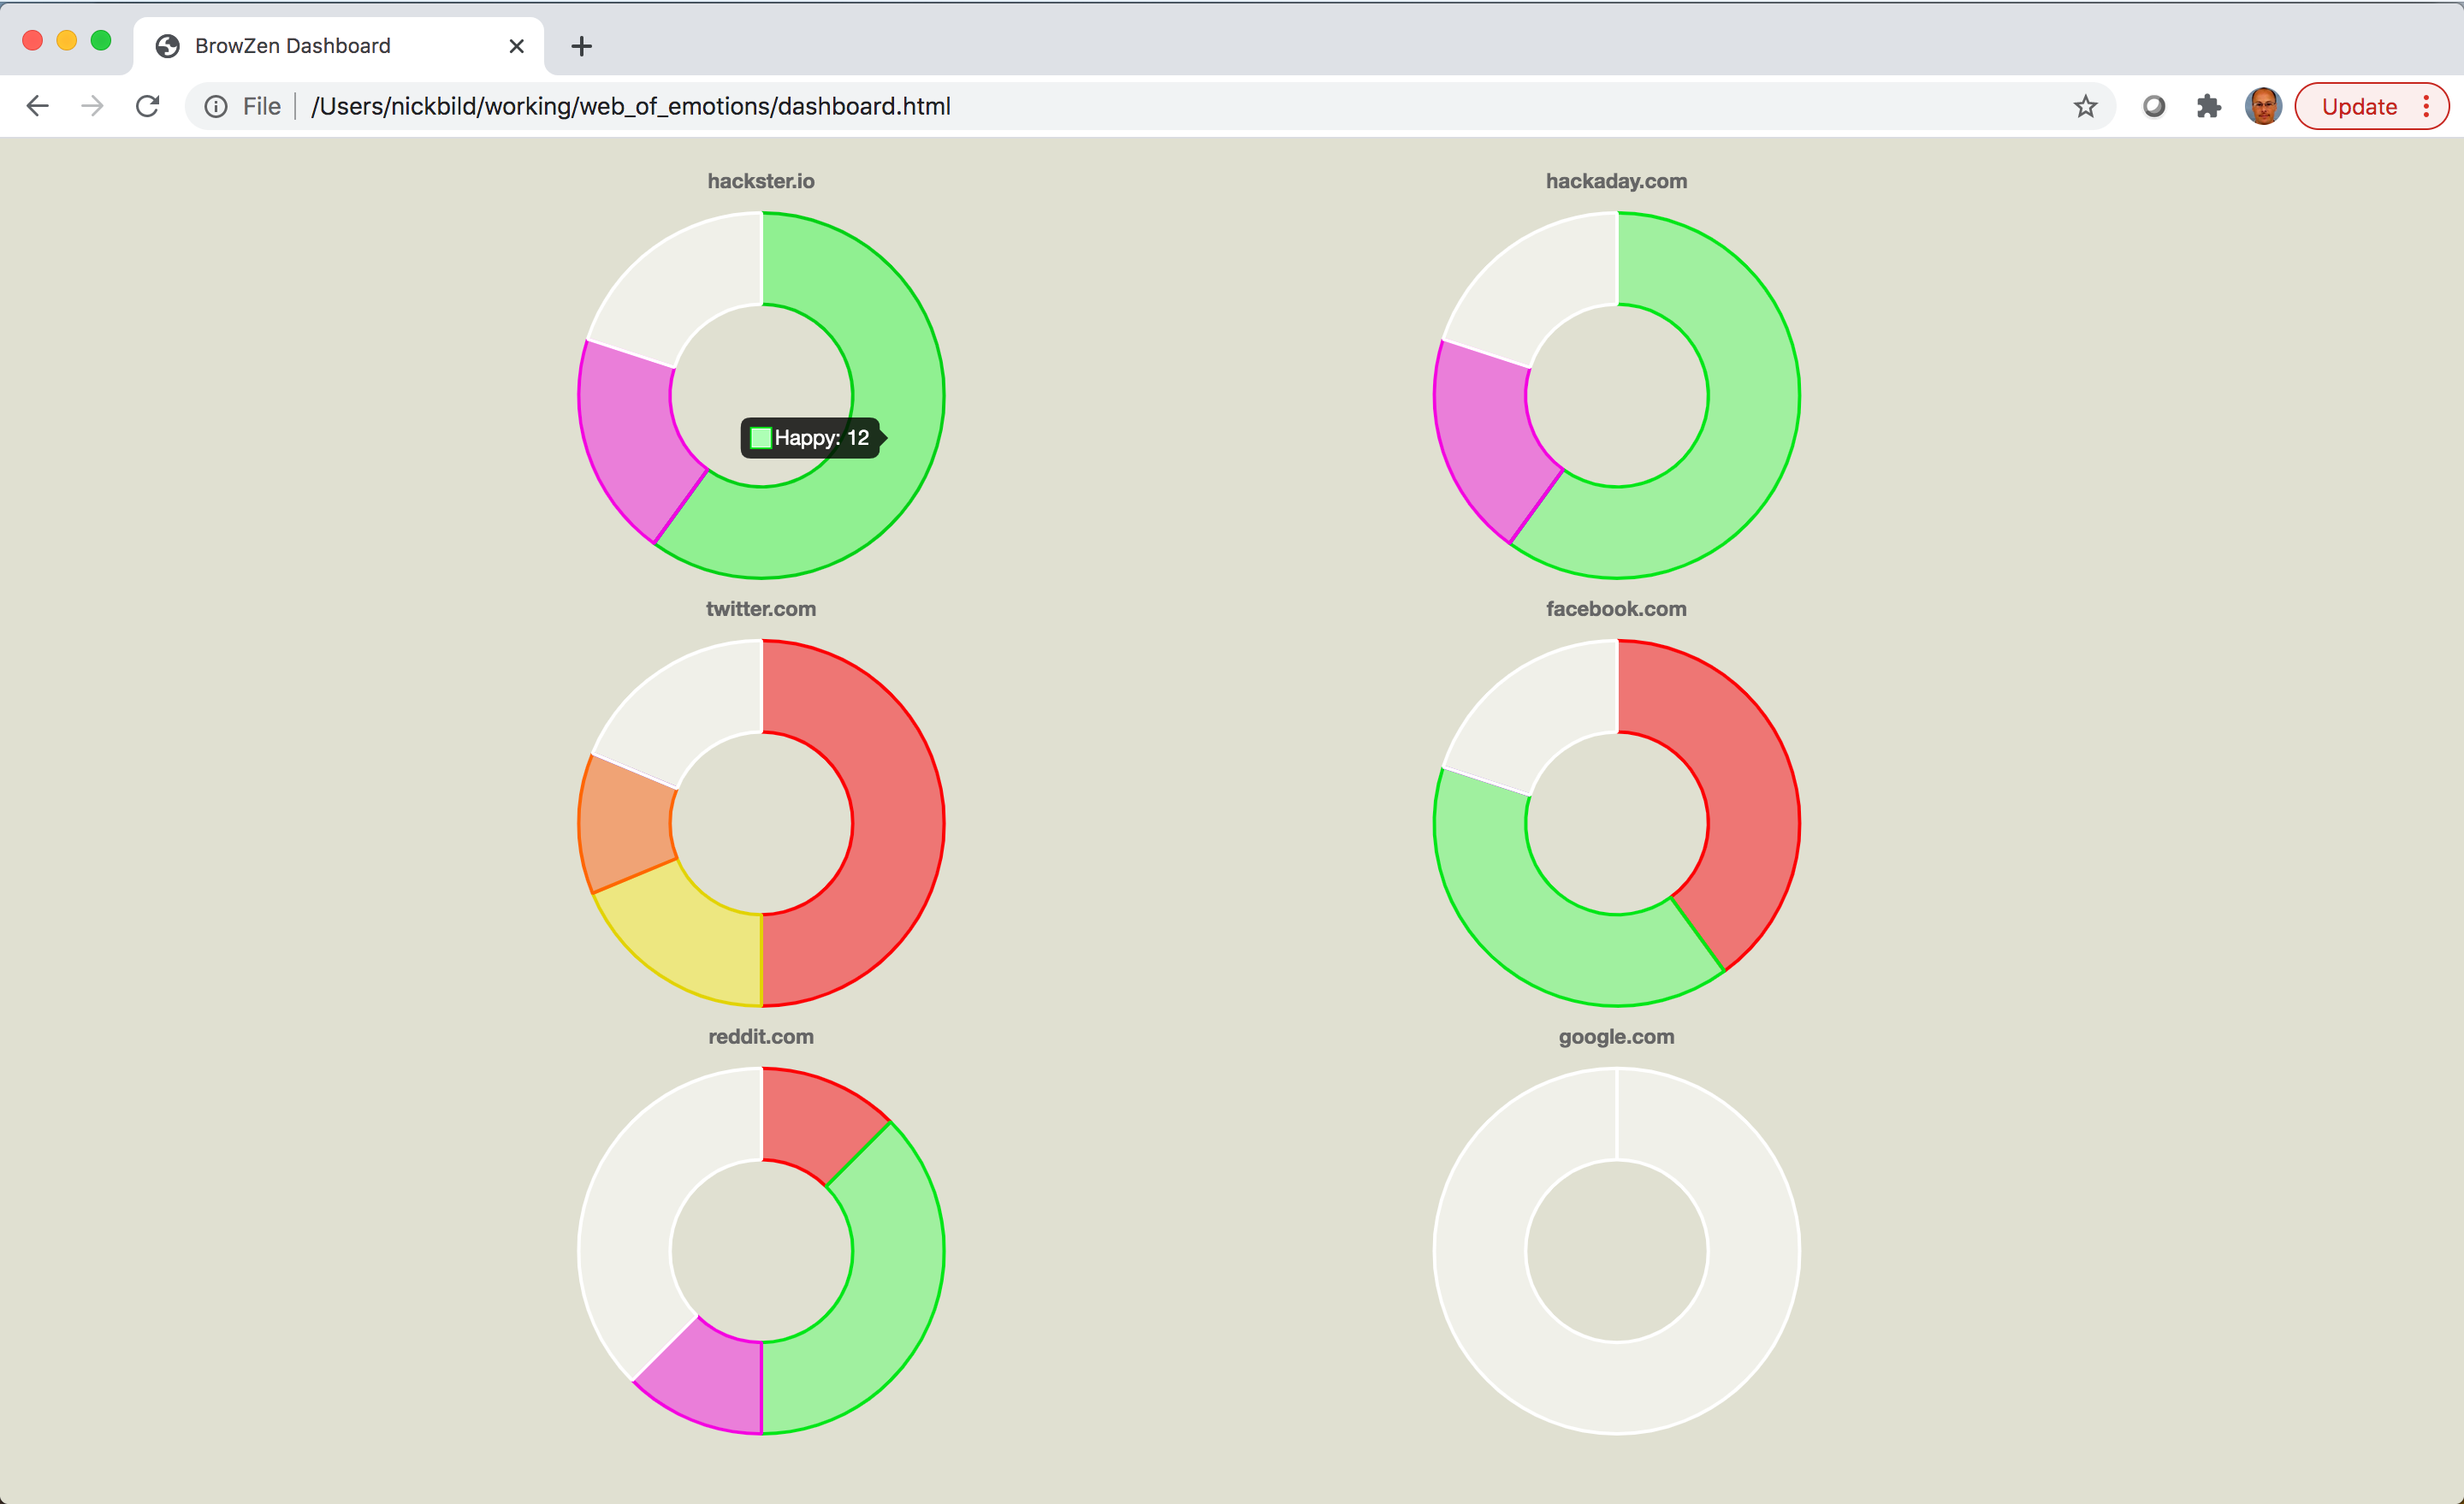
Finally, the analysis results are used to generate a web dashboard (generate_dashboard.py) to provide a simple way to visualize, on average, how each web site one visits impacts their emotional state. The web dashboard (dashboard.html) relies on only HTML5 and JavaScript.

Media

Demo Video: YouTube

The web dashboard, giving an overview of emotional reactions during visits to various websites (high resolution): Dashboard

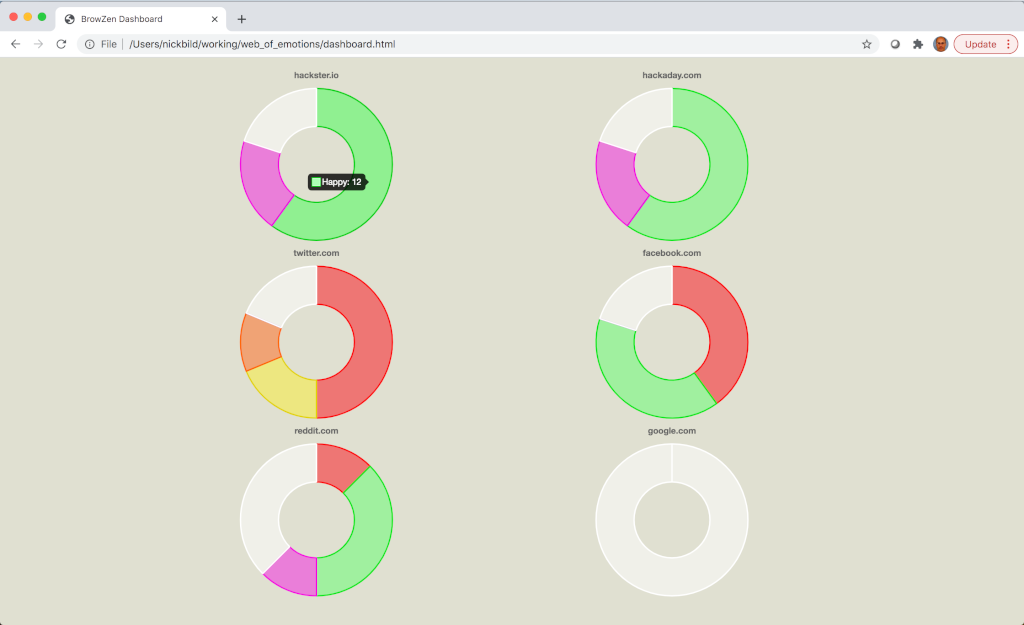
Classifying emotions in real-time (high resolution): Classification

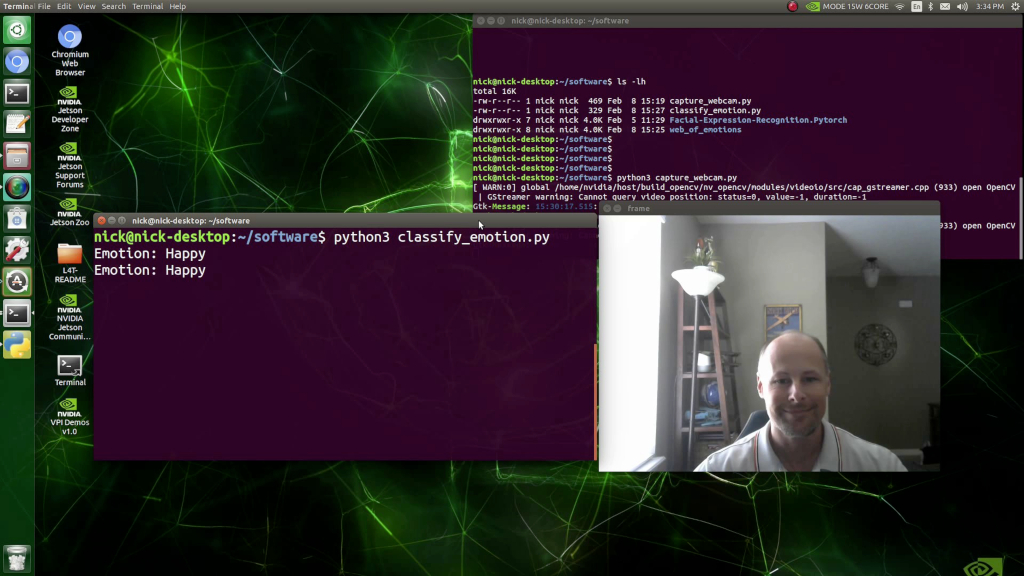
Jetson Xavier NX (high resolution): Jetson

Future Direction

It may be useful to create a browser plugin that displays a small, always-visible icon representing past emotions experienced when visiting the current website. This would serve as a quick reminder of past experiences that may modify current behavior.

I would like to also explore other areas, beyond web browsing, where this idea may be helpful.

Bill of Materials

  • 1 x NVIDIA Jetson Xavier NX
  • 1 x USB webcam

About the Author

Nick A. Bild, MS

You might also like...
Visualise Ansible execution time across playbooks, tasks, and hosts.

ansible-trace Visualise where time is spent in your Ansible playbooks: what tasks, and what hosts, so you can find where to optimise and decrease play

The Spectral Diagram (SD) is a new tool for the comparison of time series in the frequency domain

The Spectral Diagram (SD) is a new tool for the comparison of time series in the frequency domain. The SD provides a novel way to display the coherence function, power, amplitude, phase, and skill score of discrete frequencies of two time series. Each SD summarises these quantities in a single plot for multiple targeted frequencies.

Python ts2vg package provides high-performance algorithm implementations to build visibility graphs from time series data.

ts2vg: Time series to visibility graphs The Python ts2vg package provides high-performance algorithm implementations to build visibility graphs from t

Arras.io Highest Scores Over Time Bar Chart Race

Arras.io Highest Scores Over Time Bar Chart Race This repo contains a python script (make_racing_bar_chart.py) that can generate a csv file which can

Time series visualizer is a flexible extension that provides filling world map by country from real data.

Time-series-visualizer Time series visualizer is a flexible extension that provides filling world map by country from csv or json file. You can know d

Calendar heatmaps from Pandas time series data

Note: See MarvinT/calmap for the maintained version of the project. That is also the version that gets published to PyPI and it has received several f

Minimalistic tool to visualize how the routes to a given target domain change over time, feat. Python 3.10 & mermaid.js

Minimalistic tool to visualize how the routes to a given target domain change over time, feat. Python 3.10 & mermaid.js

LabGraph is a a Python-first framework used to build sophisticated research systems with real-time streaming, graph API, and parallelism.

LabGraph is a a Python-first framework used to build sophisticated research systems with real-time streaming, graph API, and parallelism.

Movies-chart - A CLI app gets the top 250 movies of all time from imdb.com and the top 100 movies from rottentomatoes.com

movies-chart This CLI app gets the top 250 movies of all time from imdb.com and

Owner
Nick Bild
R&D, creativity, and building the next big thing you never knew you wanted are my specialties.
Nick Bild
eoplatform is a Python package that aims to simplify Remote Sensing Earth Observation by providing actionable information on a wide swath of RS platforms and provide a simple API for downloading and visualizing RS imagery

An Earth Observation Platform Earth Observation made easy. Report Bug | Request Feature About eoplatform is a Python package that aims to simplify Rem

Matthew Tralka 4 Aug 11, 2022
Profile and test to gain insights into the performance of your beautiful Python code

Profile and test to gain insights into the performance of your beautiful Python code View Demo - Report Bug - Request Feature QuickPotato in a nutshel

Joey Hendricks 138 Dec 6, 2022
A Python toolbox for gaining geometric insights into high-dimensional data

"To deal with hyper-planes in a 14 dimensional space, visualize a 3D space and say 'fourteen' very loudly. Everyone does it." - Geoff Hinton Overview

Contextual Dynamics Laboratory 1.8k Dec 29, 2022
A Python toolbox for gaining geometric insights into high-dimensional data

"To deal with hyper-planes in a 14 dimensional space, visualize a 3D space and say 'fourteen' very loudly. Everyone does it." - Geoff Hinton Overview

Contextual Dynamics Laboratory 1.6k Feb 17, 2021
Friday Night Funkin - converts a chart from 4/4 time to 6/8 time, or from regular to swing tempo.

Chart to swing converter As seen in https://twitter.com/i_winxd/status/1462220493558366214 A program written in python that converts a chart from 4/4

null 5 Dec 23, 2022
Project coded in Python using Pandas to look at changes in chase% for batters facing a pitcher first time through the order vs. thrid time

Project coded in Python using Pandas to look at changes in chase% for batters facing a pitcher first time through the order vs. thrid time

Jason Kraynak 1 Jan 7, 2022
This plugin plots the time you spent on a tag as a histogram.

This plugin plots the time you spent on a tag as a histogram.

Tom Dörr 7 Sep 9, 2022
Show Data: Show your dataset in web browser!

Show Data is to generate html tables for large scale image dataset, especially for the dataset in remote server. It provides some useful commond line tools and fully customizeble API reference to generate html table different tasks.

Dechao Meng 83 Nov 26, 2022
Smoking Simulation is an app to simulate the spreading of smokers and non-smokers, their interactions and population during certain amount of time.

Smoking Simulation is an app to simulate the spreading of smokers and non-smokers, their interactions and population during certain

Bohdan Ruban 5 Nov 8, 2022
A minimalistic wrapper around PyOpenGL to save development time

glpy glpy is pyOpenGl wrapper which lets you work with pyOpenGl easily.It is not meant to be a replacement for pyOpenGl but runs on top of pyOpenGl to

Abhinav 9 Apr 2, 2022