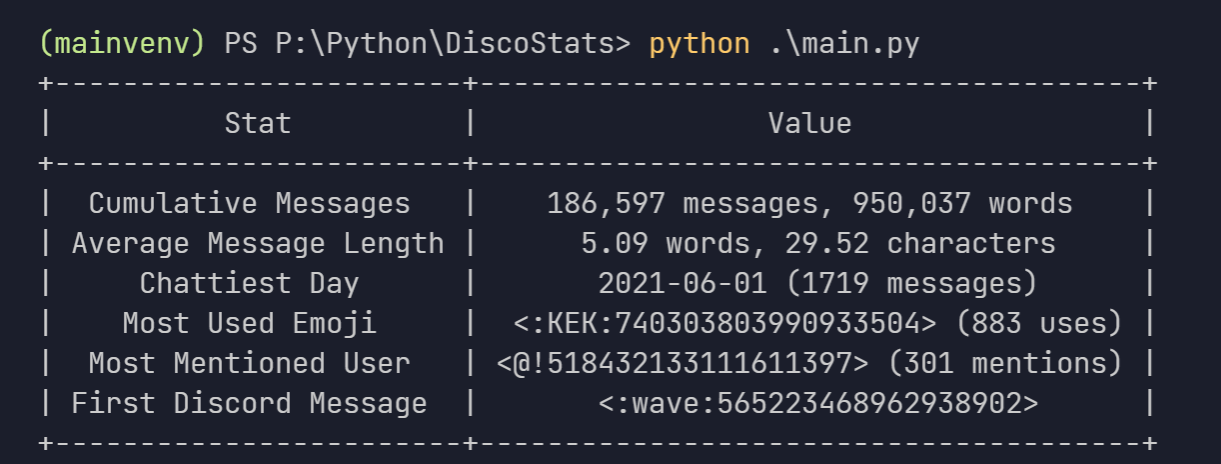
view cool stats related to your discord account.

Overview

DiscoStats

cool statistics generated using your discord data.

image

How?

DiscoStats is not a service that breaks the Discord Terms of Service or Community Guidelines. Discord has an option to request data which is what this entire application is based upon. It just scans through the lines of text of every message you have ever sent and generates statistics based upon that. As a forewarning, you need to request your data to use the application, which could potentially take up to 30 days.

Installation

⚠️ make sure you have python 3.7+ installed.

  • Clone the repository:
git clone https://github.com/ibra/DiscoStats
  • Install the dependencies:
pip install -r requirements.txt
  • Move your discord data inside the project directory, make sure it is all dumped under one "package" folder.
  • run main file:
python main.py  
  • optionally use the --dir flag to pinpoint the package location to a specific directory:
python main.py --dir otherFolder/package

Known Limitations

  • the name of servers, channels, users etc. cannot be displayed as there is no way to do that without having a bot or some sort of authorization within the server itself
  • the names of the emojis alone cannot be used because there could be conflicts between different servers, so its more convenient for them to be displayed in the <:Emoji:12345678910> format.
You might also like...
With Holoviews, your data visualizes itself.

HoloViews Stop plotting your data - annotate your data and let it visualize itself. HoloViews is an open-source Python library designed to make data a

With Holoviews, your data visualizes itself.

HoloViews Stop plotting your data - annotate your data and let it visualize itself. HoloViews is an open-source Python library designed to make data a

Design your own matplotlib stylefile interactively

Tired of playing with font sizes and other matplotlib parameters every time you start a new project or write a new plotting function? Want all you plots have the same style? Use matplotlib configuration files!

 Show Data: Show your dataset in web browser!
Show Data: Show your dataset in web browser!

Show Data is to generate html tables for large scale image dataset, especially for the dataset in remote server. It provides some useful commond line tools and fully customizeble API reference to generate html table different tasks.

Visualize the bitcoin blockchain from your local node

Project Overview A new feature in Bitcoin Core 0.20 allows users to dump the state of the blockchain (the UTXO set) using the command dumptxoutset. I'

A simple python tool for explore your object detection dataset

A simple tool for explore your object detection dataset. The goal of this library is to provide simple and intuitive visualizations from your dataset and automatically find the best parameters for generating a specific grid of anchors that can fit you data characteristics

Extract data from ThousandEyes REST API and visualize it on your customized Grafana Dashboard.

ThousandEyes Grafana Dashboard Extract data from the ThousandEyes REST API and visualize it on your customized Grafana Dashboard. Deploy Grafana, Infl

termplotlib is a Python library for all your terminal plotting needs.

termplotlib termplotlib is a Python library for all your terminal plotting needs. It aims to work like matplotlib. Line plots For line plots, termplot

Make your BSC transaction simple.

bsc_trade_history Make your BSC transaction simple. 中文ReadMe Background: inspired by debank ,Practice my hands on this small project Blog:Crypto-BscTr

Comments
  • replies count towards message statistics

    replies count towards message statistics

    the discord data provided by discord also includes replies including their content within the messages.csv files. replies need to be ignored for message statistics as they interfere with the results.

    bug 
    opened by ibra 0
  • first message sent

    first message sent

    The current first message sent statistic is wrong so its been removed for now, the messages array needs to be sorted by date and then the first message needs to then be extracted from that

    bug 
    opened by ibra 0
Owner
ibrahim hisham
student, programmer & hobbyist indie game developer
ibrahim hisham
Peloton Stats to Google Sheets with Data Visualization through Seaborn and Plotly

Peloton Stats to Google Sheets with Data Visualization through Seaborn and Plotly Problem: 2 peloton users were looking for a way to track their metri

null 9 Jul 22, 2022
Create Badges with stats of Scratch User, Project and Studio. Use those badges in Github readmes, etc.

Scratch-Stats-Badge Create customized Badges with stats of Scratch User, Studio or Project. Use those badges in Github readmes, etc. Examples Document

Siddhesh Chavan 5 Aug 28, 2022
Generate a roam research like Network Graph view from your Notion pages.

Notion Graph View Export Notion pages to a Roam Research like graph view.

Steve Sun 214 Jan 7, 2023
View part of your screen in grayscale or simulated color vision deficiency.

monolens View part of your screen in grayscale or filtered to simulate color vision deficiency. Watch the demo on YouTube. Install with pip install mo

Hans Dembinski 31 Oct 11, 2022
Collection of scripts for making high quality beautiful math-related posters.

Poster Collection of scripts for making high quality beautiful math-related posters. The poster can have as large printing size as 3x2 square feet wit

Nattawut Phetmak 3 Jun 9, 2022
Python scripts for plotting audiograms and related data from Interacoustics Equinox audiometer and Otoaccess software.

audiometry Python scripts for plotting audiograms and related data from Interacoustics Equinox 2.0 audiometer and Otoaccess software. Maybe similar sc

Hamilton Lab at UT Austin 2 Jun 15, 2022
Blender addon that creates a temporary window of any type from the 3D View.

CreateTempWindow2.8 Blender addon that creates a temporary window of any type from the 3D View. Features Can the following window types: 3D View Graph

null 3 Nov 27, 2022
BrowZen correlates your emotional states with the web sites you visit to give you actionable insights about how you spend your time browsing the web.

BrowZen BrowZen correlates your emotional states with the web sites you visit to give you actionable insights about how you spend your time browsing t

Nick Bild 36 Sep 28, 2022
An application that allows you to design and test your own stock trading algorithms in an attempt to beat the market.

StockBot is a Python application for designing and testing your own daily stock trading algorithms. Installation Use the

Ryan Cullen 280 Dec 19, 2022
With Holoviews, your data visualizes itself.

HoloViews Stop plotting your data - annotate your data and let it visualize itself. HoloViews is an open-source Python library designed to make data a

HoloViz 2.3k Jan 2, 2023