46 Repositories
Python visualizing Libraries

Jupyter Dock is a set of Jupyter Notebooks for performing molecular docking protocols interactively, as well as visualizing, converting file formats and analyzing the results.
Molecular Docking integrated in Jupyter Notebooks Description | Citation | Installation | Examples | Limitations | License Table of content Descriptio
For visualizing the dair-v2x-i dataset
3D Detection & Tracking Viewer The project is based on hailanyi/3D-Detection-Tracking-Viewer and is modified, you can find the original version of the

A python package for generating, analyzing and visualizing building shadows
pybdshadow Introduction pybdshadow is a python package for generating, analyzing and visualizing building shadows from large scale building geographic

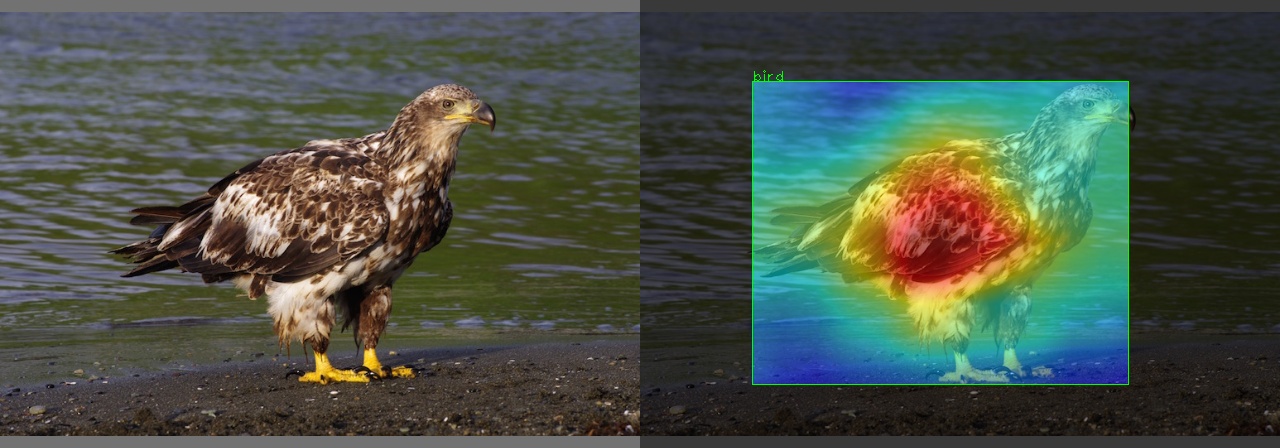
Visualizing Yolov5's layers using GradCam
YOLO-V5 GRADCAM I constantly desired to know to which part of an object the object-detection models pay more attention. So I searched for it, but I di
Backend app for visualizing CANedge log files in Grafana (directly from local disk or S3)
CANedge Grafana Backend - Visualize CAN/LIN Data in Dashboards This project enables easy dashboard visualization of log files from the CANedge CAN/LIN

Interactive Dashboard for Visualizing OSM Data Change
Dashboard and intuitive data downloader for more interactive experience with interpreting osm change data.

Collection of data visualizing projects through Tableau, Data Wrapper, and Power BI
Data-Visualization-Projects Collection of data visualizing projects through Tableau, Data Wrapper, and Power BI Indigenous-Brands-Social-Movements Pyt
Curvipy - The Python package for visualizing curves and linear transformations in a super simple way
Curvipy - The Python package for visualizing curves and linear transformations in a super simple way
Pydrawer: The Python package for visualizing curves and linear transformations in a super simple way
pydrawer 📐 The Python package for visualizing curves and linear transformations in a super simple way. ✏️ Installation Install pydrawer package with

Visualizing lattice vibration information from phonon dispersion to atoms (For GPUMD)
Phonon-Vibration-Viewer (For GPUMD) Visualizing lattice vibration information from phonon dispersion for primitive atoms. In this tutorial, we will in
Generate SVG (dark/light) images visualizing (private/public) GitHub repo statistics for profile/website.
Generate daily updated visualizations of GitHub user and repository statistics from the GitHub API using GitHub Actions for any combination of private and public repositories, whether owned or contributed to - no server required.
Bunch of different tools which helps visualizing and annotating images for semantic/instance segmentation tasks
Data Framework for Semantic/Instance Segmentation Bunch of different tools which helps visualizing, transforming and annotating images for semantic/in

Client - 🔥 A tool for visualizing and tracking your machine learning experiments
Weights and Biases Use W&B to build better models faster. Track and visualize all the pieces of your machine learning pipeline, from datasets to produ

Visualizing and learning from games on chess.com
Better Your Chess What for? This project aims to help you learn from all the chess games you've played online, starting with a simple way to download
The official repository for ROOT: analyzing, storing and visualizing big data, scientifically
About The ROOT system provides a set of OO frameworks with all the functionality needed to handle and analyze large amounts of data in a very efficien

Tools for calculating and visualizing Elo-like ratings of MLB teams using Retosheet data
Overview This project uses historical baseball games data to calculate an Elo-like rating for MLB teams based on regular season match ups. The Elo rat

yt is an open-source, permissively-licensed Python library for analyzing and visualizing volumetric data.
The yt Project yt is an open-source, permissively-licensed Python library for analyzing and visualizing volumetric data. yt supports structured, varia

Visualizing weather changes across the world using third party APIs and Python.
WEATHER FORECASTING ACROSS THE WORLD Overview Python scripts were created to visualize the weather for over 500 cities across the world at varying di

A python-generated website for visualizing the novel coronavirus (COVID-19) data for Greece.
COVID-19-Greece A python-generated website for visualizing the novel coronavirus (COVID-19) data for Greece. Data sources Data provided by Johns Hopki

Python toolkit for defining+simulating+visualizing+analyzing attractors, dynamical systems, iterated function systems, roulette curves, and more
Attractors A small module that provides functions and classes for very efficient simulation and rendering of iterated function systems; dynamical syst
Code for paper "Do Language Models Have Beliefs? Methods for Detecting, Updating, and Visualizing Model Beliefs"
This is the codebase for the paper: Do Language Models Have Beliefs? Methods for Detecting, Updating, and Visualizing Model Beliefs Directory Structur
Code for paper "Do Language Models Have Beliefs? Methods for Detecting, Updating, and Visualizing Model Beliefs"
This is the codebase for the paper: Do Language Models Have Beliefs? Methods for Detecting, Updating, and Visualizing Model Beliefs Directory Structur

An implementation of the largeVis algorithm for visualizing large, high-dimensional datasets, for R
largeVis This is an implementation of the largeVis algorithm described in (https://arxiv.org/abs/1602.00370). It also incorporates: A very fast algori
UNAVOIDS: Unsupervised and Nonparametric Approach for Visualizing Outliers and Invariant Detection Scoring
UNAVOIDS: Unsupervised and Nonparametric Approach for Visualizing Outliers and Invariant Detection Scoring Code Summary aggregate.py: this script aggr

A python program for visualizing MIDI files, and displaying them in a spiral layout
SpiralMusic_python A python program for visualizing MIDI files, and displaying them in a spiral layout For a hardware version using Teensy & LED displ

Super simple bar charts for django admin list views visualizing the number of objects based on date_hierarchy using Chart.js.
Super simple bar charts for django admin list views visualizing the number of objects based on date_hierarchy using Chart.js.

Python package for visualizing the loss landscape of parameterized quantum algorithms.
orqviz A Python package for easily visualizing the loss landscape of Variational Quantum Algorithms by Zapata Computing Inc. orqviz provides a collect

MetPy is a collection of tools in Python for reading, visualizing and performing calculations with weather data.
MetPy MetPy is a collection of tools in Python for reading, visualizing and performing calculations with weather data. MetPy follows semantic versioni
The Timescale NFT Starter Kit is a step-by-step guide to get up and running with collecting, storing, analyzing and visualizing NFT data from OpenSea, using PostgreSQL and TimescaleDB.
Timescale NFT Starter Kit The Timescale NFT Starter Kit is a step-by-step guide to get up and running with collecting, storing, analyzing and visualiz

A command line tool for visualizing CSV/spreadsheet-like data
PerfPlotter Read data from CSV files using pandas and generate interactive plots using bokeh, which can then be embedded into HTML pages and served by

Leyna's Visualizing Data With Python
Leyna's Visualizing Data Below is information on the number of bilingual students in three school districts in Massachusetts. You will also find infor

HW 2: Visualizing interesting datasets
HW 2: Visualizing interesting datasets Check out the project instructions here! Mean Earnings per Hour for Males and Females My first graph uses data
.jpg)
Keir&'s Visualizing Data on Life Expectancy
Keir's Visualizing Data on Life Expectancy Below is information on life expectancy in the United States from 1900-2017. You will also find information

HM02: Visualizing Interesting Datasets
HM02: Visualizing Interesting Datasets This is a homework assignment for CSCI 40 class at Claremont McKenna College. Go to the project page to learn m

eoplatform is a Python package that aims to simplify Remote Sensing Earth Observation by providing actionable information on a wide swath of RS platforms and provide a simple API for downloading and visualizing RS imagery
An Earth Observation Platform Earth Observation made easy. Report Bug | Request Feature About eoplatform is a Python package that aims to simplify Rem

Code for visualizing the loss landscape of neural nets
Visualizing the Loss Landscape of Neural Nets This repository contains the PyTorch code for the paper Hao Li, Zheng Xu, Gavin Taylor, Christoph Studer

Improving Contrastive Learning by Visualizing Feature Transformation, ICCV 2021 Oral
Improving Contrastive Learning by Visualizing Feature Transformation This project hosts the codes, models and visualization tools for the paper: Impro

Code for visualizing the loss landscape of neural nets
Visualizing the Loss Landscape of Neural Nets This repository contains the PyTorch code for the paper Hao Li, Zheng Xu, Gavin Taylor, Christoph Studer
A Python library for reading, writing and visualizing the OMEGA Format
A Python library for reading, writing and visualizing the OMEGA Format, targeted towards storing reference and perception data in the automotive context on an object list basis with a focus on an urban use case.
Code for CVPR2021 "Visualizing Adapted Knowledge in Domain Transfer". Visualization for domain adaptation. #explainable-ai
Visualizing Adapted Knowledge in Domain Transfer @inproceedings{hou2021visualizing, title={Visualizing Adapted Knowledge in Domain Transfer}, auth
A single Python file with some tools for visualizing machine learning in the terminal.
Machine Learning Visualization Tools A single Python file with some tools for visualizing machine learning in the terminal. This demo is composed of t

A module for solving and visualizing Schrödinger equation.
qmsolve This is an attempt at making a solid, easy to use solver, capable of solving and visualize the Schrödinger equation for multiple particles, an

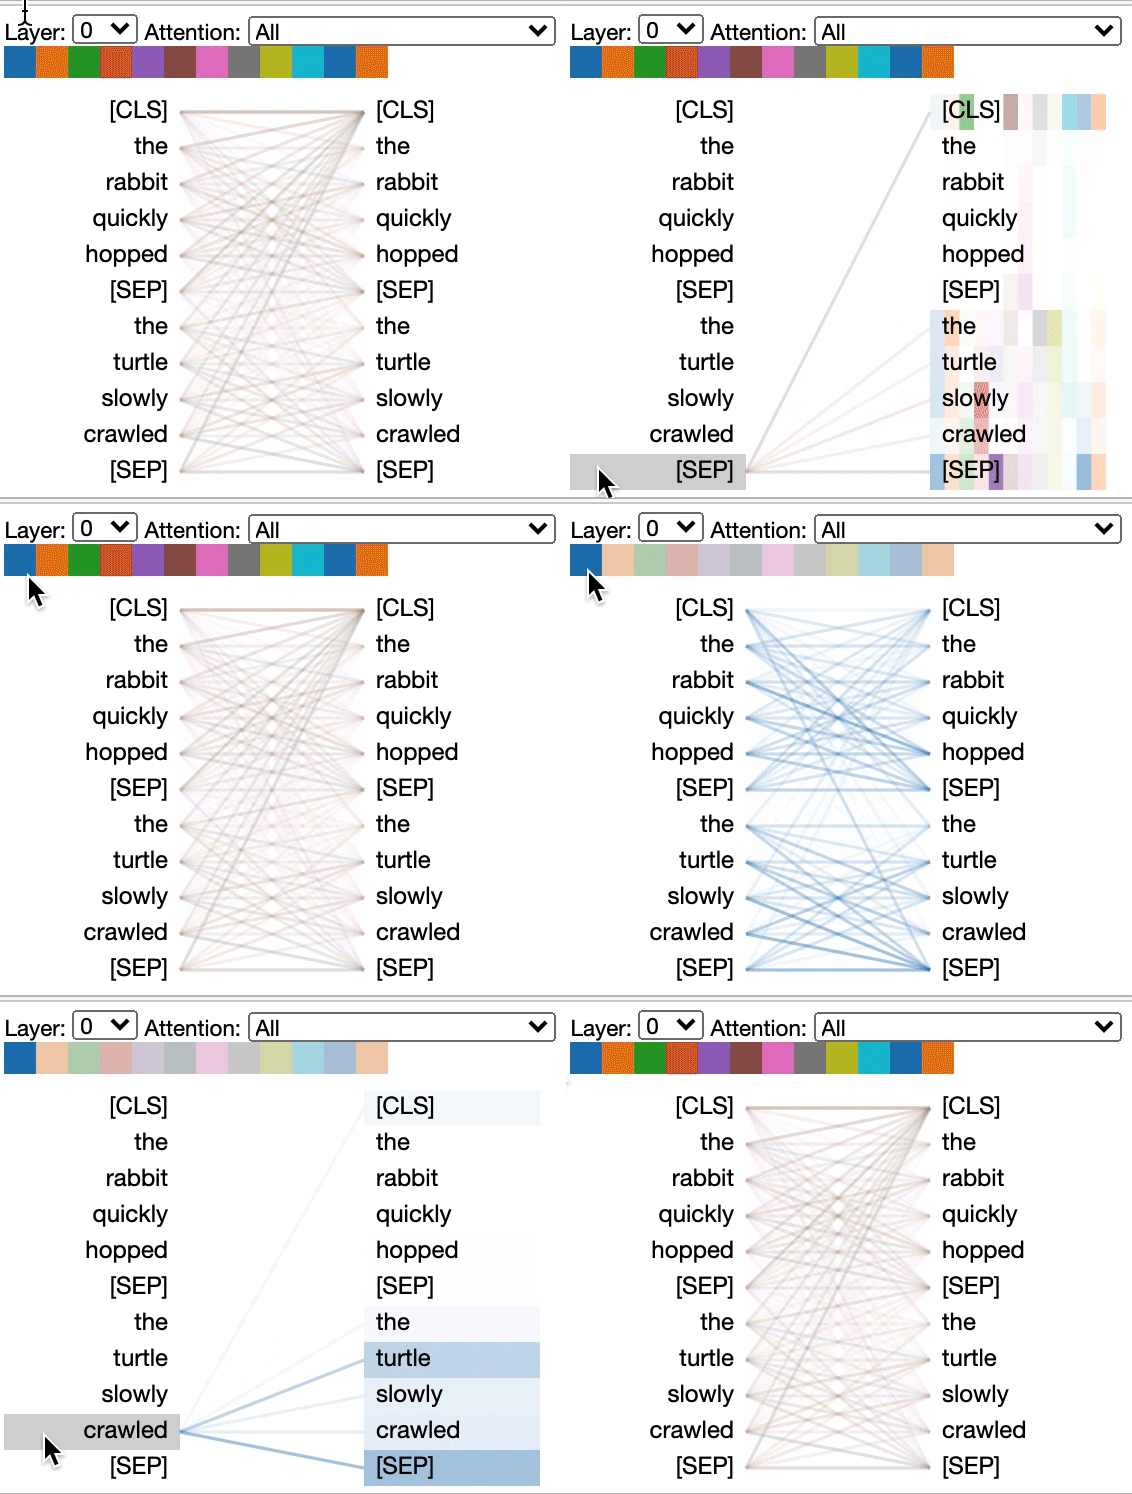
Tool for visualizing attention in the Transformer model (BERT, GPT-2, Albert, XLNet, RoBERTa, CTRL, etc.)
Tool for visualizing attention in the Transformer model (BERT, GPT-2, Albert, XLNet, RoBERTa, CTRL, etc.)
python toolbox for visualizing geographical data and making maps
geoplotlib is a python toolbox for visualizing geographical data and making maps data = read_csv('data/bus.csv') geoplotlib.dot(data) geoplotlib.show(

Your interactive network visualizing dashboard
Your interactive network visualizing dashboard Documentation: Here What is Jaal Jaal is a python based interactive network visualizing tool built usin
Simple tools for logging and visualizing, loading and training
TNT TNT is a library providing powerful dataloading, logging and visualization utilities for Python. It is closely integrated with PyTorch and is desi