Analysis and plotting for motor/prop/ESC characterization, thrust vs RPM and torque vs thrust

Overview

esc_test

This is a Python package used to plot and analyze data collected for the purpose of characterizing a particular propeller, motor, and ESC configuration (e.g. for quadrotors).

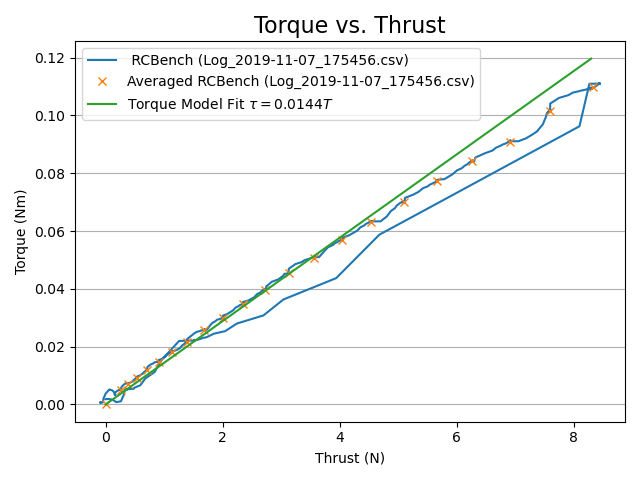
main.py computes two models:

  • a quadratic model describing thrust as a function of motor RPM
  • a linear model describing torque as a function of thrust

The data sources currently supported are:

Additional sources can be used by adding an appropriate class to formats.py.

Sample data from 6 tests is included, all with the three-bladed 7-inch DALPROP T7056.

  • ESC32v3 with T-Motor F40 Pro III 1600 kv (esc32v3-f40)
  • Kotleta 20 with F60 Pro II 1750 kv (duty cycle commands, kotleta-f60-duty)
  • Kotleta 20 with F60 Pro II 1750 kv (closed-loop RPM commands, kotleta-f60-rpm)
  • ESC32v3 with F60 Pro II 1750 kv (esc32v3-f60)
  • ESC32v2 with F60 Pro II 1750 kv (esc32v2-f60)
  • Aikon BLHeli32 4-in-1 with F80 Pro 1900 kv (aikon-f80)

You can add your own data by editing tests_sample.py or creating Test objects and adding them to tests.py.

The relationship between RPM and thrust should really only be a function of the propeller and it should be independent of the ESC and motor. So for all six tests above, the RPM to thrust curves should be fairly similar. However, the command and voltage to RPM (and thus to thrust) relationship will depend on the ESC and motor as well.

Written with the help of Xuning Yang.

Usage

Dependencies are numpy, scipy, and matplotlib.

Run python main.py where TEST is a test name found in tests_sample.py.

Run python main.py --help to see additional options. In particular, --plot-debug can be used to plot additional intermediate quantities used in the model computation and --plot-extra will plot additional measurements that may be interesting.

plot_rpm_thrust.py is a helper script to compare motor thrust models from different tests.
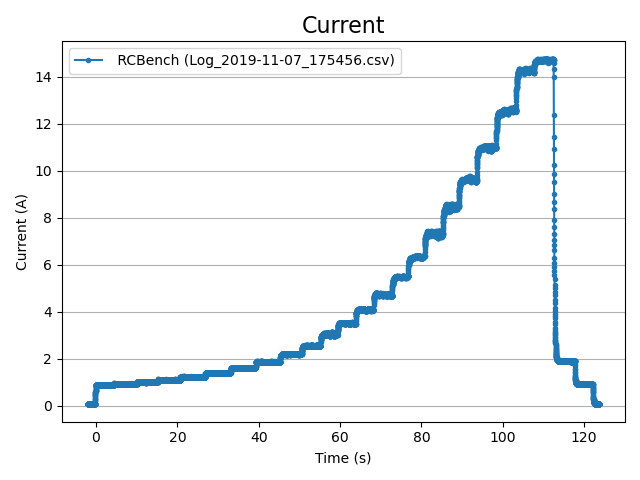
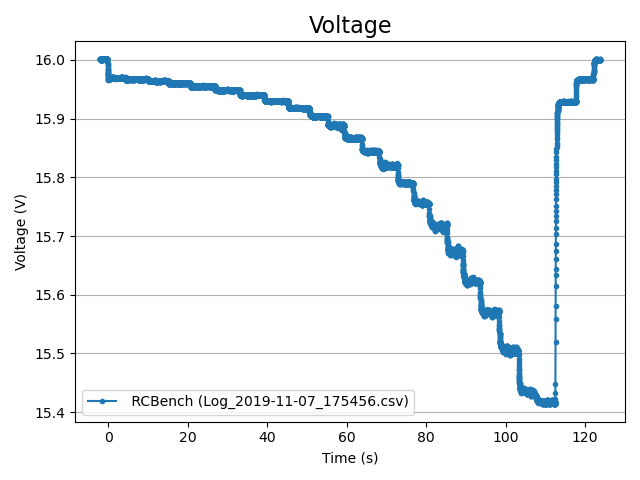
Sample Output

Plots can be optionally saved to the media folder by passing --save to main.py.

Current from kotleta-f60-rpm Voltage from kotleta-f60-rpm Thrust model from kotleta-f60-rpm Torque model from kotleta-f60-rpm

You might also like...
Plotting library for IPython/Jupyter notebooks

bqplot 2-D plotting library for Project Jupyter Introduction bqplot is a 2-D visualization system for Jupyter, based on the constructs of the Grammar

Simple plotting for Python. Python wrapper for D3xter - render charts in the browser with simple Python syntax.

PyDexter Simple plotting for Python. Python wrapper for D3xter - render charts in the browser with simple Python syntax. Setup $ pip install PyDexter

An intuitive library to add plotting functionality to scikit-learn objects.

Welcome to Scikit-plot Single line functions for detailed visualizations The quickest and easiest way to go from analysis... ...to this. Scikit-plot i

🎨 Python3 binding for `@AntV/G2Plot` Plotting Library .

PyG2Plot 🎨 Python3 binding for @AntV/G2Plot which an interactive and responsive charting library. Based on the grammar of graphics, you can easily ma

NorthPitch is a python soccer plotting library that sits on top of Matplotlib

NorthPitch is a python soccer plotting library that sits on top of Matplotlib.

matplotlib: plotting with Python

Matplotlib is a comprehensive library for creating static, animated, and interactive visualizations in Python. Check out our home page for more inform

🎨 Python Echarts Plotting Library

pyecharts Python ❤️ ECharts = pyecharts English README 📣 简介 Apache ECharts (incubating) 是一个由百度开源的数据可视化,凭借着良好的交互性,精巧的图表设计,得到了众多开发者的认可。而 Python 是一门富有表达

Plotting library for IPython/Jupyter notebooks

bqplot 2-D plotting library for Project Jupyter Introduction bqplot is a 2-D visualization system for Jupyter, based on the constructs of the Grammar

:small_red_triangle: Ternary plotting library for python with matplotlib

python-ternary This is a plotting library for use with matplotlib to make ternary plots plots in the two dimensional simplex projected onto a two dime

Owner
Alex Spitzer
Alex Spitzer
3D plotting and mesh analysis through a streamlined interface for the Visualization Toolkit (VTK)

PyVista Deployment Build Status Metrics Citation License Community 3D plotting and mesh analysis through a streamlined interface for the Visualization

PyVista 692 Feb 18, 2021
Runtime analysis of code with plotting

Runtime analysis of code with plotting A quick comparison among Python, Cython, and the C languages A Programming Assignment regarding the Programming

Cena Ashoori 2 Dec 24, 2021
Python scripts for plotting audiograms and related data from Interacoustics Equinox audiometer and Otoaccess software.

audiometry Python scripts for plotting audiograms and related data from Interacoustics Equinox 2.0 audiometer and Otoaccess software. Maybe similar sc

Hamilton Lab at UT Austin 2 Jun 15, 2022
A high-level plotting API for pandas, dask, xarray, and networkx built on HoloViews

hvPlot A high-level plotting API for the PyData ecosystem built on HoloViews. Build Status Coverage Latest dev release Latest release Docs What is it?

HoloViz 697 Jan 6, 2023
Bokeh Plotting Backend for Pandas and GeoPandas

Pandas-Bokeh provides a Bokeh plotting backend for Pandas, GeoPandas and Pyspark DataFrames, similar to the already existing Visualization feature of

Patrik Hlobil 822 Jan 7, 2023
A high-level plotting API for pandas, dask, xarray, and networkx built on HoloViews

hvPlot A high-level plotting API for the PyData ecosystem built on HoloViews. Build Status Coverage Latest dev release Latest release Docs What is it?

HoloViz 349 Feb 15, 2021
Bokeh Plotting Backend for Pandas and GeoPandas

Pandas-Bokeh provides a Bokeh plotting backend for Pandas, GeoPandas and Pyspark DataFrames, similar to the already existing Visualization feature of

Patrik Hlobil 614 Feb 17, 2021
This is a Cross-Platform Plot Manager for Chia Plotting that is simple, easy-to-use, and reliable.

Swar's Chia Plot Manager A plot manager for Chia plotting: https://www.chia.net/ Development Version: v0.0.1 This is a cross-platform Chia Plot Manage

Swar Patel 1.3k Dec 13, 2022
Plotting data from the landroid and a raspberry pi zero to a influx-db

landroid-pi-influx Plotting data from the landroid and a raspberry pi zero to a influx-db Dependancies Hardware: Landroid WR130E Raspberry Pi Zero Wif

null 2 Oct 22, 2021
A simple code for plotting figure, colorbar, and cropping with python

Python Plotting Tools This repository provides a python code to generate figures (e.g., curves and barcharts) that can be used in the paper to show th

Guanying Chen 134 Jan 2, 2023