Data Visualizer Web-Application

Overview

Viz-It

Data Visualizer Web-Application


Viz-It

If I ask you where most of the data wrangler looses their time ?

It is Data Overview and EDA.

Presenting "Viz-It" which will do all these tasks for you. Just grab the data and upload it and visualize the data insights in a go!

How to use Viz-It? Check here

Demo Video Link

Tech-stack


Python Streamlit Plotly       Git
Used Python Libraries :
  matplotlib
  numpy
  pandas
  plotly
  streamlit
  wordcloud

Deployments

The project is currently deployed at heroku. Deployed Project

If you want to use it locally you can follow the installation methods shared below.

Installation


  1. Create a Virtual Environment : Tutorial

  2. Clone the repository.

  3. Open the directory with cmd.

  4. Copy this command in terminal to install dependencies.

     $pip install -r requirements.txt
    
  5. Installing the requirements.txt may generate some error due to outdated MS Visual C++ Build. You can fix this problem using this.

  6. Now to fire the web-application run this command on terminal.

     $streamlit run main.py
    
  7. Now use it for files under 200MB in size. (Will update for larger files soon).

Interface

Page Desktop Interface
Home
Overview
EDA
Correlation

Goals


  1. Reduces time for data understanding.
  2. All the visualizations are made with plotly to receive maximum insights of the data.
  3. Shares the deepest insights of the data in a go!

If you like the project, do

Also follow me on GitHub , Kaggle and on LinkedIn

Thank You for Visiting :)

You might also like...
This is  a web application to visualize various famous technical indicators and stocks tickers from user
This is a web application to visualize various famous technical indicators and stocks tickers from user

Visualizing Technical Indicators Using Python and Plotly. Currently facing issues hosting the application on heroku. As soon as I am able to I'll like

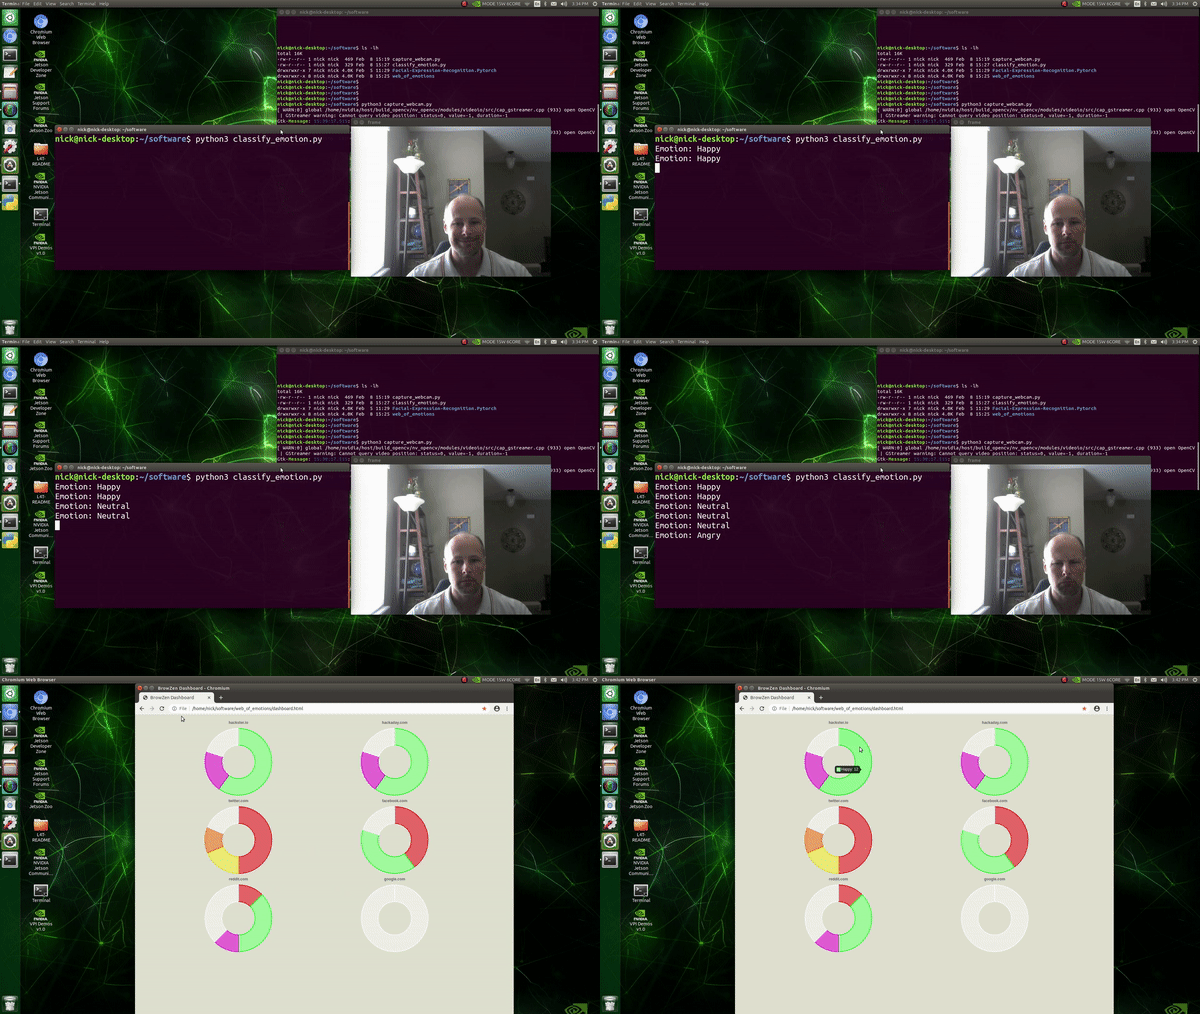
BrowZen correlates your emotional states with the web sites you visit to give you actionable insights about how you spend your time browsing the web.

BrowZen BrowZen correlates your emotional states with the web sites you visit to give you actionable insights about how you spend your time browsing t

 Show Data: Show your dataset in web browser!
Show Data: Show your dataset in web browser!

Show Data is to generate html tables for large scale image dataset, especially for the dataset in remote server. It provides some useful commond line tools and fully customizeble API reference to generate html table different tasks.

An application that allows you to design and test your own stock trading algorithms in an attempt to beat the market.

StockBot is a Python application for designing and testing your own daily stock trading algorithms. Installation Use the

Application for viewing pokemon regional variants.

Pokemon Regional Variants Application Application for viewing pokemon regional variants. Run The Source Code Download Python https://www.python.org/do

A gui application to visualize various sorting algorithms using pure python.

Sorting Algorithm Visualizer A gui application to visualize various sorting algorithms using pure python. Language : Python 3 Libraries required Tkint

It's an application to calculate I from v and r. It can also plot a graph between V vs I.

Ohm-s-Law-Visualizer It's an application to calculate I from v and r using Ohm's Law. It can also plot a graph between V vs I. Story I'm doing my Unde

Sentiment Analysis application created with Python and Dash, hosted at socialsentiment.net

Social Sentiment Dash Application Live-streaming sentiment analysis application created with Python and Dash, hosted at SocialSentiment.net. Dash Tuto

Function Plotter: a simple application with GUI to plot mathematical functions

Function-Plotter Function Plotter is a simple application with GUI to plot mathe

Owner
Sagnik Roy
Data Science Intern @ Argoid • Video Games & Machine Vision attracts me!
Sagnik Roy
Time series visualizer is a flexible extension that provides filling world map by country from real data.

Time-series-visualizer Time series visualizer is a flexible extension that provides filling world map by country from csv or json file. You can know d

Long Ng 3 Jul 9, 2021
2D maze path solver visualizer implemented with python

2D maze path solver visualizer implemented with python

SS 14 Dec 21, 2022
Log visualizer for whirl-framework

Lumberjack Log visualizer for whirl-framework Установка pip install -r requirements.txt Как пользоваться python3 lumberjack.py -l <путь до лога> -o <

Vladimir Malinovskii 2 Dec 19, 2022
This is a sorting visualizer made with Tkinter.

Sorting-Visualizer This is a sorting visualizer made with Tkinter. Make sure you've installed tkinter in your system to use this visualizer pip instal

Vishal Choubey 7 Jul 6, 2022
Alternative layout visualizer for ZSA Moonlander keyboard

General info This is a keyboard layout visualizer for ZSA Moonlander keyboard (because I didn't find their Oryx or their training tool particularly us

null 10 Jul 19, 2022
Decision Border Visualizer for Classification Algorithms

dbv Decision Border Visualizer for Classification Algorithms Project description A python package for Machine Learning Engineers who want to visualize

Sven Eschlbeck 1 Nov 1, 2021
A filler visualizer built using python

filler-visualizer 42 filler のログをビジュアライズしてスポーツさながら楽しむことができます! Usage (標準入力でvisualizer.pyに渡せばALL OK) 1. 既にあるログをビジュアライズする $ ./filler_vm -t 3 -p1 john_fill

Takumi Hara 1 Nov 4, 2021
ICS-Visualizer is an interactive Industrial Control Systems (ICS) network graph that contains up-to-date ICS metadata

ICS-Visualizer is an interactive Industrial Control Systems (ICS) network graph that contains up-to-date ICS metadata (Name, company, port, user manua

QeeqBox 2 Dec 13, 2021
Graphical visualizer for spectralyze by Lauchmelder23

spectralyze visualizer Graphical visualizer for spectralyze by Lauchmelder23 Install Install matplotlib and ffmpeg. Put ffmpeg.exe in same folder as v

Matthew 1 Dec 21, 2021
This project is an Algorithm Visualizer where a user can visualize algorithms like Bubble Sort, Merge Sort, Quick Sort, Selection Sort, Linear Search and Binary Search.

Algo_Visualizer This project is an Algorithm Visualizer where a user can visualize common algorithms like "Bubble Sort", "Merge Sort", "Quick Sort", "

Rahul 4 Feb 7, 2022