635 Repositories
Python cnn-visualization-technique Libraries
CNN Based Meta-Learning for Noisy Image Classification and Template Matching
CNN Based Meta-Learning for Noisy Image Classification and Template Matching Introduction This master thesis used a few-shot meta learning approach to
PyQT5 app that colorize black & white pictures using CNN(use pre-trained model which was made with OpenCV)
About PyQT5 app that colorize black & white pictures using CNN(use pre-trained model which was made with OpenCV) Colorizor Приложение для проекта Yand
![Models Supported: AlbUNet [18, 34, 50, 101, 152] (1D and 2D versions for Single and Multiclass Segmentation, Feature Extraction with supports for Deep Supervision and Guided Attention)](https://github.com/Sakib1263/AlbUNet-1D-2D-Tensorflow-Keras/raw/main/Documents/Images/AlbuNet.png)
Models Supported: AlbUNet [18, 34, 50, 101, 152] (1D and 2D versions for Single and Multiclass Segmentation, Feature Extraction with supports for Deep Supervision and Guided Attention)
AlbUNet-1D-2D-Tensorflow-Keras This repository contains 1D and 2D Signal Segmentation Model Builder for AlbUNet and several of its variants developed

Interactive convnet features visualization for Keras
Quiver Interactive convnet features visualization for Keras The quiver workflow Video Demo Build your model in keras model = Model(...) Launch the vis

VizTracer is a low-overhead logging/debugging/profiling tool that can trace and visualize your python code execution.
VizTracer is a low-overhead logging/debugging/profiling tool that can trace and visualize your python code execution.
CNN designed for pansharpening
PROGRESSIVE BAND-SEPARATED CONVOLUTIONAL NEURAL NETWORK FOR MULTISPECTRAL PANSHARPENING This repository contains main code for the paper PROGRESSIVE B

Code and models for "Pano3D: A Holistic Benchmark and a Solid Baseline for 360 Depth Estimation", OmniCV Workshop @ CVPR21.
Pano3D A Holistic Benchmark and a Solid Baseline for 360o Depth Estimation Pano3D is a new benchmark for depth estimation from spherical panoramas. We

This project uses Template Matching technique for object detecting by detection of template image over base image.
Object Detection Project Using OpenCV This project uses Template Matching technique for object detecting by detection the template image over base ima
Tensorflow Implementation of SMU: SMOOTH ACTIVATION FUNCTION FOR DEEP NETWORKS USING SMOOTHING MAXIMUM TECHNIQUE
SMU A Tensorflow Implementation of SMU: SMOOTH ACTIVATION FUNCTION FOR DEEP NETWORKS USING SMOOTHING MAXIMUM TECHNIQUE arXiv https://arxiv.org/abs/211

Pytools is an open source library containing general machine learning and visualisation utilities for reuse
pytools is an open source library containing general machine learning and visualisation utilities for reuse, including: Basic tools for API developmen

An Ensemble of CNN (Python 3.5.1 Tensorflow 1.3 numpy 1.13)
An Ensemble of CNN (Python 3.5.1 Tensorflow 1.3 numpy 1.13)

Image Segmentation using U-Net, U-Net with skip connections and M-Net architectures
Brain-Image-Segmentation Segmentation of brain tissues in MRI image has a number of applications in diagnosis, surgical planning, and treatment of bra

Daily social mapping project in November 2021. Maps made using PyGMT whenever possible.
Daily social mapping project in November 2021. Maps made using PyGMT whenever possible.

Python Package for CanvasXpress JS Visualization Tools
CanvasXpress Python Library About CanvasXpress for Python CanvasXpress was developed as the core visualization component for bioinformatics and system

PyTorch implementation of our ICCV paper DeFRCN: Decoupled Faster R-CNN for Few-Shot Object Detection.
Introduction This repo contains the official PyTorch implementation of our ICCV paper DeFRCN: Decoupled Faster R-CNN for Few-Shot Object Detection. Up
CNN+Attention+Seq2Seq
Attention_OCR CNN+Attention+Seq2Seq The model and its tensor transformation are shown in the figure below It is necessary ch_ train and ch_ test the p
Code for CMaskTrack R-CNN (proposed in Occluded Video Instance Segmentation)
CMaskTrack R-CNN for OVIS This repo serves as the official code release of the CMaskTrack R-CNN model on the Occluded Video Instance Segmentation data
A curated list of the latest breakthroughs in AI by release date with a clear video explanation, link to a more in-depth article, and code.
A curated list of the latest breakthroughs in AI by release date with a clear video explanation, link to a more in-depth article, and code

A simple project on Data Visualization for CSCI-40 course.
Simple-Data-Visualization A simple project on Data Visualization for CSCI-40 course - the instructions can be found here SAT results in New York in 20
ecoglib: visualization and statistics for high density microecog signals
ecoglib: visualization and statistics for high density microecog signals This library contains high-level analysis tools for "topos" and "chronos" asp

Exploratory analysis and data visualization of aircraft accidents and incidents in Brazil.
Exploring aircraft accidents in Brazil Occurrencies with aircraft in Brazil are investigated by the Center for Investigation and Prevention of Aircraf

A Python package to facilitate research on building and evaluating automated scoring models.
Rater Scoring Modeling Tool Introduction Automated scoring of written and spoken test responses is a growing field in educational natural language pro

cLoops2: full stack analysis tool for chromatin interactions
cLoops2: full stack analysis tool for chromatin interactions Introduction cLoops2 is an extension of our previous work, cLoops. From loop-calling base
A CNN implementation using only numpy. Supports multidimensional images, stride, etc.
A CNN implementation using only numpy. Supports multidimensional images, stride, etc. Speed up due to heavy use of slicing and mathematical simplification..

edaSQL is a library to link SQL to Exploratory Data Analysis and further more in the Data Engineering.
edaSQL is a python library to bridge the SQL with Exploratory Data Analysis where you can connect to the Database and insert the queries. The query results can be passed to the EDA tool which can give greater insights to the user.

Convolutional neural network visualization techniques implemented in PyTorch.
This repository contains a number of convolutional neural network visualization techniques implemented in PyTorch.

Beyond a Gaussian Denoiser: Residual Learning of Deep CNN for Image Denoising
Beyond a Gaussian Denoiser: Residual Learning of Deep CNN for Image Denoising

A diff tool for language models
LMdiff Qualitative comparison of large language models. Demo & Paper: http://lmdiff.net LMdiff is a MIT-IBM Watson AI Lab collaboration between: Hendr

MPL Plotter is a Matplotlib based Python plotting library built with the goal of delivering publication-quality plots concisely.
MPL Plotter is a Matplotlib based Python plotting library built with the goal of delivering publication-quality plots concisely.
This is a Keras implementation of a CNN for estimating age, gender and mask from a camera.
face-detector-age-gender This is a Keras implementation of a CNN for estimating age, gender and mask from a camera. Before run face detector app, expr

A python module for scientific analysis of 3D objects based on VTK and Numpy
A lightweight and powerful python module for scientific analysis and visualization of 3d objects.

Visualization Data Drug in thailand during 2014 to 2020
Visualization Data Drug in thailand during 2014 to 2020 Data sorce from ข้อมูลเปิดภาครัฐ สำนักงาน ป.ป.ส Inttroducing program Using tkinter module for

The Metabolomics Integrator (MINT) is a post-processing tool for liquid chromatography-mass spectrometry (LCMS) based metabolomics.
MINT (Metabolomics Integrator) The Metabolomics Integrator (MINT) is a post-processing tool for liquid chromatography-mass spectrometry (LCMS) based m

Data science, Data manipulation and Machine learning package.
duality Data science, Data manipulation and Machine learning package. Use permitted according to the terms of use and conditions set by the attached l

Survival analysis (SA) is a well-known statistical technique for the study of temporal events.
DAGSurv Survival analysis (SA) is a well-known statistical technique for the study of temporal events. In SA, time-to-an-event data is modeled using a

This is an auto-ML tool specialized in detecting of outliers
Auto-ML tool specialized in detecting of outliers Description This tool will allows you, with a Dash visualization, to compare 10 models of machine le

Decision Border Visualizer for Classification Algorithms
dbv Decision Border Visualizer for Classification Algorithms Project description A python package for Machine Learning Engineers who want to visualize

A command line tool for visualizing CSV/spreadsheet-like data
PerfPlotter Read data from CSV files using pandas and generate interactive plots using bokeh, which can then be embedded into HTML pages and served by
Data visualization electromagnetic spectrum
Datenvisualisierung-Elektromagnetischen-Spektrum Anhand des Moduls matplotlib sollen die Daten des elektromagnetischen Spektrums dargestellt werden. D

Homework 2: Matplotlib and Data Visualization
Homework 2: Matplotlib and Data Visualization Overview These data visualizations were created for my introductory computer science course using Python
keyframes-CNN-RNN(action recognition)
keyframes-CNN-RNN(action recognition) Environment: python=3.7 pytorch=1.2 Datasets: Following the format of UCF101 action recognition. Run steps: Mo

Can we visualize a large scientific data set with a surrogate model? We're building a GAN for the Earth's Mantle Convection data set to see if we can!
EarthGAN - Earth Mantle Surrogate Modeling Can a surrogate model of the Earth’s Mantle Convection data set be built such that it can be readily run in

This repository contains the implementation of the paper: "Towards Frequency-Based Explanation for Robust CNN"
RobustFreqCNN About This repository contains the implementation of the paper "Towards Frequency-Based Explanation for Robust CNN" arxiv. It primarly d

Data visualization using matplotlib
Data visualization using matplotlib project instructions Top 5 Most Common Coffee Origins In this visualization I used data from Ankur Chavda on Kaggl

Rick and Morty Data Visualization with python
Rick and Morty Data Visualization For this project I looked at data for the TV show Rick and Morty Number of Episodes at a Certain Location Here is th

Create a visualization for Trump's Tweeted Words Using Python
Data Trump's Tweeted Words This plot illustrates twitter word occurences. We already did the coding I needed for this plot, so I was very inspired to

China and India Population and GDP Visualization
China and India Population and GDP Visualization Historical Population Comparison between India and China This graph shows the population data of Indi
Python IDE or notebook to generate a basic Kepler.gl data visualization
geospatial-data-analysis [readme] Use this code in your Python IDE or notebook to generate a basic Kepler.gl data visualization, without pre-configura
Classifies galaxy morphology with Bayesian CNN
Zoobot Zoobot classifies galaxy morphology with deep learning. This code will let you: Reproduce and improve the Galaxy Zoo DECaLS automated classific
This is a web application to visualize various famous technical indicators and stocks tickers from user
Visualizing Technical Indicators Using Python and Plotly. Currently facing issues hosting the application on heroku. As soon as I am able to I'll like

my graduation project is about live human face augmentation by projection mapping by using CNN
Live-human-face-expression-augmentation-by-projection my graduation project is about live human face augmentation by projection mapping by using CNN o

LibreMind is a free meditation app made in under 24 hours. It has various meditation, breathwork, and visualization exercises.
libreMind Meditation exercises What is it? LibreMind is a free meditation app made in under 24 hours. It has various meditation, breathwork, and visua
3D detection and tracking viewer (visualization) for kitti & waymo dataset
3D detection and tracking viewer (visualization) for kitti & waymo dataset

使用yolov5训练自己数据集(详细过程)并通过flask部署
使用yolov5训练自己的数据集(详细过程)并通过flask部署 依赖库 torch torchvision numpy opencv-python lxml tqdm flask pillow tensorboard matplotlib pycocotools Windows,请使用 pycoc

NAS-HPO-Bench-II is the first benchmark dataset for joint optimization of CNN and training HPs.
NAS-HPO-Bench-II API Overview NAS-HPO-Bench-II is the first benchmark dataset for joint optimization of CNN and training HPs. It helps a fair and low-
Modeling CNN layers activity with Gaussian mixture model
GMM-CNN This code package implements the modeling of CNN layers activity with Gaussian mixture model and Inference Graphs visualization technique from
This is a sorting visualizer made with Tkinter.
Sorting-Visualizer This is a sorting visualizer made with Tkinter. Make sure you've installed tkinter in your system to use this visualizer pip instal

JittorVis - Visual understanding of deep learning models
JittorVis: Visual understanding of deep learning model JittorVis is an open-source library for understanding the inner workings of Jittor models by vi

A multi-functional library for full-stack Deep Learning. Simplifies Model Building, API development, and Model Deployment.
chitra What is chitra? chitra (चित्र) is a multi-functional library for full-stack Deep Learning. It simplifies Model Building, API development, and M

Deep Learning to Create StepMania SM FIles
StepCOVNet Running Audio to SM File Generator Currently only produces .txt files. Use SMDataTools to convert .txt to .sm python stepmania_note_generat
Permeability Prediction Via Multi Scale 3D CNN
Permeability-Prediction-Via-Multi-Scale-3D-CNN Data: The raw CT rock cores are obtained from the Imperial Colloge portal. The CT rock cores are sub-sa
A simple example of ML classification, cross validation, and visualization of feature importances
Simple-Classifier This is a basic example of how to use several different libraries for classification and ensembling, mostly with sklearn. Example as

QuakeLabeler is a Python package to create and manage your seismic training data, processes, and visualization in a single place — so you can focus on building the next big thing.
QuakeLabeler Quake Labeler was born from the need for seismologists and developers who are not AI specialists to easily, quickly, and independently bu

Retentioneering: product analytics, data-driven customer journey map optimization, marketing analytics, web analytics, transaction analytics, graph visualization, and behavioral segmentation with customer segments in Python.
What is Retentioneering? Retentioneering is a Python framework and library to assist product analysts and marketing analysts as it makes it easier to

PyTorch implementation of the paper Ultra Fast Structure-aware Deep Lane Detection
PyTorch implementation of the paper Ultra Fast Structure-aware Deep Lane Detection

Unofficial pytorch implementation of 'Arbitrary Style Transfer in Real-time with Adaptive Instance Normalization'
pytorch-AdaIN This is an unofficial pytorch implementation of a paper, Arbitrary Style Transfer in Real-time with Adaptive Instance Normalization [Hua

TagLab: an image segmentation tool oriented to marine data analysis
TagLab: an image segmentation tool oriented to marine data analysis TagLab was created to support the activity of annotation and extraction of statist

Seaborn-image is a Python image visualization library based on matplotlib and provides a high-level API to draw attractive and informative images quickly and effectively.
seaborn-image: image data visualization Description Seaborn-image is a Python image visualization library based on matplotlib and provides a high-leve
PyTorch image models, scripts, pretrained weights -- ResNet, ResNeXT, EfficientNet, EfficientNetV2, NFNet, Vision Transformer, MixNet, MobileNet-V3/V2, RegNet, DPN, CSPNet, and more
PyTorch Image Models Sponsors What's New Introduction Models Features Results Getting Started (Documentation) Train, Validation, Inference Scripts Awe

Class activation maps for your PyTorch models (CAM, Grad-CAM, Grad-CAM++, Smooth Grad-CAM++, Score-CAM, SS-CAM, IS-CAM, XGrad-CAM, Layer-CAM)
TorchCAM: class activation explorer Simple way to leverage the class-specific activation of convolutional layers in PyTorch. Quick Tour Setting your C

Doosan robotic arm, simulation, control, visualization in Gazebo and ROS2 for Reinforcement Learning.
Robotic Arm Simulation in ROS2 and Gazebo General Overview This repository includes: First, how to simulate a 6DoF Robotic Arm from scratch using GAZE

🦙 LaMa Image Inpainting, Resolution-robust Large Mask Inpainting with Fourier Convolutions, WACV 2022
🦙 LaMa Image Inpainting, Resolution-robust Large Mask Inpainting with Fourier Convolutions, WACV 2022
The PyTorch re-implement of a 3D CNN Tracker to extract coronary artery centerlines with state-of-the-art (SOTA) performance. (paper: 'Coronary artery centerline extraction in cardiac CT angiography using a CNN-based orientation classifier')
The PyTorch re-implement of a 3D CNN Tracker to extract coronary artery centerlines with state-of-the-art (SOTA) performance. (paper: 'Coronary artery centerline extraction in cardiac CT angiography using a CNN-based orientation classifier')
missing-pixel-filler is a python package that, given images that may contain missing data regions (like satellite imagery with swath gaps), returns these images with the regions filled.
Missing Pixel Filler This is the official code repository for the Missing Pixel Filler by SpaceML. missing-pixel-filler is a python package that, give

A GUI visualization of QuickSort algorithm
QQuickSort A simple GUI visualization of QuickSort algorithm. It only uses PySide6, it does not have any other external dependency. How to run Install

PoseViz – Multi-person, multi-camera 3D human pose visualization tool built using Mayavi.
PoseViz – 3D Human Pose Visualizer Multi-person, multi-camera 3D human pose visualization tool built using Mayavi. As used in MeTRAbs visualizations.

Glue is a python project to link visualizations of scientific datasets across many files.
Glue Glue is a python project to link visualizations of scientific datasets across many files. Click on the image for a quick demo: Features Interacti

🌌 Economics Observatory Visualisation Repository
Economics Observatory Visualisation Repository Website | Visualisations | Data | Here you will find all the data visualisations and infographics attac
Audio Steganography is a technique used to transmit hidden information by modifying an audio signal in an imperceptible manner.
Audio Steganography Audio Steganography is a technique used to transmit hidden information by modifying an audio signal in an imperceptible manner. Ab
Code for our paper "Interactive Analysis of CNN Robustness"
Perturber Code for our paper "Interactive Analysis of CNN Robustness" Datasets Feature visualizations: Google Drive Fine-tuning checkpoints as saved m
Unofficial PyTorch Implementation of "DOLG: Single-Stage Image Retrieval with Deep Orthogonal Fusion of Local and Global Features"
Pytorch Implementation of Deep Orthogonal Fusion of Local and Global Features (DOLG) This is the unofficial PyTorch Implementation of "DOLG: Single-St

A gui application to visualize various sorting algorithms using pure python.
Sorting Algorithm Visualizer A gui application to visualize various sorting algorithms using pure python. Language : Python 3 Libraries required Tkint

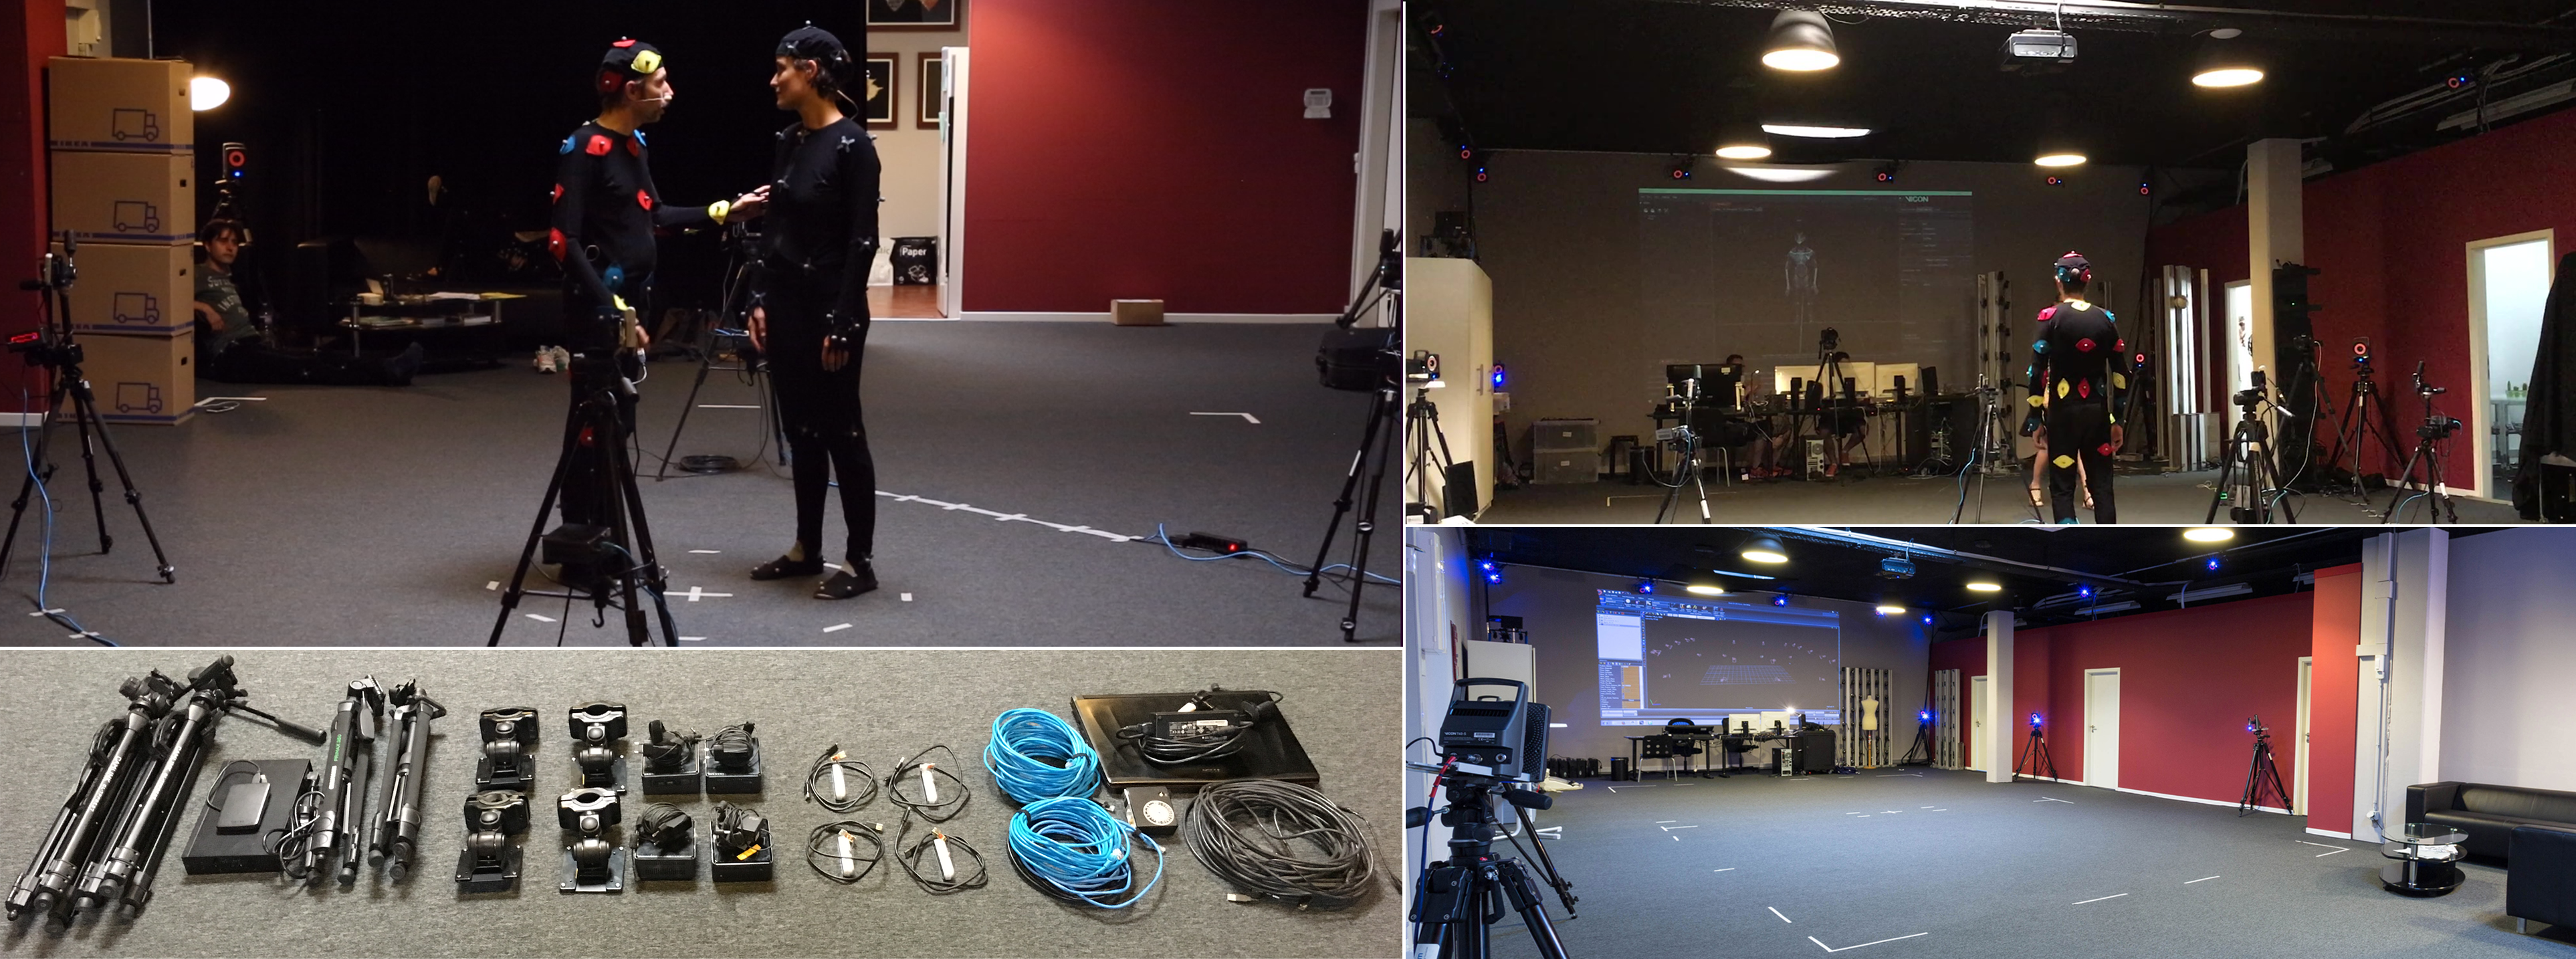
Human4D Dataset tools for processing and visualization
HUMAN4D: A Human-Centric Multimodal Dataset for Motions & Immersive Media HUMAN4D constitutes a large and multimodal 4D dataset that contains a variet

Density-aware Single Image De-raining using a Multi-stream Dense Network (CVPR 2018)
DID-MDN Density-aware Single Image De-raining using a Multi-stream Dense Network He Zhang, Vishal M. Patel [Paper Link] (CVPR'18) We present a novel d

The code is an implementation of Feedback Convolutional Neural Network for Visual Localization and Segmentation.
Feedback Convolutional Neural Network for Visual Localization and Segmentation The code is an implementation of Feedback Convolutional Neural Network
A data visualization curriculum of interactive notebooks.
A data visualization curriculum of interactive notebooks, using Vega-Lite and Altair. This repository contains a series of Python-based Jupyter notebooks.

A visualization tool made in Pygame for various pathfinding algorithms.
Pathfinding-Visualizer 🚀 A visualization tool made in Pygame for various pathfinding algorithms. Pathfinding is closely related to the shortest path

Using Selenium with Python to Web Scrap Popular Youtube Tech Channels.
Web Scrapping Popular Youtube Tech Channels with Selenium Data Mining, Data Wrangling, and Exploratory Data Analysis About the Data Web scrapi
HyperSpy is an open source Python library for the interactive analysis of multidimensional datasets
HyperSpy is an open source Python library for the interactive analysis of multidimensional datasets that can be described as multidimensional arrays o

Revitalizing CNN Attention via Transformers in Self-Supervised Visual Representation Learning
Revitalizing CNN Attention via Transformers in Self-Supervised Visual Representation Learning This repository is the official implementation of CARE.

Revitalizing CNN Attention via Transformers in Self-Supervised Visual Representation Learning
Revitalizing CNN Attention via Transformers in Self-Supervised Visual Representation Learning

Pytorch implementation for our ICCV 2021 paper "TRAR: Routing the Attention Spans in Transformers for Visual Question Answering".
TRAnsformer Routing Networks (TRAR) This is an official implementation for ICCV 2021 paper "TRAR: Routing the Attention Spans in Transformers for Visu

StyleTransfer - Open source style transfer project, based on VGG19
StyleTransfer - Open source style transfer project, based on VGG19

Shallow Convolutional Neural Networks for Human Activity Recognition using Wearable Sensors
-IEEE-TIM-2021-1-Shallow-CNN-for-HAR [IEEE TIM 2021-1] Shallow Convolutional Neural Networks for Human Activity Recognition using Wearable Sensors All

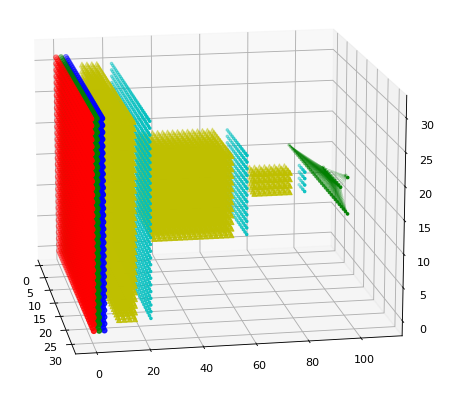
A ultra-lightweight 3D renderer of the Tensorflow/Keras neural network architectures
A ultra-lightweight 3D renderer of the Tensorflow/Keras neural network architectures

Reporting and Visualization for Hazardous Events
Reporting and Visualization for Hazardous Events

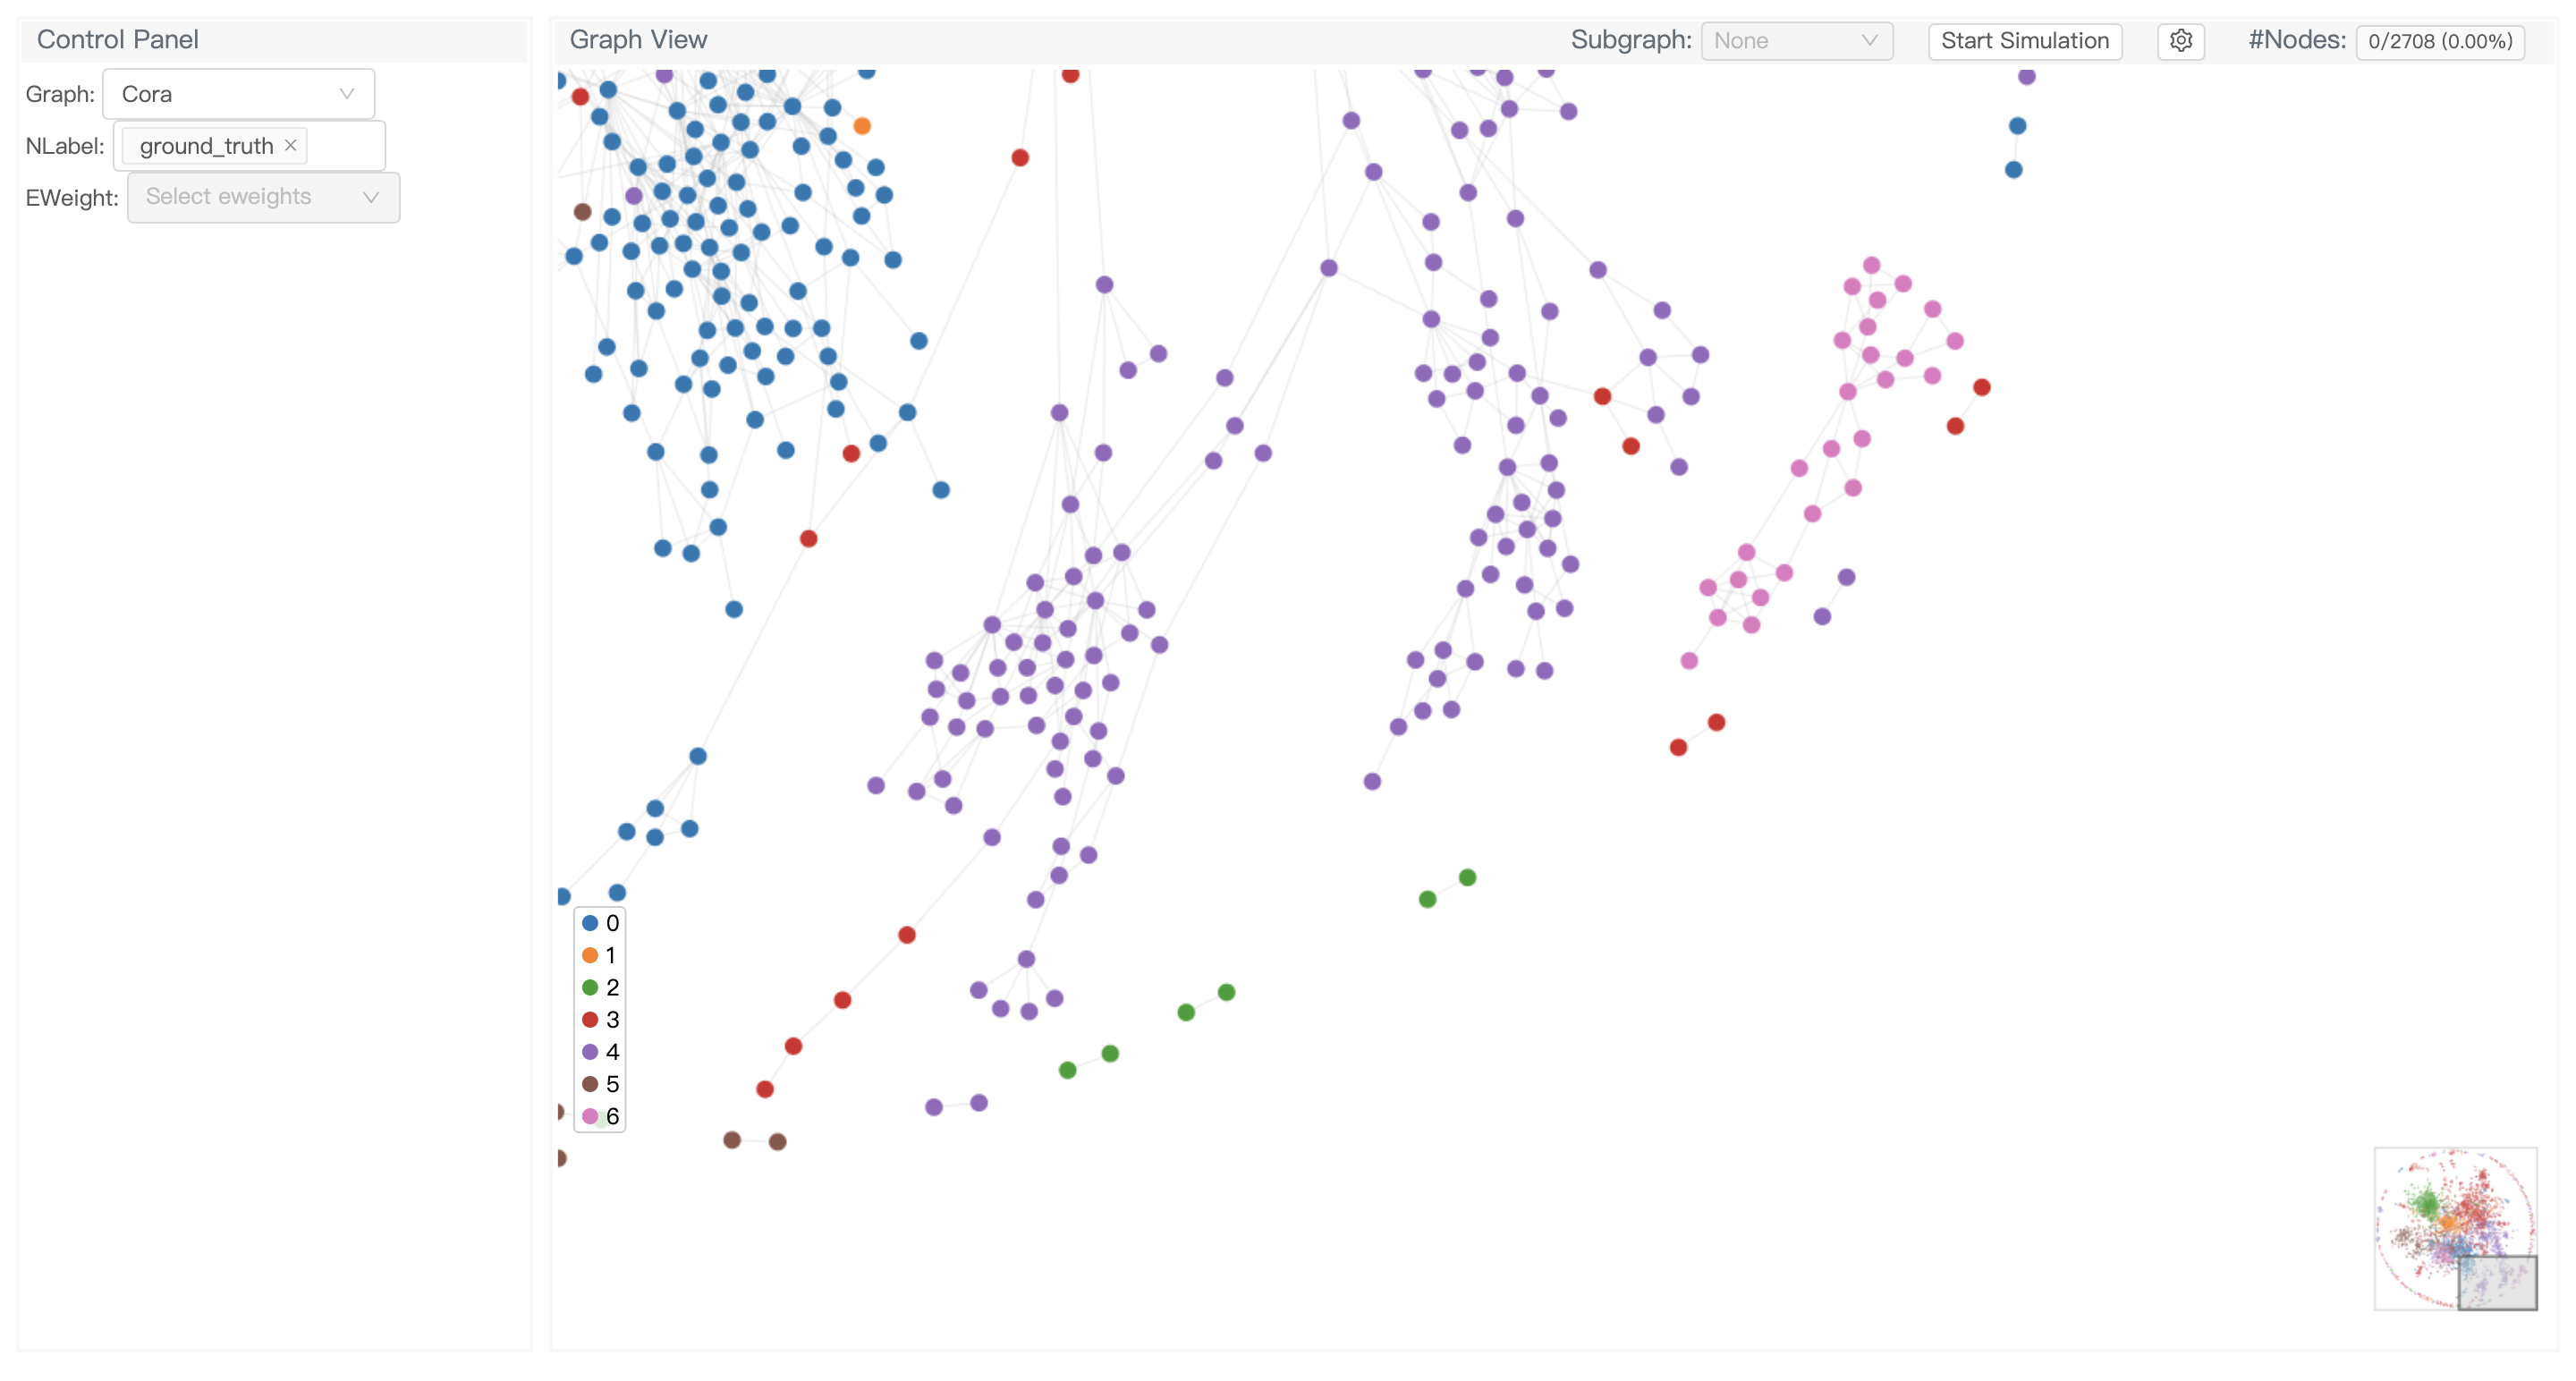
GNNLens2 is an interactive visualization tool for graph neural networks (GNN).
GNNLens2 is an interactive visualization tool for graph neural networks (GNN).

DGCNN - Dynamic Graph CNN for Learning on Point Clouds
DGCNN is the author's re-implementation of Dynamic Graph CNN, which achieves state-of-the-art performance on point-cloud-related high-level tasks including category classification, semantic segmentation and part segmentation.

This is the official pytorch implementation of Student Helping Teacher: Teacher Evolution via Self-Knowledge Distillation(TESKD)
Student Helping Teacher: Teacher Evolution via Self-Knowledge Distillation (TESKD) By Zheng Li[1,4], Xiang Li[2], Lingfeng Yang[2,4], Jian Yang[2], Zh
