39 Repositories
Python ladybug-charts Libraries

ipyvizzu - Jupyter notebook integration of Vizzu
ipyvizzu - Jupyter notebook integration of Vizzu. Tutorial · Examples · Repository About The Project ipyvizzu is the Jupyter Notebook integration of V
Get charts, top artists and top songs WITHOUT LastFM API
LastFM Get charts, top artists and top songs WITHOUT LastFM API Usage Get stats (charts) We provide many filters and options to customize. Geo filter

Create charts with Python in a very similar way to creating charts using Chart.js
Create charts with Python in a very similar way to creating charts using Chart.js. The charts created are fully configurable, interactive and modular and are displayed directly in the output of the the cells of your jupyter notebook environment.

Powering up Apache JMeter with Streamlit and opening the door for machine learning.
Powering up Apache JMeter with Streamlit Overview Apache JMeter is an open source load testing tool written in 100% pure Java. JMeter supports umpteen

Checkov is a static code analysis tool for infrastructure-as-code.
Checkov - Prevent cloud misconfigurations during build-time for Terraform, Cloudformation, Kubernetes, Serverless framework and other infrastructure-as-code-languages with Checkov by Bridgecrew.
Help you discover excellent English projects and get rid of disturbing by other spoken language
GitHub English Top Charts 「Help you discover excellent English projects and get
Data-FX is an addon for Blender (2.9) that allows for the visualization of data with different charts
Data-FX Data-FX is an addon for Blender (2.9) that allows for the visualization of data with different charts Currently, there are only 2 chart option

📊 Charts with pure python
A zero-dependency python package that prints basic charts to a Jupyter output Charts supported: Bar graphs Scatter plots Histograms 🍑 📊 👏 Examples
Amazon AWS Web Tool (view only)
Amazon AWS Web Tool (AAWT) discontinued Features Cloudfront (simple) EC2 (With Charts and Prices) EC2 Reserved EBS ELB (With Charts) Obs:. only classi
GitHub English Top Charts
Help you discover excellent English projects and get rid of the interference of other spoken language.

Easily configurable, chart dashboards from any arbitrary API endpoint. JSON config only
Flask JSONDash Easily configurable, chart dashboards from any arbitrary API endpoint. JSON config only. Ready to go. This project is a flask blueprint
🐞 📊 Ladybug extension to generate 2D charts
ladybug-charts Ladybug extension to generate 2D charts. Installation pip install ladybug-charts QuickStart import ladybug_charts API Documentation Loc

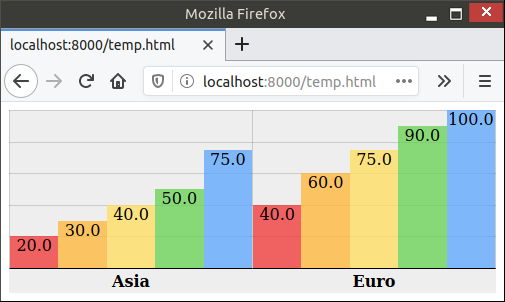
`charts.css.py` brings `charts.css` to Python. Online documentation and samples is available at the link below.
charts.css.py charts.css.py provides a python API to convert your 2-dimension data lists into html snippet, which will be rendered into charts by CSS,

A python-generated website for visualizing the novel coronavirus (COVID-19) data for Greece.
COVID-19-Greece A python-generated website for visualizing the novel coronavirus (COVID-19) data for Greece. Data sources Data provided by Johns Hopki

A concise grammar of interactive graphics, built on Vega.
Vega-Lite Vega-Lite provides a higher-level grammar for visual analysis that generates complete Vega specifications. You can find more details, docume

Scrap electronic music charts into CSV files
musiccharts A small python script to scrap (electronic) music charts into directories with csv files. Installation Download MusicCharts.exe Run MusicC

🧮A simple calculator written in python allows you to make simple calculations, write charts, calculate the dates, and exchange currency.
Calculator 🖩 A simple calculator written in python allows you to make simple calculations, write charts, calculate the dates, and exchange currency.
Altair extension for saving charts in a variety of formats.
Altair Saver This packge provides extensions to Altair for saving charts to a variety of output types. Supported output formats are: .json/.vl.json: V

Because trello only have payed options to generate a RunUp chart, this solves that!
Trello Runup Chart Generator The basic concept of the project is that Corello is pay-to-use and want to use Trello To-Do/Doing/Done automation with gi

Super simple bar charts for django admin list views visualizing the number of objects based on date_hierarchy using Chart.js.
Super simple bar charts for django admin list views visualizing the number of objects based on date_hierarchy using Chart.js.

Tickergram is a Telegram bot to look up quotes, charts, general market sentiment and more.
Tickergram is a Telegram bot to look up quotes, charts, general market sentiment and more.

mysql relation charts
sqlcharts 自动生成数据库关联关系图 复制settings.py.example 重命名为settings.py 将数据库配置信息填入settings.DATABASE,目前支持mysql和postgresql 执行 python build.py -b,-b是读取数据库表结构,如果只更新匹
Livemark is a static page generator that extends Markdown with interactive charts, tables, and more.
Livermark This software is in the early stages and is not well-tested Livemark is a static site generator that extends Markdown with interactive chart
A Python module for creating Excel XLSX files.
XlsxWriter XlsxWriter is a Python module for writing files in the Excel 2007+ XLSX file format. XlsxWriter can be used to write text, numbers, formula

Python library that makes it easy for data scientists to create charts.
Chartify Chartify is a Python library that makes it easy for data scientists to create charts. Why use Chartify? Consistent input data format: Spend l
Streamlit dashboard examples - Twitter cashtags, StockTwits, WSB, Charts, SQL Pattern Scanner
streamlit-dashboards Streamlit dashboard examples - Twitter cashtags, StockTwits, WSB, Charts, SQL Pattern Scanner Tutorial Video https://ww
Drag’n’drop Pivot Tables and Charts for Jupyter/IPython Notebook, care of PivotTable.js
pivottablejs: the Python module Drag’n’drop Pivot Tables and Charts for Jupyter/IPython Notebook, care of PivotTable.js Installation pip install pivot
🧇 Make Waffle Charts in Python.
PyWaffle PyWaffle is an open source, MIT-licensed Python package for plotting waffle charts. It provides a Figure constructor class Waffle, which coul

Python library that makes it easy for data scientists to create charts.
Chartify Chartify is a Python library that makes it easy for data scientists to create charts. Why use Chartify? Consistent input data format: Spend l
Drag’n’drop Pivot Tables and Charts for Jupyter/IPython Notebook, care of PivotTable.js
pivottablejs: the Python module Drag’n’drop Pivot Tables and Charts for Jupyter/IPython Notebook, care of PivotTable.js Installation pip install pivot
🧇 Make Waffle Charts in Python.
PyWaffle PyWaffle is an open source, MIT-licensed Python package for plotting waffle charts. It provides a Figure constructor class Waffle, which coul

Python library that makes it easy for data scientists to create charts.
Chartify Chartify is a Python library that makes it easy for data scientists to create charts. Why use Chartify? Consistent input data format: Spend l
Simple and rapid application development framework, built on top of Flask. includes detailed security, auto CRUD generation for your models, google charts and much more. Demo (login with guest/welcome) - http://flaskappbuilder.pythonanywhere.com/
Flask App Builder Simple and rapid application development framework, built on top of Flask. includes detailed security, auto CRUD generation for your
This repository contains code examples and documentation for learning how applications can be developed with Kubernetes
BigBitBus KAT Components Click on the diagram to enlarge, or follow this link for detailed documentation Introduction Welcome to the BigBitBus Kuberne
Backtest 1000s of minute-by-minute trading algorithms for training AI with automated pricing data from: IEX, Tradier and FinViz. Datasets and trading performance automatically published to S3 for building AI training datasets for teaching DNNs how to trade. Runs on Kubernetes and docker-compose. 150 million trading history rows generated from +5000 algorithms. Heads up: Yahoo's Finance API was disabled on 2019-01-03 https://developer.yahoo.com/yql/
Stock Analysis Engine Build and tune investment algorithms for use with artificial intelligence (deep neural networks) with a distributed stack for ru
A Google Charts API for Python, meant to be used as an alternative to matplotlib.
GooPyCharts A Google Charts API for Python 2 and 3, meant to be used as an alternative to matplotlib. Syntax is similar to MATLAB. The goal of this pr
A Python module for creating Excel XLSX files.
XlsxWriter XlsxWriter is a Python module for writing files in the Excel 2007+ XLSX file format. XlsxWriter can be used to write text, numbers, formula

Simple plotting for Python. Python wrapper for D3xter - render charts in the browser with simple Python syntax.
PyDexter Simple plotting for Python. Python wrapper for D3xter - render charts in the browser with simple Python syntax. Setup $ pip install PyDexter

🔥 Pyflame: A Ptracing Profiler For Python. This project is deprecated and not maintained.
Pyflame: A Ptracing Profiler For Python (This project is deprecated and not maintained.) Pyflame is a high performance profiling tool that generates f