185 Repositories
Python Matplotlib-practice Libraries
Resources complimenting the Machine Learning Course led in the Faculty of mathematics and informatics part of Sofia University.
Machine Learning and Data Mining, Summer 2021-2022 How to learn data science and machine learning? Programming. Learn Python. Basic Statistics. Take a

Responsible AI Workshop: a series of tutorials & walkthroughs to illustrate how put responsible AI into practice
Responsible AI Workshop Responsible innovation is top of mind. As such, the tech industry as well as a growing number of organizations of all kinds in

A workshop on data visualization in Python with notebooks and exercises for following along.
Beyond the Basics: Data Visualization in Python The human brain excels at finding patterns in visual representations, which is why data visualizations

Soomvaar is the repo which 🏩 contains different collection of 👨💻🚀code in Python and 💫✨Machine 👬🏼 learning algorithms📗📕 that is made during 📃 my practice and learning of ML and Python✨💥
Soomvaar 📌 Introduction Soomvaar is the collection of various codes implement in machine learning and machine learning algorithms with python on coll

Create matplotlib visualizations from the command-line
MatplotCLI Create matplotlib visualizations from the command-line MatplotCLI is a simple utility to quickly create plots from the command-line, levera
Repository for DNN training, theory to practice, part of the Large Scale Machine Learning class at Mines Paritech
DNN Training, from theory to practice This repository is complementary to the deep learning training lesson given to les Mines ParisTech on the 11th o
Data Structures and Algorithms Python - Practice data structures and algorithms in python with few small projects
Data Structures and Algorithms All the essential resources and template code nee
Sci palettes for matplotlib/seaborn
sci palettes for matplotlib/seaborn Installation python3 -m pip install sci-palettes Usage import seaborn as sns import matplotlib.pyplot as plt impor

This repository contains some analysis of possible nerdle answers
Nerdle Analysis https://nerdlegame.com/ This repository contains some analysis of possible nerdle answers. Here's a quick overview: nerdle.py contains

A research of IT labor market based especially on hh.ru. Salaries, rate of technologies and etc.
hh_ru_research Проект реализован в учебных целях анализа рынка труда, в особенности по hh.ru Input data В качестве входных данных используются сериали
Automatization of BoxPlot graph usin Python MatPlotLib and Excel
BoxPlotGraphAutomation Automatization of BoxPlot graph usin Python / Excel. This file is an automation of BoxPlot-Graph using python graph library mat
1900-2016 Olympic Data Analysis in Python by plotting different graphs
🔥 Olympics Data Analysis 🔥 In Data Science field, there is a big topic before creating a model for future prediction is Data Analysis. We can find o

To-Be is a machine learning challenge on CodaLab Platform about Mortality Prediction
To-Be is a machine learning challenge on CodaLab Platform about Mortality Prediction. The challenge aims to adress the problems of medical imbalanced data classification.
Computer Vision Paper Reviews with Key Summary of paper, End to End Code Practice and Jupyter Notebook converted papers
Computer-Vision-Paper-Reviews Computer Vision Paper Reviews with Key Summary along Papers & Codes. Jonathan Choi 2021 The repository provides 100+ Pap
This is an API developed in python with the FastApi framework and putting into practice the recommendations of the book Clean Architecture in Python by Leonardo Giordani,
This is an API developed in python with the FastApi framework and putting into practice the recommendations of the book Clean Architecture in Python by Leonardo Giordani,

Color maps for POV-Ray v3.7 from the Plasma, Inferno, Magma and Viridis color maps in Python's Matplotlib
POV-Ray-color-maps Color maps for POV-Ray v3.7 from the Plasma, Inferno, Magma and Viridis color maps in Python's Matplotlib. The include file Color_M
Contains modeling practice materials and homework for the Computational Neuroscience course at Okinawa Institute of Science and Technology
A310 Computational Neuroscience - Okinawa Institute of Science and Technology, 2022 This repository contains modeling practice materials and homework

visualize_ML is a python package made to visualize some of the steps involved while dealing with a Machine Learning problem
visualize_ML visualize_ML is a python package made to visualize some of the steps involved while dealing with a Machine Learning problem. It is build

This is a Cricket Score Predictor that predicts the first innings score of a T20 Cricket match using Machine Learning
This is a Cricket Score Predictor that predicts the first innings score of a T20 Cricket match using Machine Learning. It is a Web Application.

Plot toolbox based on Matplotlib, simple and elegant.
Elegant-Plot Plot toolbox based on Matplotlib, simple and elegant. 绘制效果 绘制过程 数据准备 每种图标类型的目录下有data.csv文件,依据样例数据填入自己的数据。
Practice in Oxford_AI&ML class
Practice in Oxford_AI&ML class
Repo contains Python Code Reference to learn Python in a week, It also contains Machine Learning Algorithms and some examples for Practice, Also contains MySql, Tableau etc
DataScience_ML_and_Python Repo contains Python Code Reference to learn Python in a week, It also contains Machine Learning Algorithms and some example
Algorithms-in-Python - Programs related to DSA in Python for placement practice
Algorithms-in-Python Programs related to DSA in Python for placement practice CO

Pianote - An application that helps musicians practice piano ear training
Pianote Pianote is an application that helps musicians practice piano ear traini
100 Days of Code The Complete Python Pro Bootcamp for 2022
100-Day-With-Python 100 Days of Code - The Complete Python Pro Bootcamp for 2022. In this course, I spend with python language over 100 days, and I up
CoderByte | Practice, Tutorials & Interview Preparation Solutions|
CoderByte | Practice, Tutorials & Interview Preparation Solutions This repository consists of solutions to CoderByte practice, tutorials, and intervie

Best practices for segmentation of the corporate network of any company
Best-practice-for-network-segmentation What is this? This project was created to publish the best practices for segmentation of the corporate network

VDLdraw - Batch plot the log files exported from VisualDL using Matplotlib
VDLdraw Batch plot the log files exported from VisualDL using Matplotlib. At pre
The repository is my code for various types of data visualization cases based on the Matplotlib library.
ScienceGallery The repository is my code for various types of data visualization cases based on the Matplotlib library. It summarizes the code and cas
Python Machine Learning Jupyter Notebooks (ML website)
Python Machine Learning Jupyter Notebooks (ML website) Dr. Tirthajyoti Sarkar, Fremont, California (Please feel free to connect on LinkedIn here) Also

Displaying plot of death rates from past years in Poland. Data source from these years is in readme
Average-Death-Rate Displaying plot of death rates from past years in Poland The goal collect the data from a CSV file count the ADR (Average Death Rat
Exploratory Data Analysis of the 2019 Indian General Elections using a dataset from Kaggle.
2019-indian-election-eda Exploratory Data Analysis of the 2019 Indian General Elections using a dataset from Kaggle. This project is a part of the Cou
The RAP community of practice includes all analysts and data scientists who are interested in adopting the working practices included in reproducible analytical pipelines (RAP) at NHS Digital.
The RAP community of practice includes all analysts and data scientists who are interested in adopting the working practices included in reproducible analytical pipelines (RAP) at NHS Digital.
In this repo, I will put all the code related to data science using python libraries like Numpy, Pandas, Matplotlib, Seaborn and many more.
Python-for-DS In this repo, I will put all the code related to data science using python libraries like Numpy, Pandas, Matplotlib, Seaborn and many mo
The repository is about 100+ python programming exercise problem discussed, explained, and solved in different ways
Break The Ice With Python A journey of 100+ simple yet interesting problems which are explained, solved, discussed in different pythonic ways Introduc

Software Engineer Salary Prediction
Based on 2021 stack overflow data, this machine learning web application helps one predict the salary based on years of experience, level of education and the country they work in.
A site that displays up to date COVID-19 stats, powered by fastpages.
https://covid19dashboards.com This project was built with fastpages Background This project showcases how you can use fastpages to create a static das
Anatomy of Matplotlib -- tutorial developed for the SciPy conference
Introduction This tutorial is a complete re-imagining of how one should teach users the matplotlib library. Hopefully, this tutorial may serve as insp

Simulation du problème de Monty Hall avec Python et matplotlib
Le problème de Monty Hall C'est un jeu télévisé où il y a trois portes sur le plateau de jeu. Seule une de ces portes cache un trésor. Il n'y a rien d
Python’s bokeh, holoviews, matplotlib, plotly, seaborn package-based visualizations about COVID statistics eventually hosted as a web app on Heroku
COVID-Watch-NYC-Python-Visualization-App Python’s bokeh, holoviews, matplotlib, plotly, seaborn package-based visualizations about COVID statistics ev

Imutils - A series of convenience functions to make basic image processing operations such as translation, rotation, resizing, skeletonization, and displaying Matplotlib images easier with OpenCV and Python.
imutils A series of convenience functions to make basic image processing functions such as translation, rotation, resizing, skeletonization, and displ

Tensorflow-Project-Template - A best practice for tensorflow project template architecture.
Tensorflow Project Template A simple and well designed structure is essential for any Deep Learning project, so after a lot of practice and contributi
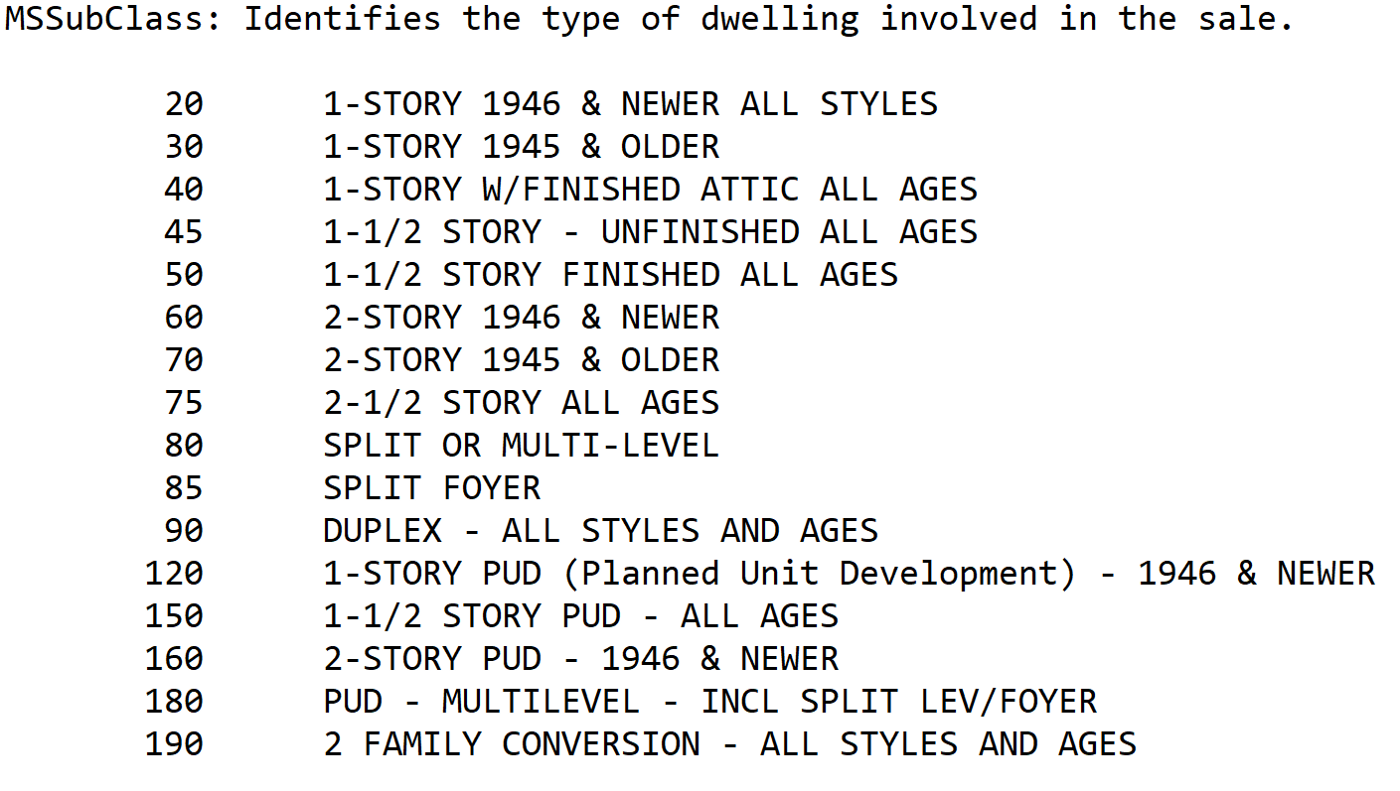
House_prices_kaggle - Predict sales prices and practice feature engineering, RFs, and gradient boosting
House Prices - Advanced Regression Techniques Predicting House Prices with Machine Learning This project is build to enhance my knowledge about machin

Optimizers-visualized - Visualization of different optimizers on local minimas and saddle points.
Optimizers Visualized Visualization of how different optimizers handle mathematical functions for optimization. Contents Installation Usage Functions

Houseprices - Predict sales prices and practice feature engineering, RFs, and gradient boosting
House Prices - Advanced Regression Techniques Predicting House Prices with Machine Learning This project is build to enhance my knowledge about machin
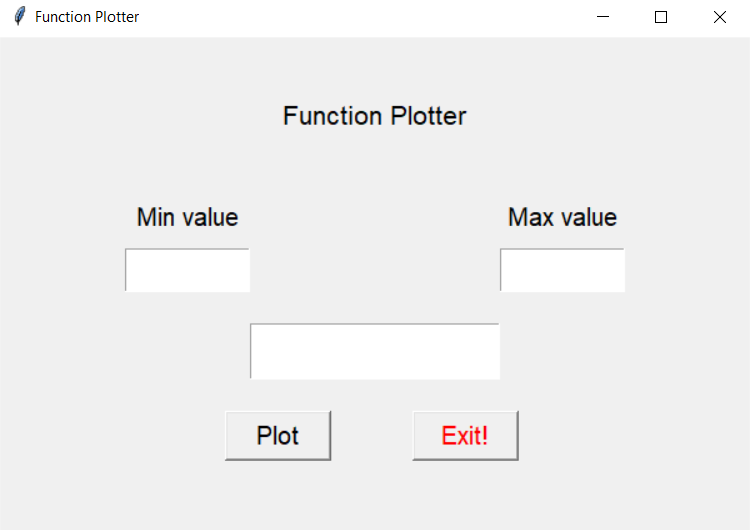
Function-Plotter - GUI Python program that plots functions that are entered by the user
FunctionPlotter GUI Python program that plots functions that are entered by the user. The program takes minimum and maximum value for x and plot it as

Img-process-manual - Utilize Python Numpy and Matplotlib to realize OpenCV baisc image processing function
Img-process-manual - Opencv Library basic graphic processing algorithm coding reproduction based on Numpy and Matplotlib library
Numerical Methods with Python, Numpy and Matplotlib
Numerical Bric-a-Brac Collections of numerical techniques with Python and standard computational packages (Numpy, SciPy, Numba, Matplotlib ...). Diffe
This Jupyter notebook shows one way to implement a simple first-order low-pass filter on sampled data in discrete time.
How to Implement a First-Order Low-Pass Filter in Discrete Time We often teach or learn about filters in continuous time, but then need to implement t

3D-Lorenz-Attractor-simulation-with-python
3D-Lorenz-Attractor-simulation-with-python Animação 3D da trajetória do Atrator de Lorenz, implementada em Python usando o método de Runge-Kutta de 4ª

A simple interpreted language for creating basic mathematical graphs.
graphr Introduction graphr is a small language written to create basic mathematical graphs. It is an interpreted language written in python and essent
Using multiple API sources, create an app that allows users to filter through random locations based on their temperature range choices.
World_weather_analysis Overview Using multiple API sources, create an app that allows users to filter through random locations based on their temperat
Python Moonlight (Machine Learning) Practice
PyML Python Moonlight (Machine Learning) Practice Contents Design Documentation Prerequisites Checklist Dev Setup Testing Run Prerequisites Python 3 P
Python programs, usually short, of considerable difficulty, to perfect particular skills.
Peter Norvig MIT License 2015-2020 pytudes "An étude (a French word meaning study) is an instrumental musical composition, usually short, of considera

Fastapi practice project
todo-list-fastapi practice project How to run Install dependencies npm, yarn: standard-version, husky make: script for lint, test pipenv: virtualenv +

The plottify package is makes matplotlib plots more legible
plottify The plottify package is makes matplotlib plots more legible. It's a thin wrapper around matplotlib that automatically adjusts font sizes, sca

A toolkit to generate MR sequence diagrams
mrsd: a toolkit to generate MR sequence diagrams mrsd is a Python toolkit to generate MR sequence diagrams, as shown below for the basic FLASH sequenc
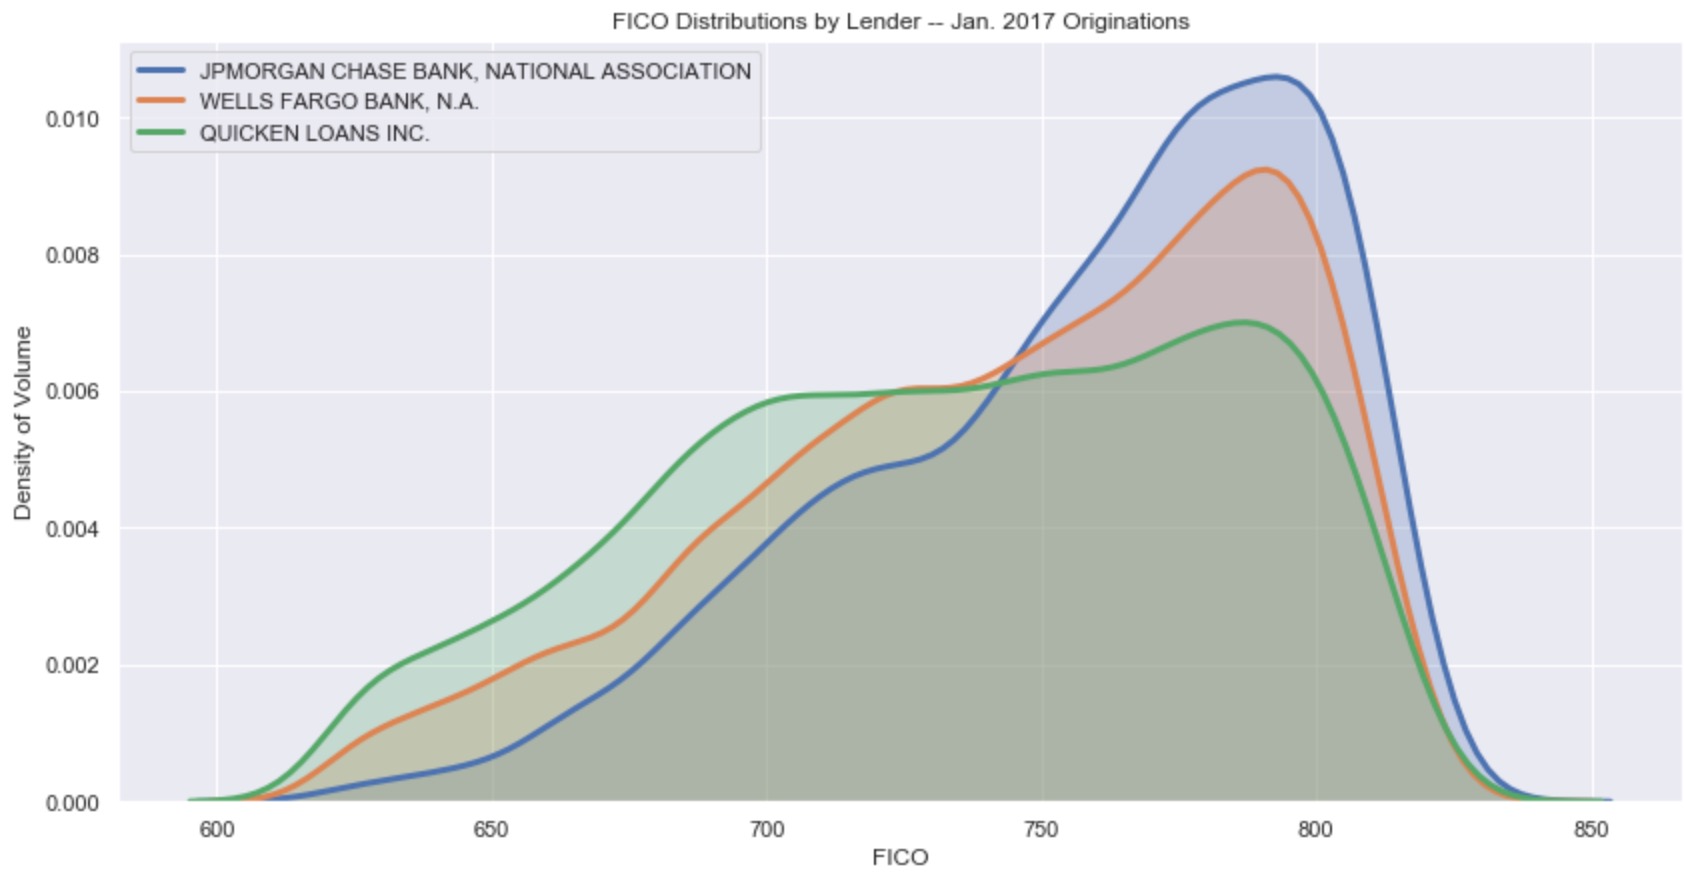
Resources for teaching & learning practical data visualization with python.
Practical Data Visualization with Python Overview All views expressed on this site are my own and do not represent the opinions of any entity with whi

Typing Game : from nob to good
Fast and Curious A game to learn/improve keyboard typing skills. The main idea is to improve your typing skills and at the same time learn fun facts (

Example Code Notebooks for Data Visualization in Python
This repository contains sample code scripts for creating awesome data visualizations from scratch using different python libraries (such as matplotli

Create a table with row explanations, column headers, using matplotlib
Create a table with row explanations, column headers, using matplotlib. Intended usage was a small table containing a custom heatmap.
Repository for Comparison based sorting algorithms in python
Repository for Comparison based sorting algorithms in python. This was implemented for project one submission for ITCS 6114 Data Structures and Algorithms under the guidance of Dr. Dewan at the University of North Carolina at Charlotte, Fall 2021.
Functions for easily making publication-quality figures with matplotlib.
Data-viz utils 📈 Functions for data visualization in matplotlib 📚 API Can be installed using pip install dvu and then imported with import dvu. You
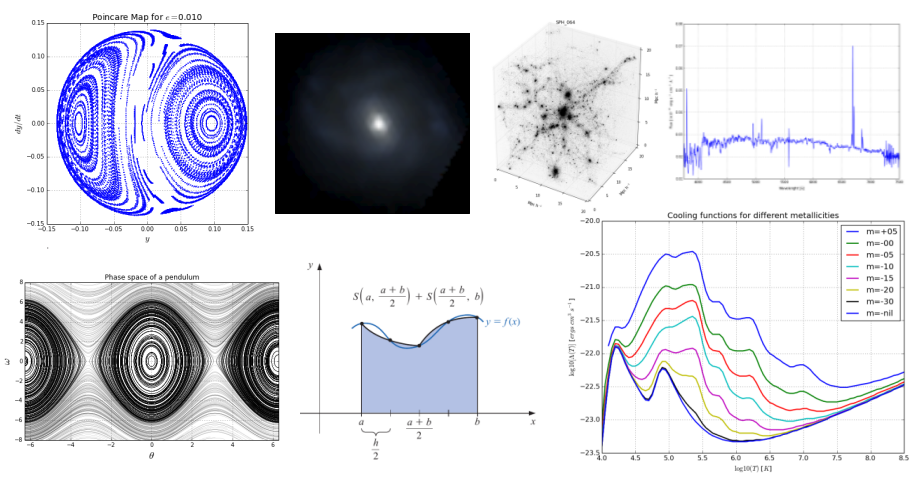
Computational Methods Course at UdeA. Forked and size reduced from:
Computational Methods for Physics & Astronomy Book version at: https://restrepo.github.io/ComputationalMethods by: Sebastian Bustamante 2014/2015 Dieg

Monochromatic colorscheme for matplotlib with opinionated sensible default
Monochromatic colorscheme for matplotlib with opinionated sensible default If you need a simple monochromatic colorscheme for your matplotlib figures,

Practice the use of the random library to get the user guess the result.
Guessing Game Practice the use of the random library to get the user guess the result. Additional description about the project and its features. Buil
Distributed algorithms, reimplemented for fun and practice
Distributed Algorithms Playground for reimplementing and experimenting with algorithms for distributed computing. Usage Running the code for Ring-AllR

A simple Monte Carlo simulation using Python and matplotlib library
Monte Carlo python simulation Install linux dependencies sudo apt update sudo apt install build-essential \ software-properties-commo
Typing test and practice on command line without the need of any internet connection
Terminal-Typing-Test Typing test and practice on command line without the need of any internet connection About CLI based typing test and practice tha

Fractals plotted on MatPlotLib in Python.
About The Project Learning more about fractals through the process of visualization. Built With Matplotlib Numpy License This project is licensed unde
Continuously update some NLP practice based on different tasks.
NLP_practice We will continuously update some NLP practice based on different tasks. prerequisites Software pytorch = 1.10 torchtext = 0.11.0 sklear
Plot-configurations for scientific publications, purely based on matplotlib
TUEplots Plot-configurations for scientific publications, purely based on matplotlib. Usage Please have a look at the examples in the example/ directo

Functions to analyze Cell-ID single-cell cytometry data using python language.
PyCellID (building...) Functions to analyze Cell-ID single-cell cytometry data using python language. Dependecies for this project. attrs(=21.1.0) fo
🌀❄️🌩️ This repository contains some examples for creating 2d and 3d weather plots using matplotlib and cartopy libraries in python3.
Weather-Plotting 🌀 ❄️ 🌩️ This repository contains some examples for creating 2d and 3d weather plots using matplotlib and cartopy libraries in pytho

A simple python script using Numpy and Matplotlib library to plot a Mohr's Circle when given a two-dimensional state of stress.
Mohr's Circle Calculator This is a really small personal project done for Department of Civil Engineering, Delhi Technological University (formerly, D
My beancount practice as a template
my-beancount-template 个人 Beancount 方案的模板仓库 相关博客 复式记账指北(一):What and Why? 复式记账指北(二):做账方法论 复式记账指北(三):如何打造不半途而废的记账方案 配置 详细配置请参考博客三。必须修改的配置有: Bot功能:data/be

The official colors of the FAU as matplotlib/seaborn colormaps
FAU - Colors The official colors of Friedrich-Alexander-Universität Erlangen-Nürnberg (FAU) as matplotlib / seaborn colormaps. We support the old colo
Practice-python is a simple Fast api project for dealing with modern rest api technologies.
Practice Python Practice-python is a simple Fast api project for dealing with modern rest api technologies. Deployment with docker Go to the project r
A Python-based non-fungible token (NFT) generator built using Samilla and Matplotlib
PyNFT A Pythonic NF (non-fungible token) generator built using Samilla and Matplotlib Use python pynft.py [amount] The intention behind this generato
School of Artificial Intelligence at the Nanjing University (NJU)School of Artificial Intelligence at the Nanjing University (NJU)
F-Principle This is an exercise problem of the digital signal processing (DSP) course at School of Artificial Intelligence at the Nanjing University (

A small collection of tools made by me, that you can use to visualize atomic orbitals in both 2D and 3D in different aspects.
Orbitals in Python A small collection of tools made by me, that you can use to visualize atomic orbitals in both 2D and 3D in different aspects, and o
Web scraped S&P 500 Data from Wikipedia using Pandas and performed Exploratory Data Analysis on the data.
Web scraped S&P 500 Data from Wikipedia using Pandas and performed Exploratory Data Analysis on the data. Then used Yahoo Finance to get the related stock data and displayed them in the form of charts.
Area-weighted venn-diagrams for Python/matplotlib
Venn diagram plotting routines for Python/Matplotlib Routines for plotting area-weighted two- and three-circle venn diagrams. Installation The simples

Fast scatter density plots for Matplotlib
About Plotting millions of points can be slow. Real slow... 😴 So why not use density maps? ⚡ The mpl-scatter-density mini-package provides functional

A set of useful perceptually uniform colormaps for plotting scientific data
Colorcet: Collection of perceptually uniform colormaps Build Status Coverage Latest dev release Latest release Docs What is it? Colorcet is a collecti

Projeto: Machine Learning: Linguagens de Programacao 2004-2001
Projeto: Machine Learning: Linguagens de Programacao 2004-2001 Projeto de Data Science e Machine Learning de análise de linguagens de programação de 2

Predicting the usefulness of reviews given the review text and metadata surrounding the reviews.
Predicting Yelp Review Quality Table of Contents Introduction Motivation Goal and Central Questions The Data Data Storage and ETL EDA Data Pipeline Da

Python Data Science Handbook: full text in Jupyter Notebooks
Python Data Science Handbook This repository contains the entire Python Data Science Handbook, in the form of (free!) Jupyter notebooks. How to Use th

Matplotlib JOTA style for making figures
Matplotlib JOTA style for making figures This repo has Matplotlib JOTA style to format plots and figures for publications and presentation.
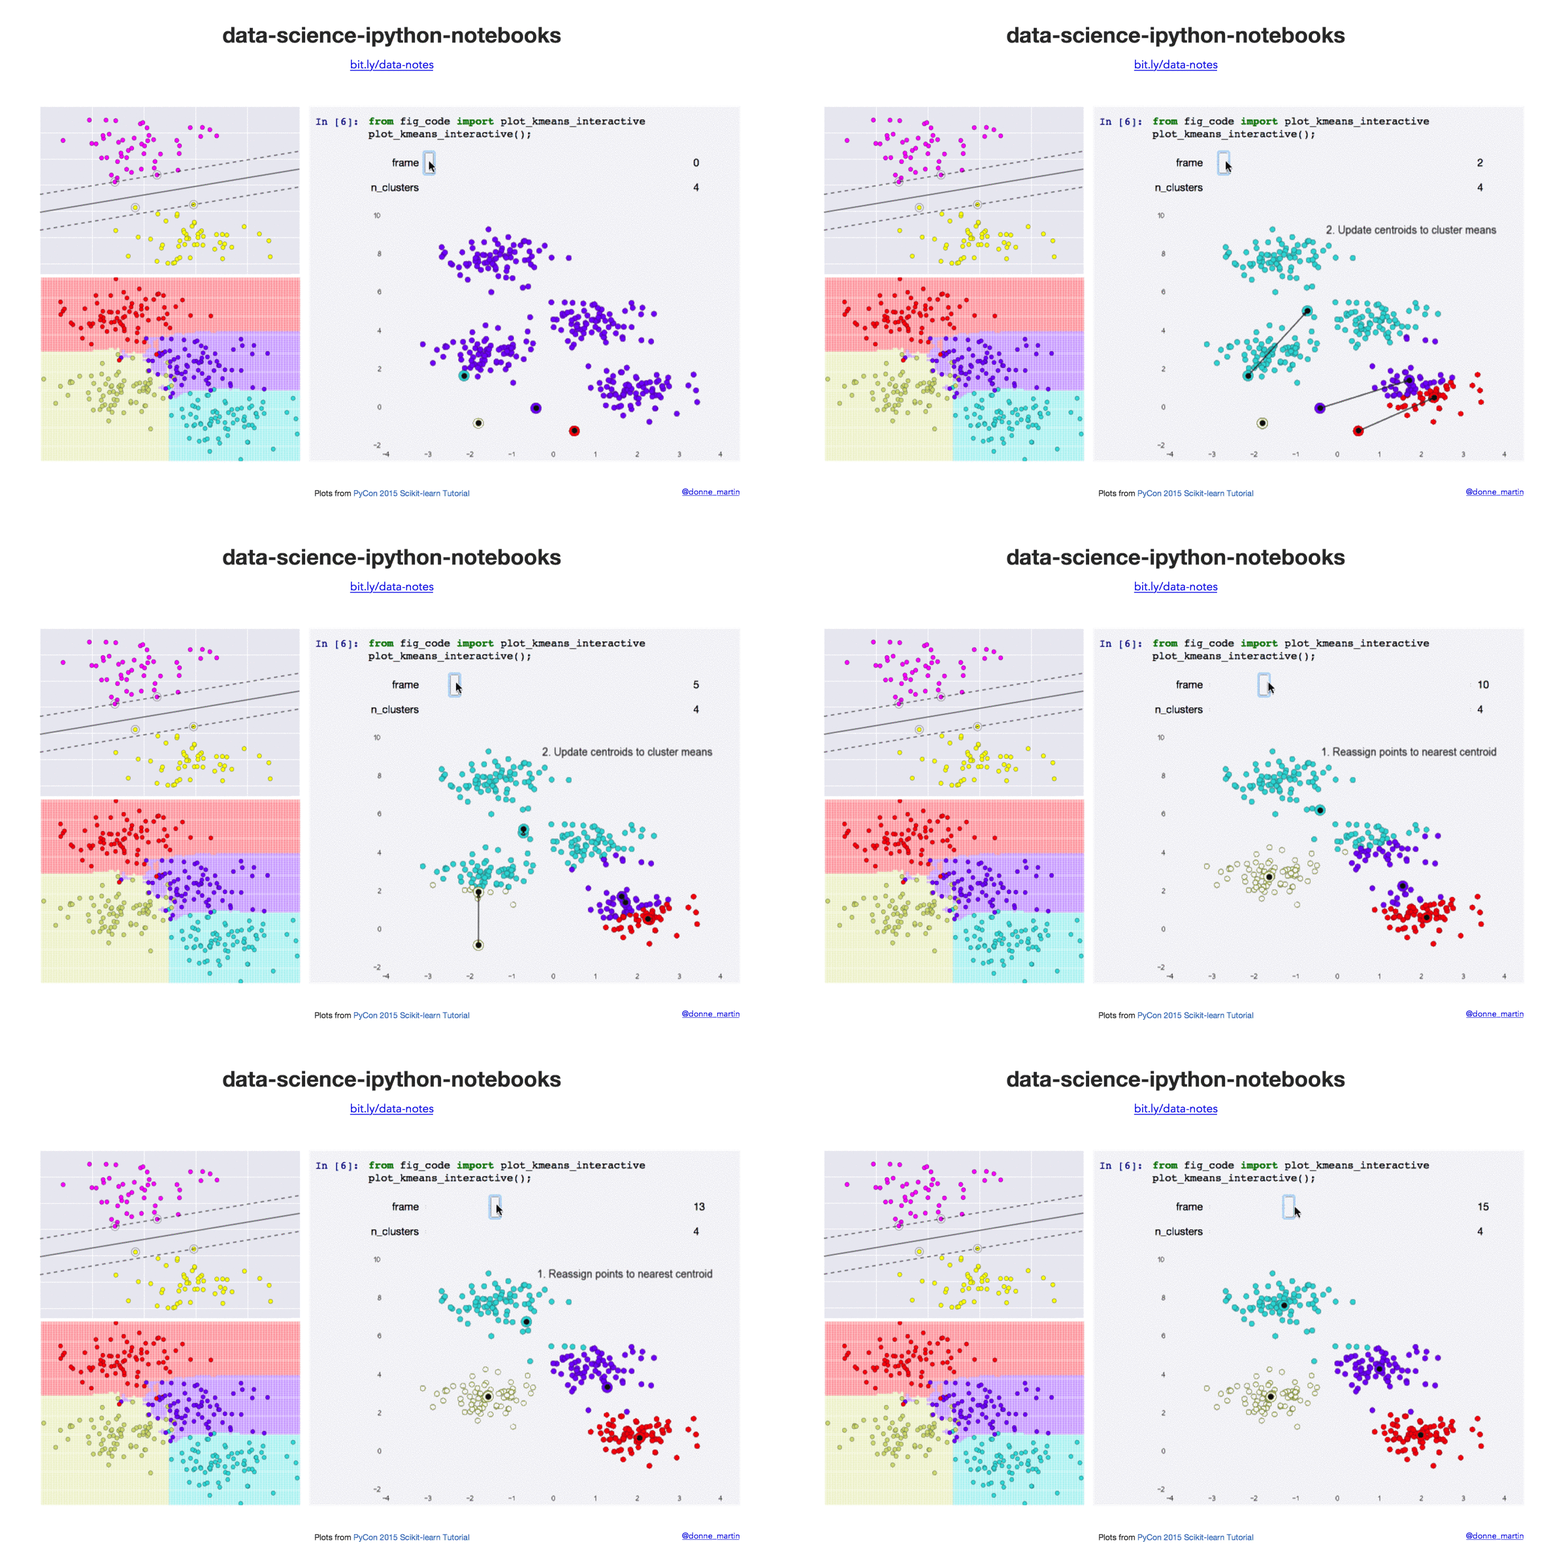
Data science Python notebooks: Deep learning (TensorFlow, Theano, Caffe, Keras), scikit-learn, Kaggle, big data (Spark, Hadoop MapReduce, HDFS), matplotlib, pandas, NumPy, SciPy, Python essentials, AWS, and various command lines.
Data science Python notebooks: Deep learning (TensorFlow, Theano, Caffe, Keras), scikit-learn, Kaggle, big data (Spark, Hadoop MapReduce, HDFS), matplotlib, pandas, NumPy, SciPy, Python essentials, AWS, and various command lines.

Scientific Visualization: Python + Matplotlib
An open access book on scientific visualization using python and matplotlib

MagTape is a Policy-as-Code tool for Kubernetes that allows for evaluating Kubernetes resources against a set of defined policies to inform and enforce best practice configurations.
MagTape is a Policy-as-Code tool for Kubernetes that allows for evaluating Kubernetes resources against a set of defined policies to inform and enforce best practice configurations. MagTape includes variable policy enforcement, notifications, and targeted metrics.

patchwork for matplotlib
patchworklib patchwork for matplotlib test code Preparation of example plots import seaborn as sns import numpy as np import pandas as pd #Bri

A Python 3.6+ package to run .many files, where many programs written in many languages may exist in one file.
RunMany Intro | Installation | VSCode Extension | Usage | Syntax | Settings | About A tool to run many programs written in many languages from one fil

MPL Plotter is a Matplotlib based Python plotting library built with the goal of delivering publication-quality plots concisely.
MPL Plotter is a Matplotlib based Python plotting library built with the goal of delivering publication-quality plots concisely.

Playwright Python tool practice pytest pytest-bdd screen-play page-object allure cucumber-report
pytest-ui-automatic Playwright Python tool practice pytest pytest-bdd screen-play page-object allure cucumber-report How to run Run tests execute_test

Matplotlib Image labeller for classifying images
mpl-image-labeller Use Matplotlib to label images for classification. Works anywhere Matplotlib does - from the notebook to a standalone gui! For more
A selection of SQLite3 databases to practice querying from.
Dummy SQL Databases This is a collection of dummy SQLite3 databases, for learning and practicing SQL querying, generated with the VS Code extension Ge

Decision Border Visualizer for Classification Algorithms
dbv Decision Border Visualizer for Classification Algorithms Project description A python package for Machine Learning Engineers who want to visualize