698 Repositories
Python keras-visualization Libraries
Kashgari is a production-level NLP Transfer learning framework built on top of tf.keras for text-labeling and text-classification, includes Word2Vec, BERT, and GPT2 Language Embedding.
Kashgari Overview | Performance | Installation | Documentation | Contributing 🎉 🎉 🎉 We released the 2.0.0 version with TF2 Support. 🎉 🎉 🎉 If you
Sequence-to-sequence framework with a focus on Neural Machine Translation based on Apache MXNet
Sockeye This package contains the Sockeye project, an open-source sequence-to-sequence framework for Neural Machine Translation based on Apache MXNet

Text preprocessing, representation and visualization from zero to hero.
Text preprocessing, representation and visualization from zero to hero. From zero to hero • Installation • Getting Started • Examples • API • FAQ • Co
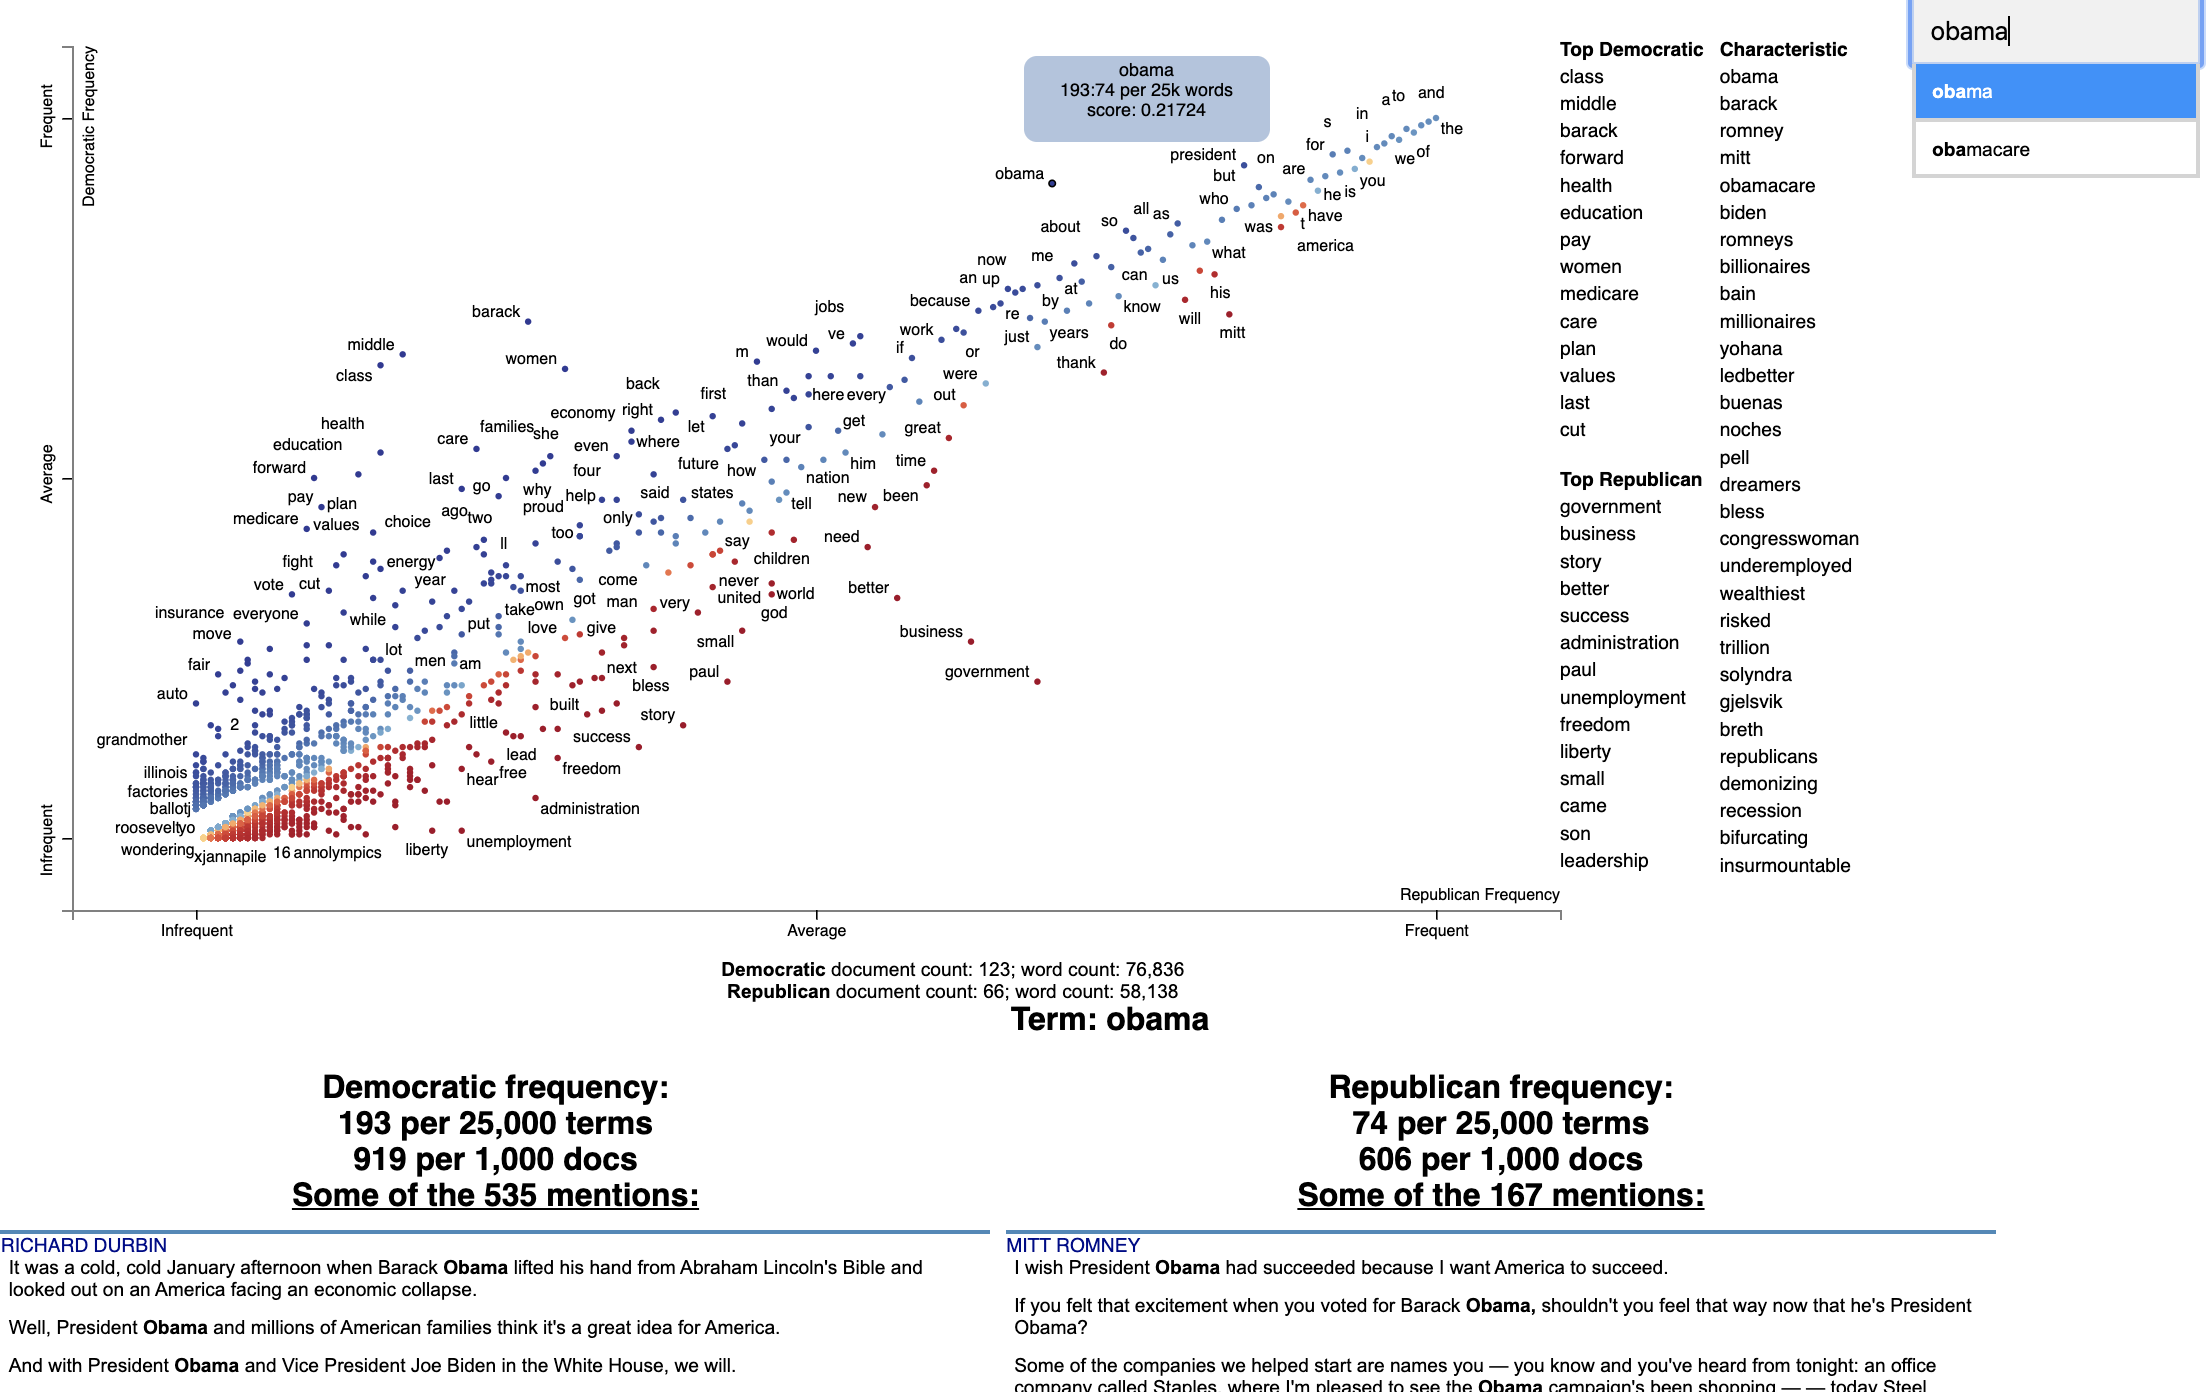
Beautiful visualizations of how language differs among document types.
Scattertext 0.1.0.0 A tool for finding distinguishing terms in corpora and displaying them in an interactive HTML scatter plot. Points corresponding t

Easily train your own text-generating neural network of any size and complexity on any text dataset with a few lines of code.
textgenrnn Easily train your own text-generating neural network of any size and complexity on any text dataset with a few lines of code, or quickly tr

Dimensionality reduction in very large datasets using Siamese Networks
ivis Implementation of the ivis algorithm as described in the paper Structure-preserving visualisation of high dimensional single-cell datasets. Ivis
🧇 Make Waffle Charts in Python.
PyWaffle PyWaffle is an open source, MIT-licensed Python package for plotting waffle charts. It provides a Figure constructor class Waffle, which coul

Automatically Visualize any dataset, any size with a single line of code. Created by Ram Seshadri. Collaborators Welcome. Permission Granted upon Request.
AutoViz Automatically Visualize any dataset, any size with a single line of code. AutoViz performs automatic visualization of any dataset with one lin

A python package for animating plots build on matplotlib.
animatplot A python package for making interactive as well as animated plots with matplotlib. Requires Python = 3.5 Matplotlib = 2.2 (because slider

An open-source plotting library for statistical data.
Lets-Plot Lets-Plot is an open-source plotting library for statistical data. It is implemented using the Kotlin programming language. The design of Le
Visualize and compare datasets, target values and associations, with one line of code.
In-depth EDA (target analysis, comparison, feature analysis, correlation) in two lines of code! Sweetviz is an open-source Python library that generat

Joyplots in Python with matplotlib & pandas :chart_with_upwards_trend:
JoyPy JoyPy is a one-function Python package based on matplotlib + pandas with a single purpose: drawing joyplots (a.k.a. ridgeline plots). The code f

Extensible, parallel implementations of t-SNE
openTSNE openTSNE is a modular Python implementation of t-Distributed Stochasitc Neighbor Embedding (t-SNE) [1], a popular dimensionality-reduction al

Visualizations for machine learning datasets
Introduction The facets project contains two visualizations for understanding and analyzing machine learning datasets: Facets Overview and Facets Dive
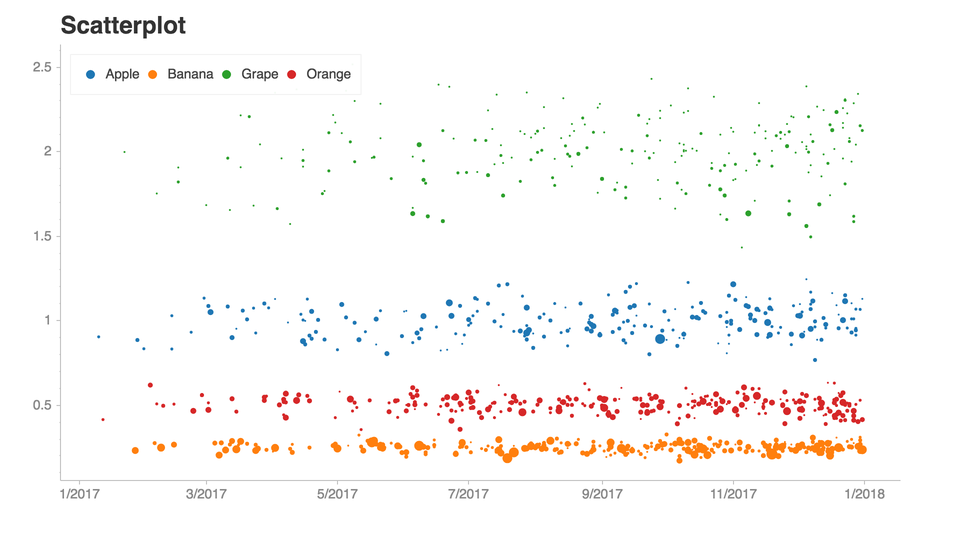
Python library that makes it easy for data scientists to create charts.
Chartify Chartify is a Python library that makes it easy for data scientists to create charts. Why use Chartify? Consistent input data format: Spend l

A Python toolbox for gaining geometric insights into high-dimensional data
"To deal with hyper-planes in a 14 dimensional space, visualize a 3D space and say 'fourteen' very loudly. Everyone does it." - Geoff Hinton Overview

3D plotting and mesh analysis through a streamlined interface for the Visualization Toolkit (VTK)
PyVista Deployment Build Status Metrics Citation License Community 3D plotting and mesh analysis through a streamlined interface for the Visualization
Streaming pivot visualization via WebAssembly
Perspective is an interactive visualization component for large, real-time datasets. Originally developed for J.P. Morgan's trading business, Perspect
Missing data visualization module for Python.
missingno Messy datasets? Missing values? missingno provides a small toolset of flexible and easy-to-use missing data visualizations and utilities tha
Main repository for Vispy
VisPy: interactive scientific visualization in Python Main website: http://vispy.org VisPy is a high-performance interactive 2D/3D data visualization
Fast data visualization and GUI tools for scientific / engineering applications
PyQtGraph A pure-Python graphics library for PyQt5/PyQt6/PySide2/PySide6 Copyright 2020 Luke Campagnola, University of North Carolina at Chapel Hill h

Uniform Manifold Approximation and Projection
UMAP Uniform Manifold Approximation and Projection (UMAP) is a dimension reduction technique that can be used for visualisation similarly to t-SNE, bu

Declarative statistical visualization library for Python
Altair http://altair-viz.github.io Altair is a declarative statistical visualization library for Python. With Altair, you can spend more time understa
Interactive Data Visualization in the browser, from Python
Bokeh is an interactive visualization library for modern web browsers. It provides elegant, concise construction of versatile graphics, and affords hi

Analytical Web Apps for Python, R, Julia, and Jupyter. No JavaScript Required.
Dash Dash is the most downloaded, trusted Python framework for building ML & data science web apps. Built on top of Plotly.js, React and Flask, Dash t
Statistical data visualization using matplotlib
seaborn: statistical data visualization Seaborn is a Python visualization library based on matplotlib. It provides a high-level interface for drawing

The interactive graphing library for Python (includes Plotly Express) :sparkles:
plotly.py Latest Release User forum PyPI Downloads License Data Science Workspaces Our recommended IDE for Plotly’s Python graphing library is Dash En
kapre: Keras Audio Preprocessors
Kapre Keras Audio Preprocessors - compute STFT, ISTFT, Melspectrogram, and others on GPU real-time. Tested on Python 3.6 and 3.7 Why Kapre? vs. Pre-co
Keras implementation of Normalizer-Free Networks and SGD - Adaptive Gradient Clipping
Keras implementation of Normalizer-Free Networks and SGD - Adaptive Gradient Clipping
这是一个mobilenet-yolov4-lite的库,把yolov4主干网络修改成了mobilenet,修改了Panet的卷积组成,使参数量大幅度缩小。
YOLOV4:You Only Look Once目标检测模型-修改mobilenet系列主干网络-在Keras当中的实现 2021年2月8日更新: 加入letterbox_image的选项,关闭letterbox_image后网络的map一般可以得到提升。

Bidirectional LSTM-CRF and ELMo for Named-Entity Recognition, Part-of-Speech Tagging and so on.
anaGo anaGo is a Python library for sequence labeling(NER, PoS Tagging,...), implemented in Keras. anaGo can solve sequence labeling tasks such as nam
Kashgari is a production-level NLP Transfer learning framework built on top of tf.keras for text-labeling and text-classification, includes Word2Vec, BERT, and GPT2 Language Embedding.
Kashgari Overview | Performance | Installation | Documentation | Contributing 🎉 🎉 🎉 We released the 2.0.0 version with TF2 Support. 🎉 🎉 🎉 If you
Sequence-to-sequence framework with a focus on Neural Machine Translation based on Apache MXNet
Sockeye This package contains the Sockeye project, an open-source sequence-to-sequence framework for Neural Machine Translation based on Apache MXNet

Text preprocessing, representation and visualization from zero to hero.
Text preprocessing, representation and visualization from zero to hero. From zero to hero • Installation • Getting Started • Examples • API • FAQ • Co

Beautiful visualizations of how language differs among document types.
Scattertext 0.1.0.0 A tool for finding distinguishing terms in corpora and displaying them in an interactive HTML scatter plot. Points corresponding t

Easily train your own text-generating neural network of any size and complexity on any text dataset with a few lines of code.
textgenrnn Easily train your own text-generating neural network of any size and complexity on any text dataset with a few lines of code, or quickly tr

Dimensionality reduction in very large datasets using Siamese Networks
ivis Implementation of the ivis algorithm as described in the paper Structure-preserving visualisation of high dimensional single-cell datasets. Ivis
🧇 Make Waffle Charts in Python.
PyWaffle PyWaffle is an open source, MIT-licensed Python package for plotting waffle charts. It provides a Figure constructor class Waffle, which coul

Automatically Visualize any dataset, any size with a single line of code. Created by Ram Seshadri. Collaborators Welcome. Permission Granted upon Request.
AutoViz Automatically Visualize any dataset, any size with a single line of code. AutoViz performs automatic visualization of any dataset with one lin

A python package for animating plots build on matplotlib.
animatplot A python package for making interactive as well as animated plots with matplotlib. Requires Python = 3.5 Matplotlib = 2.2 (because slider

An open-source plotting library for statistical data.
Lets-Plot Lets-Plot is an open-source plotting library for statistical data. It is implemented using the Kotlin programming language. The design of Le
Visualize and compare datasets, target values and associations, with one line of code.
In-depth EDA (target analysis, comparison, feature analysis, correlation) in two lines of code! Sweetviz is an open-source Python library that generat

Joyplots in Python with matplotlib & pandas :chart_with_upwards_trend:
JoyPy JoyPy is a one-function Python package based on matplotlib + pandas with a single purpose: drawing joyplots (a.k.a. ridgeline plots). The code f

Extensible, parallel implementations of t-SNE
openTSNE openTSNE is a modular Python implementation of t-Distributed Stochasitc Neighbor Embedding (t-SNE) [1], a popular dimensionality-reduction al

Visualizations for machine learning datasets
Introduction The facets project contains two visualizations for understanding and analyzing machine learning datasets: Facets Overview and Facets Dive

Python library that makes it easy for data scientists to create charts.
Chartify Chartify is a Python library that makes it easy for data scientists to create charts. Why use Chartify? Consistent input data format: Spend l

A Python toolbox for gaining geometric insights into high-dimensional data
"To deal with hyper-planes in a 14 dimensional space, visualize a 3D space and say 'fourteen' very loudly. Everyone does it." - Geoff Hinton Overview

3D plotting and mesh analysis through a streamlined interface for the Visualization Toolkit (VTK)
PyVista Deployment Build Status Metrics Citation License Community 3D plotting and mesh analysis through a streamlined interface for the Visualization
Streaming pivot visualization via WebAssembly
Perspective is an interactive visualization component for large, real-time datasets. Originally developed for J.P. Morgan's trading business, Perspect
Missing data visualization module for Python.
missingno Messy datasets? Missing values? missingno provides a small toolset of flexible and easy-to-use missing data visualizations and utilities tha
Main repository for Vispy
VisPy: interactive scientific visualization in Python Main website: http://vispy.org VisPy is a high-performance interactive 2D/3D data visualization
Fast data visualization and GUI tools for scientific / engineering applications
PyQtGraph A pure-Python graphics library for PyQt5/PyQt6/PySide2/PySide6 Copyright 2020 Luke Campagnola, University of North Carolina at Chapel Hill h

Uniform Manifold Approximation and Projection
UMAP Uniform Manifold Approximation and Projection (UMAP) is a dimension reduction technique that can be used for visualisation similarly to t-SNE, bu

Declarative statistical visualization library for Python
Altair http://altair-viz.github.io Altair is a declarative statistical visualization library for Python. With Altair, you can spend more time understa
Interactive Data Visualization in the browser, from Python
Bokeh is an interactive visualization library for modern web browsers. It provides elegant, concise construction of versatile graphics, and affords hi

Analytical Web Apps for Python, R, Julia, and Jupyter. No JavaScript Required.
Dash Dash is the most downloaded, trusted Python framework for building ML & data science web apps. Built on top of Plotly.js, React and Flask, Dash t
Statistical data visualization using matplotlib
seaborn: statistical data visualization Seaborn is a Python visualization library based on matplotlib. It provides a high-level interface for drawing

The interactive graphing library for Python (includes Plotly Express) :sparkles:
plotly.py Latest Release User forum PyPI Downloads License Data Science Workspaces Our recommended IDE for Plotly’s Python graphing library is Dash En
ktrain is a Python library that makes deep learning and AI more accessible and easier to apply
Overview | Tutorials | Examples | Installation | FAQ | How to Cite Welcome to ktrain News and Announcements 2020-11-08: ktrain v0.25.x is released and
Deep learning operations reinvented (for pytorch, tensorflow, jax and others)
This video in better quality. einops Flexible and powerful tensor operations for readable and reliable code. Supports numpy, pytorch, tensorflow, and
Visual profiler for Python
vprof vprof is a Python package providing rich and interactive visualizations for various Python program characteristics such as running time and memo

Web mining module for Python, with tools for scraping, natural language processing, machine learning, network analysis and visualization.
Pattern Pattern is a web mining module for Python. It has tools for: Data Mining: web services (Google, Twitter, Wikipedia), web crawler, HTML DOM par
🏆 A ranked list of awesome machine learning Python libraries. Updated weekly.
Best-of Machine Learning with Python 🏆 A ranked list of awesome machine learning Python libraries. Updated weekly. This curated list contains 840 awe

curl statistics made simple
httpstat httpstat visualizes curl(1) statistics in a way of beauty and clarity. It is a single file 🌟 Python script that has no dependency 👏 and is
🎨 Python3 binding for `@AntV/G2Plot` Plotting Library .
PyG2Plot 🎨 Python3 binding for @AntV/G2Plot which an interactive and responsive charting library. Based on the grammar of graphics, you can easily ma

Python script to generate a visualization of various sorting algorithms, image or video.
sorting_algo_visualizer Python script to generate a visualization of various sorting algorithms, image or video.
Graphing communities on Twitch.tv in a visually intuitive way
VisualizingTwitchCommunities This project maps communities of streamers on Twitch.tv based on shared viewership. The data is collected from the Twitch

Age and Gender prediction using Keras
cnn_age_gender Age and Gender prediction using Keras Dataset example : Description : UTKFace dataset is a large-scale face dataset with long age span

The fastest way to visualize GradCAM with your Keras models.
VizGradCAM VizGradCam is the fastest way to visualize GradCAM in Keras models. GradCAM helps with providing visual explainability of trained models an

An end-to-end machine learning web app to predict rugby scores (Pandas, SQLite, Keras, Flask, Docker)
Rugby score prediction An end-to-end machine learning web app to predict rugby scores Overview An demo project to provide a high-level overview of the
Spectrum is an AI that uses machine learning to generate Rap song lyrics
Spectrum Spectrum is an AI that uses deep learning to generate rap song lyrics. View Demo Report Bug Request Feature Open In Colab About The Project S
Backtest 1000s of minute-by-minute trading algorithms for training AI with automated pricing data from: IEX, Tradier and FinViz. Datasets and trading performance automatically published to S3 for building AI training datasets for teaching DNNs how to trade. Runs on Kubernetes and docker-compose. 150 million trading history rows generated from +5000 algorithms. Heads up: Yahoo's Finance API was disabled on 2019-01-03 https://developer.yahoo.com/yql/
Stock Analysis Engine Build and tune investment algorithms for use with artificial intelligence (deep neural networks) with a distributed stack for ru

Debugging, monitoring and visualization for Python Machine Learning and Data Science
Welcome to TensorWatch TensorWatch is a debugging and visualization tool designed for data science, deep learning and reinforcement learning from Micr

Analytical Web Apps for Python, R, Julia, and Jupyter. No JavaScript Required.
Dash Dash is the most downloaded, trusted Python framework for building ML & data science web apps. Built on top of Plotly.js, React and Flask, Dash t

:bowtie: Create a dashboard with python!
Installation | Documentation | Gitter Chat | Google Group Bowtie Introduction Bowtie is a library for writing dashboards in Python. No need to know we

An intuitive library to add plotting functionality to scikit-learn objects.
Welcome to Scikit-plot Single line functions for detailed visualizations The quickest and easiest way to go from analysis... ...to this. Scikit-plot i

Apache Superset is a Data Visualization and Data Exploration Platform
Superset A modern, enterprise-ready business intelligence web application. Why Superset? | Supported Databases | Installation and Configuration | Rele
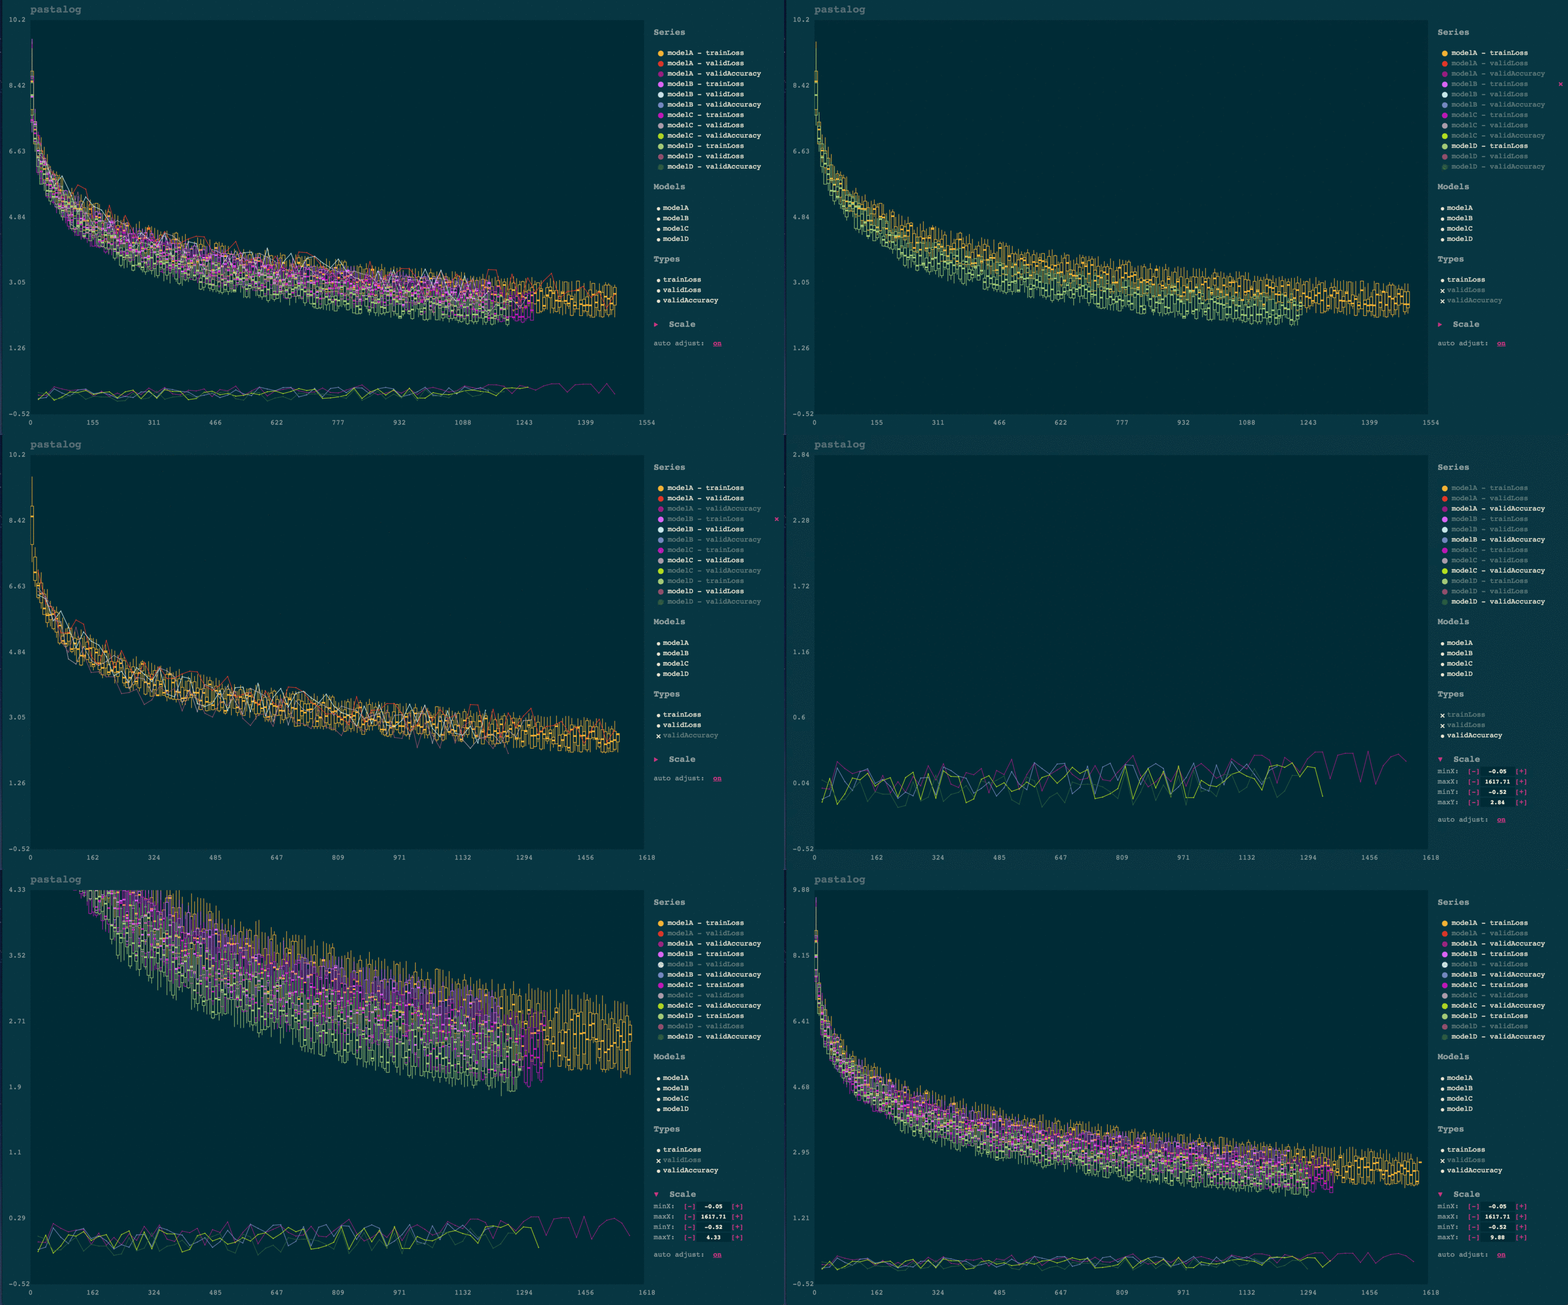
Simple, realtime visualization of neural network training performance.
pastalog Simple, realtime visualization server for training neural networks. Use with Lasagne, Keras, Tensorflow, Torch, Theano, and basically everyth
Fast data visualization and GUI tools for scientific / engineering applications
PyQtGraph A pure-Python graphics library for PyQt5/PyQt6/PySide2/PySide6 Copyright 2020 Luke Campagnola, University of North Carolina at Chapel Hill h

A Python package implementing a new model for text classification with visualization tools for Explainable AI :octocat:
A Python package implementing a new model for text classification with visualization tools for Explainable AI 🍣 Online live demos: http://tworld.io/s

Web mining module for Python, with tools for scraping, natural language processing, machine learning, network analysis and visualization.
Pattern Pattern is a web mining module for Python. It has tools for: Data Mining: web services (Google, Twitter, Wikipedia), web crawler, HTML DOM par

Create UIs for prototyping your machine learning model in 3 minutes
Note: We just launched Hosted, where anyone can upload their interface for permanent hosting. Check it out! Welcome to Gradio Quickly create customiza

Visualizer for neural network, deep learning, and machine learning models
Netron is a viewer for neural network, deep learning and machine learning models. Netron supports ONNX (.onnx, .pb, .pbtxt), Keras (.h5, .keras), Tens
Image-to-Image Translation with Conditional Adversarial Networks (Pix2pix) implementation in keras
pix2pix-keras Pix2pix implementation in keras. Original paper: Image-to-Image Translation with Conditional Adversarial Networks (pix2pix) Paper Author

Web mining module for Python, with tools for scraping, natural language processing, machine learning, network analysis and visualization.
Pattern Pattern is a web mining module for Python. It has tools for: Data Mining: web services (Google, Twitter, Wikipedia), web crawler, HTML DOM par
[UNMAINTAINED] Automated machine learning for analytics & production
auto_ml Automated machine learning for production and analytics Installation pip install auto_ml Getting started from auto_ml import Predictor from au
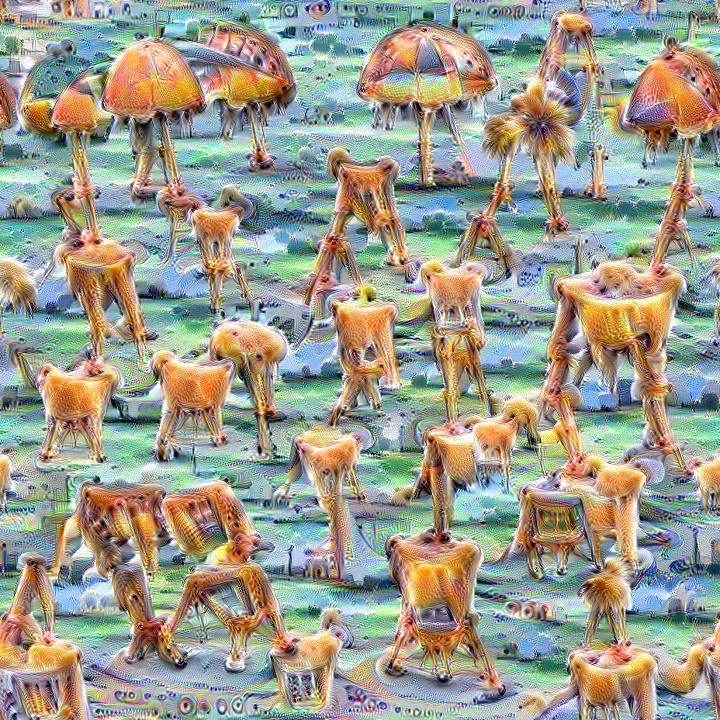
Quickly and easily create / train a custom DeepDream model
Dream-Creator This project aims to simplify the process of creating a custom DeepDream model by using pretrained GoogleNet models and custom image dat

PyTorch implementation of DeepDream algorithm
neural-dream This is a PyTorch implementation of DeepDream. The code is based on neural-style-pt. Here we DeepDream a photograph of the Golden Gate Br

A curated list of awesome Jupyter projects, libraries and resources
Awesome Jupyter A curated list of awesome Jupyter projects, libraries and resources. Jupyter is an open-source web application that allows you to crea

Scapy: the Python-based interactive packet manipulation program & library. Supports Python 2 & Python 3.
Scapy Scapy is a powerful Python-based interactive packet manipulation program and library. It is able to forge or decode packets of a wide number of
pyglet is a cross-platform windowing and multimedia library for Python, for developing games and other visually rich applications.
pyglet pyglet is a cross-platform windowing and multimedia library for Python, intended for developing games and other visually rich applications. It

Luigi is a Python module that helps you build complex pipelines of batch jobs. It handles dependency resolution, workflow management, visualization etc. It also comes with Hadoop support built in.
Luigi is a Python (3.6, 3.7 tested) package that helps you build complex pipelines of batch jobs. It handles dependency resolution, workflow managemen
Visual profiler for Python
vprof vprof is a Python package providing rich and interactive visualizations for various Python program characteristics such as running time and memo
Main repository for Vispy
VisPy: interactive scientific visualization in Python Main website: http://vispy.org VisPy is a high-performance interactive 2D/3D data visualization
Statistical data visualization using matplotlib
seaborn: statistical data visualization Seaborn is a Python visualization library based on matplotlib. It provides a high-level interface for drawing
Interactive Data Visualization in the browser, from Python
Bokeh is an interactive visualization library for modern web browsers. It provides elegant, concise construction of versatile graphics, and affords hi

Declarative statistical visualization library for Python
Altair http://altair-viz.github.io Altair is a declarative statistical visualization library for Python. With Altair, you can spend more time understa
kapre: Keras Audio Preprocessors
Kapre Keras Audio Preprocessors - compute STFT, ISTFT, Melspectrogram, and others on GPU real-time. Tested on Python 3.6 and 3.7 Why Kapre? vs. Pre-co