87 Repositories
Python plotting Libraries

A simple code for plotting figure, colorbar, and cropping with python
Python Plotting Tools This repository provides a python code to generate figures (e.g., curves and barcharts) that can be used in the paper to show th

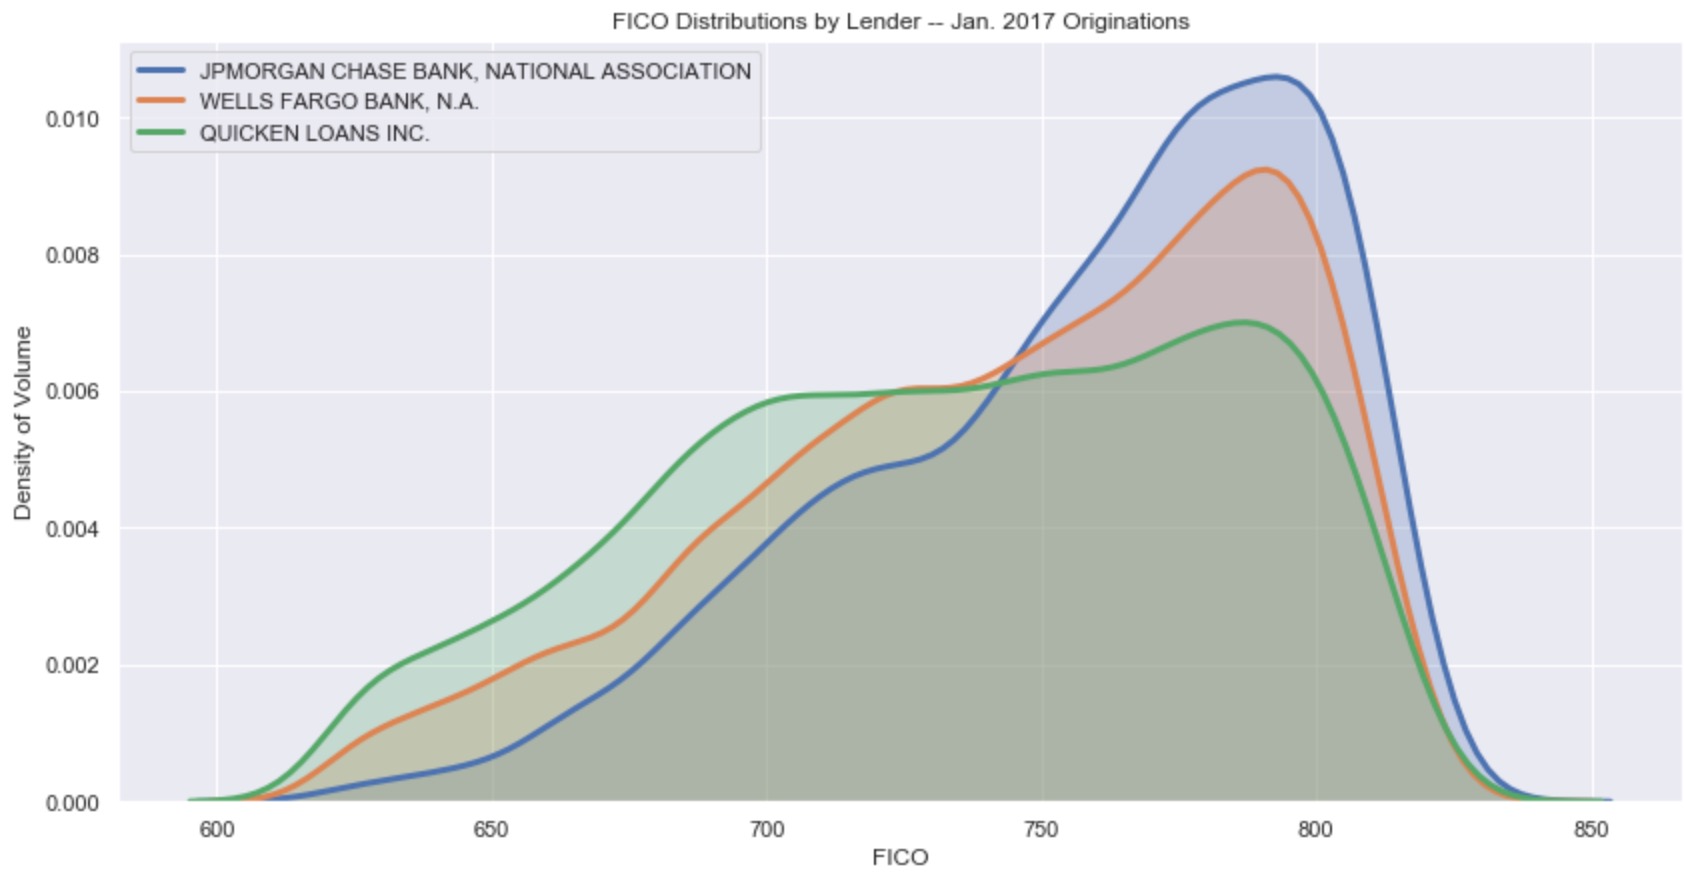
Seaborn is one of the go-to tools for statistical data visualization in python. It has been actively developed since 2012 and in July 2018, the author released version 0.9. This version of Seaborn has several new plotting features, API changes and documentation updates which combine to enhance an already great library. This article will walk through a few of the highlights and show how to use the new scatter and line plot functions for quickly creating very useful visualizations of data.
12_Python_Seaborn_Module Introduction 👋 From the website, “Seaborn is a Python data visualization library based on matplotlib. It provides a high-lev

ipyvizzu - Jupyter notebook integration of Vizzu
ipyvizzu - Jupyter notebook integration of Vizzu. Tutorial · Examples · Repository About The Project ipyvizzu is the Jupyter Notebook integration of V
Pglive - Pglive package adds support for thread-safe live plotting to pyqtgraph
Live pyqtgraph plot Pglive package adds support for thread-safe live plotting to
1900-2016 Olympic Data Analysis in Python by plotting different graphs
🔥 Olympics Data Analysis 🔥 In Data Science field, there is a big topic before creating a model for future prediction is Data Analysis. We can find o

Plotting points that lie on the intersection of the given curves using gradient descent.
Plotting intersection of curves using gradient descent Webapp Link --- What's the app about Why this app Plotting functions and their intersection. A

A web-based analysis toolkit for the System Usability Scale providing calculation, plotting, interpretation and contextualization utility
System Usability Scale Analysis Toolkit The System Usability Scale (SUS) Analysis Toolkit is a web-based python application that provides a compilatio

Plotting and analysis tools for ARTIS simulations
Artistools Artistools is collection of plotting, analysis, and file format conversion tools for the ARTIS radiative transfer code. Installation First

web application for flight log analysis & review
Flight Review This is a web application for flight log analysis. It allows users to upload ULog flight logs, and analyze them through the browser. It

Scientific measurement library for instruments, experiments, and live-plotting
PyMeasure scientific package PyMeasure makes scientific measurements easy to set up and run. The package contains a repository of instrument classes a

Analysis and plotting for motor/prop/ESC characterization, thrust vs RPM and torque vs thrust
esc_test This is a Python package used to plot and analyze data collected for the purpose of characterizing a particular propeller, motor, and ESC con

A Python package to create, run, and post-process MODFLOW-based models.
Version 3.3.5 — release candidate Introduction FloPy includes support for MODFLOW 6, MODFLOW-2005, MODFLOW-NWT, MODFLOW-USG, and MODFLOW-2000. Other s
Runtime analysis of code with plotting
Runtime analysis of code with plotting A quick comparison among Python, Cython, and the C languages A Programming Assignment regarding the Programming
Resources for teaching & learning practical data visualization with python.
Practical Data Visualization with Python Overview All views expressed on this site are my own and do not represent the opinions of any entity with whi

A package for plotting maps in R with ggplot2
Attention! Google has recently changed its API requirements, and ggmap users are now required to register with Google. From a user’s perspective, ther
Python Libraries with functions and constants related to electrical engineering.
ElectricPy Electrical-Engineering-for-Python Python Libraries with functions and constants related to electrical engineering. The functions and consta
Python script to automate the plotting and analysis of percentage depth dose and dose profile simulations in TOPAS.
topas-create-graphs A script to automatically plot the results of a topas simulation Works for percentage depth dose (pdd) and dose profiles (dp). Dep

Standardized plots and visualizations in Python
Standardized plots and visualizations in Python pltviz is a Python package for standardized visualization. Routine and novel plotting approaches are f

Lightweight plotting to the terminal. 4x resolution via Unicode.
Uniplot Lightweight plotting to the terminal. 4x resolution via Unicode. When working with production data science code it can be handy to have plotti

Python scripts for plotting audiograms and related data from Interacoustics Equinox audiometer and Otoaccess software.
audiometry Python scripts for plotting audiograms and related data from Interacoustics Equinox 2.0 audiometer and Otoaccess software. Maybe similar sc
🌀❄️🌩️ This repository contains some examples for creating 2d and 3d weather plots using matplotlib and cartopy libraries in python3.
Weather-Plotting 🌀 ❄️ 🌩️ This repository contains some examples for creating 2d and 3d weather plots using matplotlib and cartopy libraries in pytho
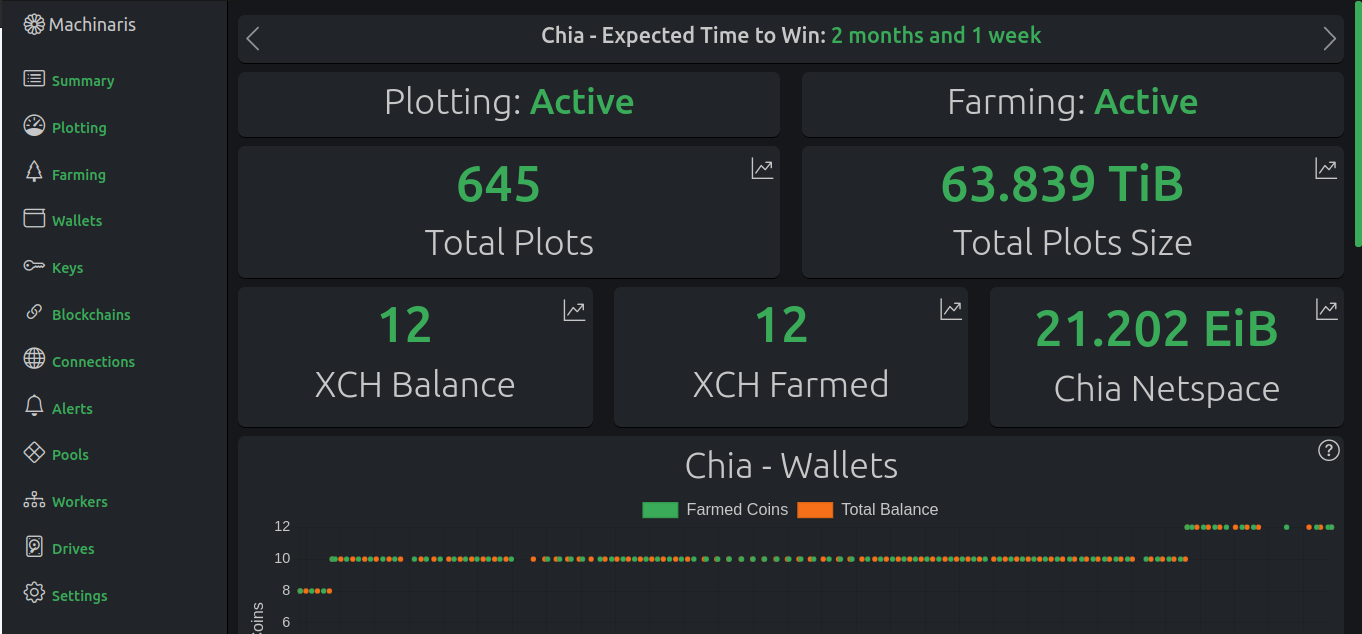
A Docker image for plotting and farming the Chia™ cryptocurrency on one computer or across many.
An easy-to-use WebUI for crypto plotting and farming. Offers Plotman, MadMax, Chiadog, Bladebit, Farmr, and Forktools in a Docker container. Supports Chia, Cactus, Chives, Flax, Flora, HDDCoin, Maize, N-Chain, Staicoin, and Stor among others.
Area-weighted venn-diagrams for Python/matplotlib
Venn diagram plotting routines for Python/Matplotlib Routines for plotting area-weighted two- and three-circle venn diagrams. Installation The simples
A Bokeh project developed for learning and teaching Bokeh interactive plotting!
Bokeh-Python-Visualization A Bokeh project developed for learning and teaching Bokeh interactive plotting! See my medium blog posts about making bokeh

A high-level plotting API for pandas, dask, xarray, and networkx built on HoloViews
hvPlot A high-level plotting API for the PyData ecosystem built on HoloViews. Build Status Coverage Latest dev release Latest release Docs What is it?

A set of useful perceptually uniform colormaps for plotting scientific data
Colorcet: Collection of perceptually uniform colormaps Build Status Coverage Latest dev release Latest release Docs What is it? Colorcet is a collecti

Portfolio analytics for quants, written in Python
QuantStats: Portfolio analytics for quants QuantStats Python library that performs portfolio profiling, allowing quants and portfolio managers to unde

Scientific Visualization: Python + Matplotlib
An open access book on scientific visualization using python and matplotlib

MetPy is a collection of tools in Python for reading, visualizing and performing calculations with weather data.
MetPy MetPy is a collection of tools in Python for reading, visualizing and performing calculations with weather data. MetPy follows semantic versioni

MPL Plotter is a Matplotlib based Python plotting library built with the goal of delivering publication-quality plots concisely.
MPL Plotter is a Matplotlib based Python plotting library built with the goal of delivering publication-quality plots concisely.

A comprehensive tutorial for plotting focal mechanism
Focal_Mechanisms_Demo A comprehensive tutorial for plotting focal mechanism "beach-balls" using the PyGMT package for Python. (Resulting map of this d
termplotlib is a Python library for all your terminal plotting needs.
termplotlib termplotlib is a Python library for all your terminal plotting needs. It aims to work like matplotlib. Line plots For line plots, termplot

Plotting data from the landroid and a raspberry pi zero to a influx-db
landroid-pi-influx Plotting data from the landroid and a raspberry pi zero to a influx-db Dependancies Hardware: Landroid WR130E Raspberry Pi Zero Wif

Tablexplore is an application for data analysis and plotting built in Python using the PySide2/Qt toolkit.
Tablexplore is an application for data analysis and plotting built in Python using the PySide2/Qt toolkit.
A deceptively simple plotting library for Streamlit
🍅 Plost A deceptively simple plotting library for Streamlit. Because you've been writing plots wrong all this time. Getting started pip install plost
This package creates clean and beautiful matplotlib plots that work on light and dark backgrounds
This package creates clean and beautiful matplotlib plots that work on light and dark backgrounds. Inspired by the work of Edward Tufte.
Monitor your Binance portfolio
Binance Report Bot The intent of this bot is to take a snapshot of your binance wallet, e.g. the current balances and store it for further plotting. I

Visualize Camera's Pose Using Extrinsic Parameter by Plotting Pyramid Model on 3D Space
extrinsic2pyramid Visualize Camera's Pose Using Extrinsic Parameter by Plotting Pyramid Model on 3D Space Intro A very simple and straightforward modu

A Python library for plotting hockey rinks with Matplotlib.
Hockey Rink A Python library for plotting hockey rinks with Matplotlib. Installation pip install hockey_rink Current Rinks The following shows the cus
Simple HTML and PDF document generator for Python - with built-in support for popular data analysis and plotting libraries.
Esparto is a simple HTML and PDF document generator for Python. Its primary use is for generating shareable single page reports with content from popular analytics and data science libraries.
This is a Cross-Platform Plot Manager for Chia Plotting that is simple, easy-to-use, and reliable.
Swar's Chia Plot Manager A plot manager for Chia plotting: https://www.chia.net/ Development Version: v0.0.1 This is a cross-platform Chia Plot Manage

Simple, concise geographical visualization in Python
Geographic visualizations for HoloViews. Build Status Coverage Latest dev release Latest release Docs What is it? GeoViews is a Python library that ma

An intuitive library to add plotting functionality to scikit-learn objects.
Welcome to Scikit-plot Single line functions for detailed visualizations The quickest and easiest way to go from analysis... ...to this. Scikit-plot i
With Holoviews, your data visualizes itself.
HoloViews Stop plotting your data - annotate your data and let it visualize itself. HoloViews is an open-source Python library designed to make data a
![Python histogram library - histograms as updateable, fully semantic objects with visualization tools. [P]ython [HYST]ograms.](https://github.com/janpipek/physt/raw/dev/doc/heights.png)
Python histogram library - histograms as updateable, fully semantic objects with visualization tools. [P]ython [HYST]ograms.
physt P(i/y)thon h(i/y)stograms. Inspired (and based on) numpy.histogram, but designed for humans(TM) on steroids(TM). The goal is to unify different
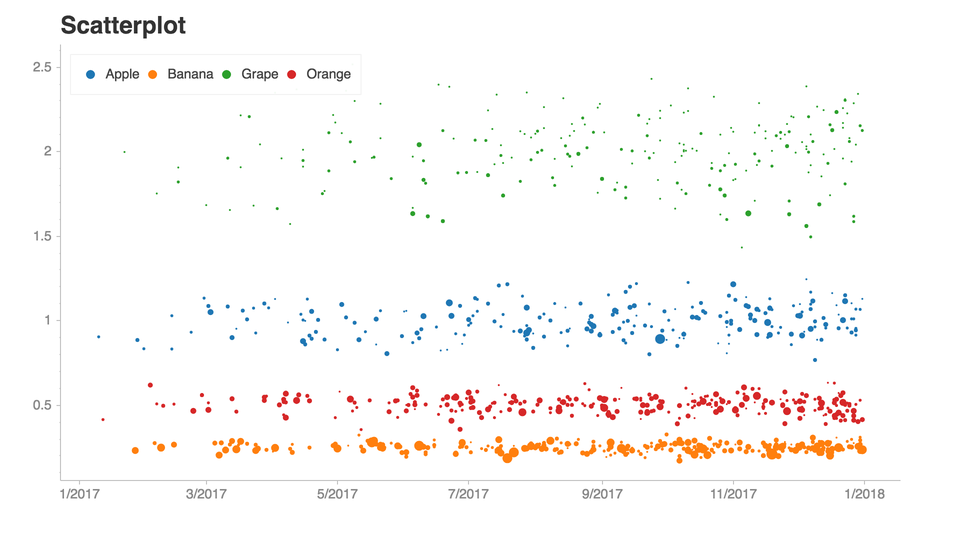
Python library that makes it easy for data scientists to create charts.
Chartify Chartify is a Python library that makes it easy for data scientists to create charts. Why use Chartify? Consistent input data format: Spend l
Veusz scientific plotting application
Veusz 3.3.1 Veusz is a scientific plotting package. It is designed to produce publication-ready PDF or SVG output. Graphs are built-up by combining pl
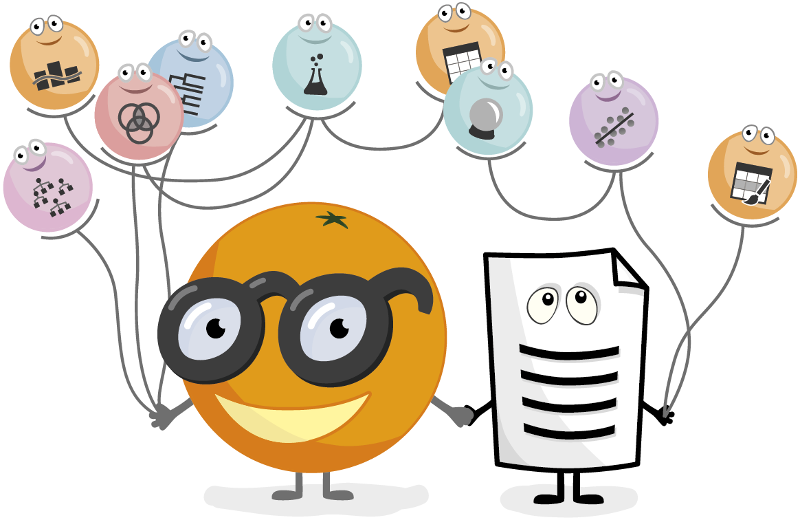
🍊 :bar_chart: :bulb: Orange: Interactive data analysis
Orange Data Mining Orange is a data mining and visualization toolbox for novice and expert alike. To explore data with Orange, one requires no program
Plots is a graph plotting app for GNOME.
Plots is a graph plotting app for GNOME. Plots makes it easy to visualise mathematical formulae. In addition to basic arithmetic operations, it supports trigonometric, hyperbolic, exponential and logarithmic functions, as well as arbitrary sums and products.Plots is designed to integrate well with the GNOME desktop and takes advantage of modern hardware using OpenGL, and currently supports OpenGL 3.3+.

Interactive plotting for Pandas using Vega-Lite
pdvega: Vega-Lite plotting for Pandas Dataframes pdvega is a library that allows you to quickly create interactive Vega-Lite plots from Pandas datafra

A grammar of graphics for Python
plotnine Latest Release License DOI Build Status Coverage Documentation plotnine is an implementation of a grammar of graphics in Python, it is based

A python package for animating plots build on matplotlib.
animatplot A python package for making interactive as well as animated plots with matplotlib. Requires Python = 3.5 Matplotlib = 2.2 (because slider

An open-source plotting library for statistical data.
Lets-Plot Lets-Plot is an open-source plotting library for statistical data. It is implemented using the Kotlin programming language. The design of Le

Joyplots in Python with matplotlib & pandas :chart_with_upwards_trend:
JoyPy JoyPy is a one-function Python package based on matplotlib + pandas with a single purpose: drawing joyplots (a.k.a. ridgeline plots). The code f

:small_red_triangle: Ternary plotting library for python with matplotlib
python-ternary This is a plotting library for use with matplotlib to make ternary plots plots in the two dimensional simplex projected onto a two dime

Bokeh Plotting Backend for Pandas and GeoPandas
Pandas-Bokeh provides a Bokeh plotting backend for Pandas, GeoPandas and Pyspark DataFrames, similar to the already existing Visualization feature of

Python library that makes it easy for data scientists to create charts.
Chartify Chartify is a Python library that makes it easy for data scientists to create charts. Why use Chartify? Consistent input data format: Spend l

A high-level plotting API for pandas, dask, xarray, and networkx built on HoloViews
hvPlot A high-level plotting API for the PyData ecosystem built on HoloViews. Build Status Coverage Latest dev release Latest release Docs What is it?

3D plotting and mesh analysis through a streamlined interface for the Visualization Toolkit (VTK)
PyVista Deployment Build Status Metrics Citation License Community 3D plotting and mesh analysis through a streamlined interface for the Visualization
With Holoviews, your data visualizes itself.
HoloViews Stop plotting your data - annotate your data and let it visualize itself. HoloViews is an open-source Python library designed to make data a

Plotting library for IPython/Jupyter notebooks
bqplot 2-D plotting library for Project Jupyter Introduction bqplot is a 2-D visualization system for Jupyter, based on the constructs of the Grammar

🎨 Python Echarts Plotting Library
pyecharts Python ❤️ ECharts = pyecharts English README 📣 简介 Apache ECharts (incubating) 是一个由百度开源的数据可视化,凭借着良好的交互性,精巧的图表设计,得到了众多开发者的认可。而 Python 是一门富有表达
Interactive Data Visualization in the browser, from Python
Bokeh is an interactive visualization library for modern web browsers. It provides elegant, concise construction of versatile graphics, and affords hi
matplotlib: plotting with Python
Matplotlib is a comprehensive library for creating static, animated, and interactive visualizations in Python. Check out our home page for more inform

Interactive plotting for Pandas using Vega-Lite
pdvega: Vega-Lite plotting for Pandas Dataframes pdvega is a library that allows you to quickly create interactive Vega-Lite plots from Pandas datafra

A grammar of graphics for Python
plotnine Latest Release License DOI Build Status Coverage Documentation plotnine is an implementation of a grammar of graphics in Python, it is based

A python package for animating plots build on matplotlib.
animatplot A python package for making interactive as well as animated plots with matplotlib. Requires Python = 3.5 Matplotlib = 2.2 (because slider

An open-source plotting library for statistical data.
Lets-Plot Lets-Plot is an open-source plotting library for statistical data. It is implemented using the Kotlin programming language. The design of Le

Joyplots in Python with matplotlib & pandas :chart_with_upwards_trend:
JoyPy JoyPy is a one-function Python package based on matplotlib + pandas with a single purpose: drawing joyplots (a.k.a. ridgeline plots). The code f

:small_red_triangle: Ternary plotting library for python with matplotlib
python-ternary This is a plotting library for use with matplotlib to make ternary plots plots in the two dimensional simplex projected onto a two dime

Bokeh Plotting Backend for Pandas and GeoPandas
Pandas-Bokeh provides a Bokeh plotting backend for Pandas, GeoPandas and Pyspark DataFrames, similar to the already existing Visualization feature of

Python library that makes it easy for data scientists to create charts.
Chartify Chartify is a Python library that makes it easy for data scientists to create charts. Why use Chartify? Consistent input data format: Spend l

A high-level plotting API for pandas, dask, xarray, and networkx built on HoloViews
hvPlot A high-level plotting API for the PyData ecosystem built on HoloViews. Build Status Coverage Latest dev release Latest release Docs What is it?

3D plotting and mesh analysis through a streamlined interface for the Visualization Toolkit (VTK)
PyVista Deployment Build Status Metrics Citation License Community 3D plotting and mesh analysis through a streamlined interface for the Visualization
With Holoviews, your data visualizes itself.
HoloViews Stop plotting your data - annotate your data and let it visualize itself. HoloViews is an open-source Python library designed to make data a

Plotting library for IPython/Jupyter notebooks
bqplot 2-D plotting library for Project Jupyter Introduction bqplot is a 2-D visualization system for Jupyter, based on the constructs of the Grammar

🎨 Python Echarts Plotting Library
pyecharts Python ❤️ ECharts = pyecharts English README 📣 简介 Apache ECharts (incubating) 是一个由百度开源的数据可视化,凭借着良好的交互性,精巧的图表设计,得到了众多开发者的认可。而 Python 是一门富有表达
Interactive Data Visualization in the browser, from Python
Bokeh is an interactive visualization library for modern web browsers. It provides elegant, concise construction of versatile graphics, and affords hi
matplotlib: plotting with Python
Matplotlib is a comprehensive library for creating static, animated, and interactive visualizations in Python. Check out our home page for more inform

plotting in the terminal
bashplotlib plotting in the terminal what is it? bashplotlib is a python package and command line tool for making basic plots in the terminal. It's a

NorthPitch is a python soccer plotting library that sits on top of Matplotlib
NorthPitch is a python soccer plotting library that sits on top of Matplotlib.
🎨 Python3 binding for `@AntV/G2Plot` Plotting Library .
PyG2Plot 🎨 Python3 binding for @AntV/G2Plot which an interactive and responsive charting library. Based on the grammar of graphics, you can easily ma

An intuitive library to add plotting functionality to scikit-learn objects.
Welcome to Scikit-plot Single line functions for detailed visualizations The quickest and easiest way to go from analysis... ...to this. Scikit-plot i

Simple plotting for Python. Python wrapper for D3xter - render charts in the browser with simple Python syntax.
PyDexter Simple plotting for Python. Python wrapper for D3xter - render charts in the browser with simple Python syntax. Setup $ pip install PyDexter

A grammar of graphics for Python
plotnine Latest Release License DOI Build Status Coverage Documentation plotnine is an implementation of a grammar of graphics in Python, it is based

Plotting library for IPython/Jupyter notebooks
bqplot 2-D plotting library for Project Jupyter Introduction bqplot is a 2-D visualization system for Jupyter, based on the constructs of the Grammar
Interactive Data Visualization in the browser, from Python
Bokeh is an interactive visualization library for modern web browsers. It provides elegant, concise construction of versatile graphics, and affords hi