Filter By
527 Repositories
Python Data Visualization
Geocoding library for Python.
geopy geopy is a Python client for several popular geocoding web services. geopy makes it easy for Python developers to locate the coordinates of addr
 3.8k Jan 2, 2023
Python Data. Leaflet.js Maps.
folium Python Data, Leaflet.js Maps folium builds on the data wrangling strengths of the Python ecosystem and the mapping strengths of the Leaflet.js
 6k Jan 2, 2023

A Python library for plotting hockey rinks with Matplotlib.
Hockey Rink A Python library for plotting hockey rinks with Matplotlib. Installation pip install hockey_rink Current Rinks The following shows the cus
 24 Jan 2, 2023
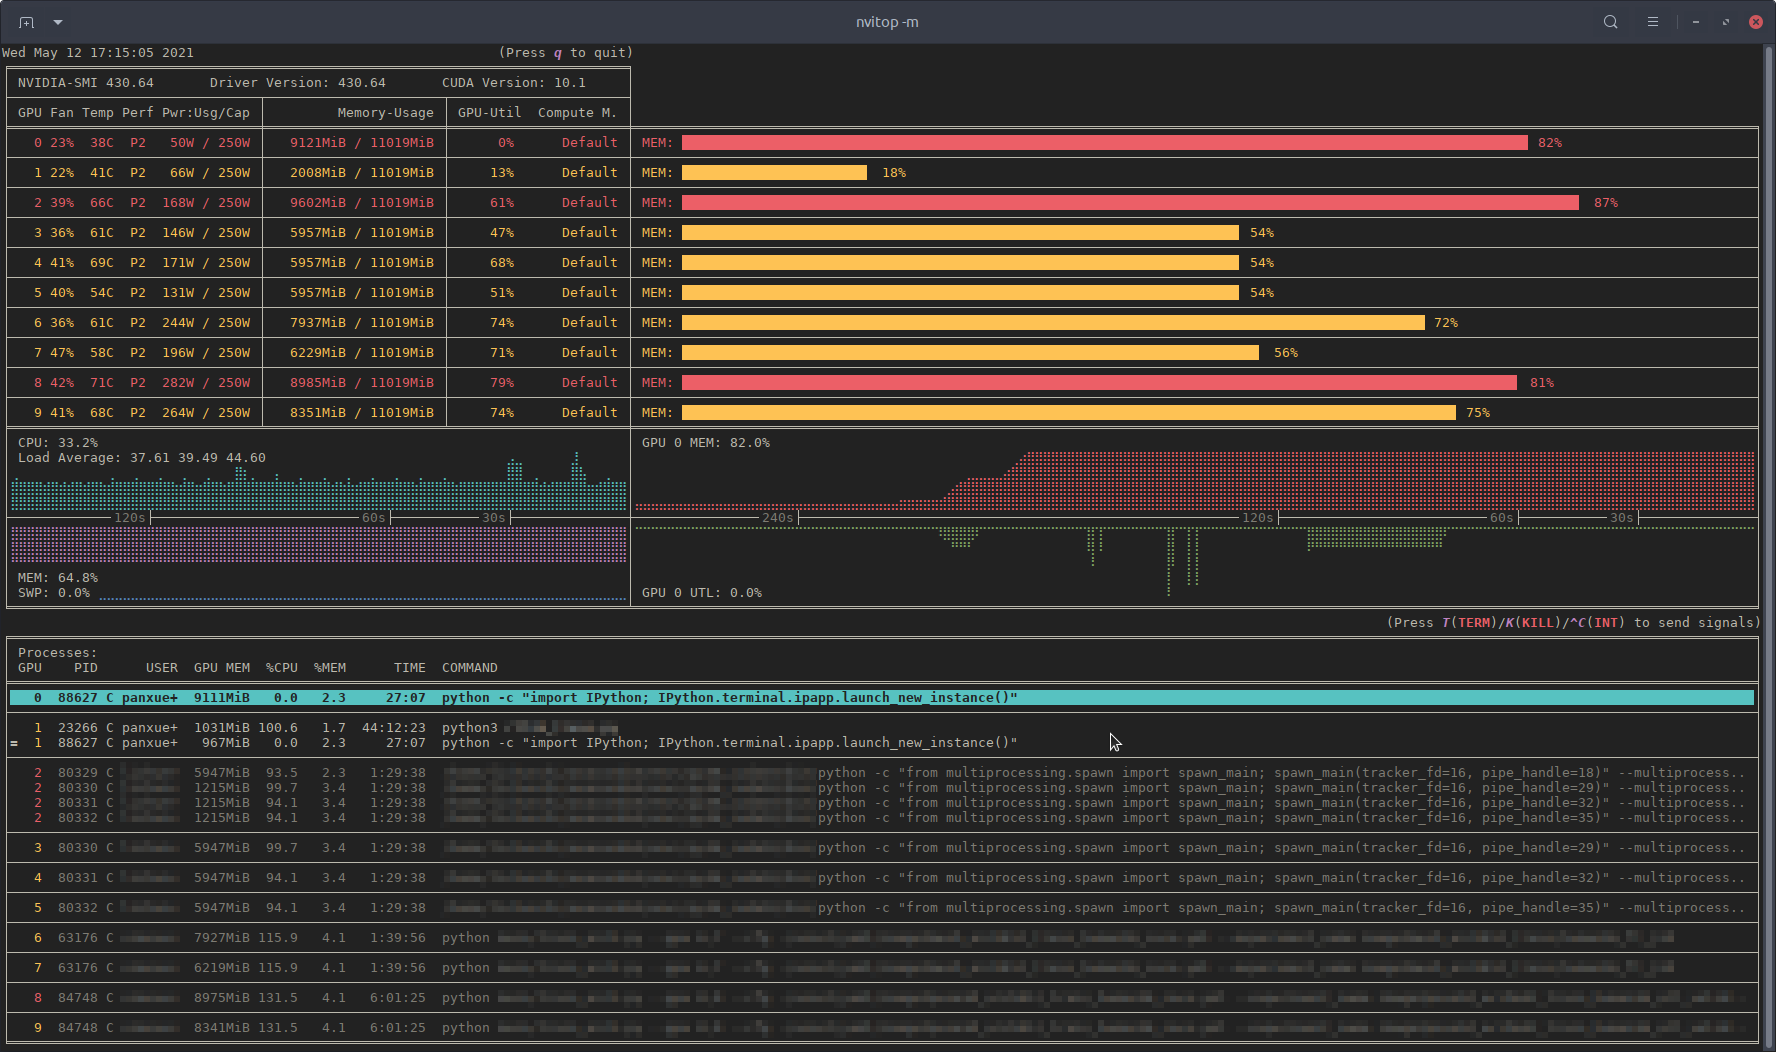
nvitop, an interactive NVIDIA-GPU process viewer, the one-stop solution for GPU process management
An interactive NVIDIA-GPU process viewer, the one-stop solution for GPU process management.
 1.3k Jan 2, 2023
GitHub English Top Charts
Help you discover excellent English projects and get rid of the interference of other spoken language.
 529 Jan 2, 2023

Handout for the tutorial "Creating publication-quality figures with matplotlib"
Handout for the tutorial "Creating publication-quality figures with matplotlib"
 1.9k Jan 2, 2023
daily report of @arkinvest ETF activity + data collection
ark_invest daily weekday report of @arkinvest ETF activity + data collection This script was created to: Extract and save daily csv's from ARKInvest's
 27 Jan 2, 2023

A simple code for plotting figure, colorbar, and cropping with python
Python Plotting Tools This repository provides a python code to generate figures (e.g., curves and barcharts) that can be used in the paper to show th
 134 Jan 2, 2023
With Holoviews, your data visualizes itself.
HoloViews Stop plotting your data - annotate your data and let it visualize itself. HoloViews is an open-source Python library designed to make data a
 2.3k Jan 2, 2023
Automatically Visualize any dataset, any size with a single line of code. Created by Ram Seshadri. Collaborators Welcome. Permission Granted upon Request.
AutoViz Automatically Visualize any dataset, any size with a single line of code. AutoViz performs automatic visualization of any dataset with one lin
 1k Jan 2, 2023
🧇 Make Waffle Charts in Python.
PyWaffle PyWaffle is an open source, MIT-licensed Python package for plotting waffle charts. It provides a Figure constructor class Waffle, which coul
 528 Jan 2, 2023

GitHubPoster - Make everything a GitHub svg poster
GitHubPoster Make everything a GitHub svg poster 支持 Strava 开心词场 扇贝 Nintendo Switch GPX 多邻国 Issue
 1.3k Jan 2, 2023

Apache Superset is a Data Visualization and Data Exploration Platform
Apache Superset is a Data Visualization and Data Exploration Platform
 49.9k Jan 2, 2023

DrawBot lets you draw images taken from the internet on Skribbl.io, Gartic Phone and Paint
DrawBot You don't speak french? No worries, english translation is over here. C'est quoi ? DrawBot est un logiciel codé par V2F qui va prendre possess
 205 Jan 1, 2023

Dimensionality reduction in very large datasets using Siamese Networks
ivis Implementation of the ivis algorithm as described in the paper Structure-preserving visualisation of high dimensional single-cell datasets. Ivis
 284 Jan 1, 2023
Cartopy - a cartographic python library with matplotlib support
Cartopy is a Python package designed to make drawing maps for data analysis and visualisation easy. Table of contents Overview Get in touch License an
 1.2k Jan 1, 2023
Python library that makes it easy for data scientists to create charts.
Chartify Chartify is a Python library that makes it easy for data scientists to create charts. Why use Chartify? Consistent input data format: Spend l
 3.2k Jan 1, 2023
Learning Convolutional Neural Networks with Interactive Visualization.
CNN Explainer An interactive visualization system designed to help non-experts learn about Convolutional Neural Networks (CNNs) For more information,
 6.3k Jan 1, 2023
Create HTML profiling reports from pandas DataFrame objects
Pandas Profiling Documentation | Slack | Stack Overflow Generates profile reports from a pandas DataFrame. The pandas df.describe() function is great
 10k Jan 1, 2023
📊📈 Serves up Pandas dataframes via the Django REST Framework for use in client-side (i.e. d3.js) visualizations and offline analysis (e.g. Excel)
📊📈 Serves up Pandas dataframes via the Django REST Framework for use in client-side (i.e. d3.js) visualizations and offline analysis (e.g. Excel)
 1.2k Jan 1, 2023
NumPy and Pandas interface to Big Data
Blaze translates a subset of modified NumPy and Pandas-like syntax to databases and other computing systems. Blaze allows Python users a familiar inte
 3.1k Jan 1, 2023

A grammar of graphics for Python
plotnine Latest Release License DOI Build Status Coverage Documentation plotnine is an implementation of a grammar of graphics in Python, it is based
 3.3k Jan 1, 2023
GUI for visualization and interactive editing of SMPL-family body models ie. SMPL, SMPL-X, MANO, FLAME.
Body Model Visualizer Introduction This is a simple Open3D-based GUI for SMPL-family body models. This GUI lets you play with the shape, expression, a
 207 Jan 1, 2023

High-level geospatial data visualization library for Python.
geoplot: geospatial data visualization geoplot is a high-level Python geospatial plotting library. It's an extension to cartopy and matplotlib which m
 1k Jan 1, 2023

Analytical Web Apps for Python, R, Julia, and Jupyter. No JavaScript Required.
Dash Dash is the most downloaded, trusted Python framework for building ML & data science web apps. Built on top of Plotly.js, React and Flask, Dash t
 17.9k Dec 31, 2022
Interactive Data Visualization in the browser, from Python
Bokeh is an interactive visualization library for modern web browsers. It provides elegant, concise construction of versatile graphics, and affords hi
 17.1k Dec 31, 2022

An intuitive library to add plotting functionality to scikit-learn objects.
Welcome to Scikit-plot Single line functions for detailed visualizations The quickest and easiest way to go from analysis... ...to this. Scikit-plot i
 2.3k Dec 31, 2022
Multi-class confusion matrix library in Python
Table of contents Overview Installation Usage Document Try PyCM in Your Browser Issues & Bug Reports Todo Outputs Dependencies Contribution References
 1.3k Dec 31, 2022

Scientific Visualization: Python + Matplotlib
An open access book on scientific visualization using python and matplotlib
 8.6k Dec 31, 2022

哔咔漫画window客户端,界面使用PySide2,已实现分类、搜索、收藏夹、下载、在线观看、waifu2x等功能。
picacomic-windows 哔咔漫画window客户端,界面使用PySide2,已实现分类、搜索、收藏夹、下载、在线观看等功能。 功能介绍 登陆分流,还原安卓端的三个分流入口 分类,搜索,排行,收藏夹使用同一的逻辑,滚轮下滑自动加载下一页,双击打开 漫画详情,章节列表和评论列表 下载功能,目
 1.8k Dec 31, 2022
termplotlib is a Python library for all your terminal plotting needs.
termplotlib termplotlib is a Python library for all your terminal plotting needs. It aims to work like matplotlib. Line plots For line plots, termplot
 553 Dec 30, 2022

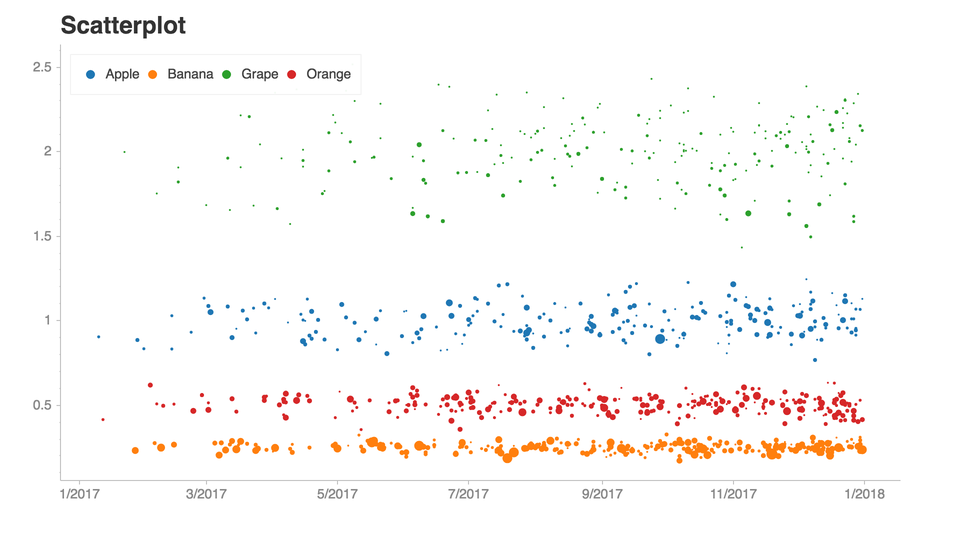
Plot, scatter plots and histograms in the terminal using braille dots
Plot, scatter plots and histograms in the terminal using braille dots, with (almost) no dependancies. Plot with color or make complex figures - similar to a very small sibling to matplotlib. Or use the canvas to plot dots and lines yourself.
 207 Dec 30, 2022
:art: Diagram as Code for prototyping cloud system architectures
Diagrams Diagram as Code. Diagrams lets you draw the cloud system architecture in Python code. It was born for prototyping a new system architecture d
 27.5k Dec 30, 2022
Flipper Zero documentation repo
Flipper Zero Docs Participation To fix a bug or add something new to this repository, you need to open a pull-request. Also, on every page of the site
 114 Dec 30, 2022

Visualization of hidden layer activations of small multilayer perceptrons (MLPs)
MLP Hidden Layer Activation Visualization To gain some intuition about the internal representation of simple multi-layer perceptrons (MLPs) I trained
 7 Dec 30, 2022
🐞 📊 Ladybug extension to generate 2D charts
ladybug-charts Ladybug extension to generate 2D charts. Installation pip install ladybug-charts QuickStart import ladybug_charts API Documentation Loc
 3 Dec 30, 2022

Plotting library for IPython/Jupyter notebooks
bqplot 2-D plotting library for Project Jupyter Introduction bqplot is a 2-D visualization system for Jupyter, based on the constructs of the Grammar
 3.4k Dec 30, 2022

Plotly Dash Command Line Tools - Easily create and deploy Plotly Dash projects from templates
🛠️ dash-tools - Create and Deploy Plotly Dash Apps from Command Line | | | | | Create a templated multi-page Plotly Dash app with CLI in less than 7
 50 Dec 30, 2022
Statistical data visualization using matplotlib
seaborn: statistical data visualization Seaborn is a Python visualization library based on matplotlib. It provides a high-level interface for drawing
 10.2k Dec 30, 2022
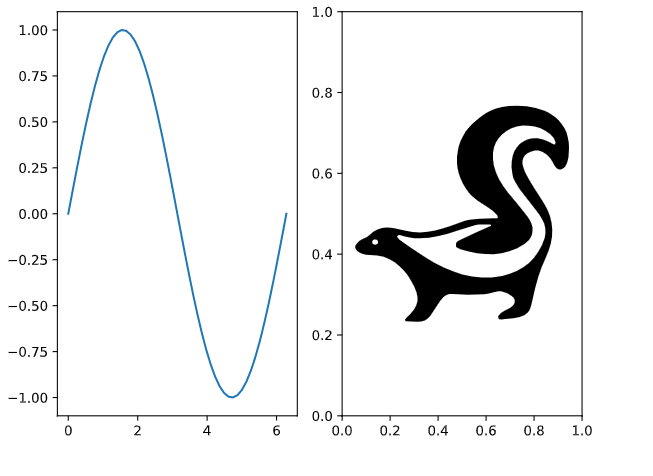
Pydrawer: The Python package for visualizing curves and linear transformations in a super simple way
pydrawer 📐 The Python package for visualizing curves and linear transformations in a super simple way. ✏️ Installation Install pydrawer package with
 56 Dec 30, 2022

A little word cloud generator in Python
Linux macOS Windows PyPI word_cloud A little word cloud generator in Python. Read more about it on the blog post or the website. The code is tested ag
 9.2k Dec 30, 2022

Productivity Tools for Plotly + Pandas
Cufflinks This library binds the power of plotly with the flexibility of pandas for easy plotting. This library is available on https://github.com/san
 2.7k Dec 30, 2022
Manim is an animation engine for explanatory math videos.
A community-maintained Python framework for creating mathematical animations.
 12.4k Dec 30, 2022
Some useful extensions for Matplotlib.
mplx Some useful extensions for Matplotlib. Contour plots for functions with discontinuities plt.contour mplx.contour(max_jump=1.0) Matplotlib has pro
519 Dec 30, 2022
A deceptively simple plotting library for Streamlit
🍅 Plost A deceptively simple plotting library for Streamlit. Because you've been writing plots wrong all this time. Getting started pip install plost
 192 Dec 29, 2022
Missing data visualization module for Python.
missingno Messy datasets? Missing values? missingno provides a small toolset of flexible and easy-to-use missing data visualizations and utilities tha
3.4k Dec 29, 2022
 35 Dec 29, 2022

Lime: Explaining the predictions of any machine learning classifier
lime This project is about explaining what machine learning classifiers (or models) are doing. At the moment, we support explaining individual predict
 10.3k Dec 29, 2022
A D3.js plugin that produces flame graphs from hierarchical data.
d3-flame-graph A D3.js plugin that produces flame graphs from hierarchical data. If you don't know what flame graphs are, check Brendan Gregg's post.
 740 Dec 29, 2022
Plotting library for IPython/Jupyter notebooks
bqplot 2-D plotting library for Project Jupyter Introduction bqplot is a 2-D visualization system for Jupyter, based on the constructs of the Grammar
3.4k Dec 29, 2022
Simple, realtime visualization of neural network training performance.
pastalog Simple, realtime visualization server for training neural networks. Use with Lasagne, Keras, Tensorflow, Torch, Theano, and basically everyth
 416 Dec 29, 2022

Editor and Presenter for Manim Generated Content.
Editor and Presenter for Manim Generated Content. Take a look at the Working Example. More information can be found on the documentation. These Browse
149 Dec 29, 2022
A high performance implementation of HDBSCAN clustering. http://hdbscan.readthedocs.io/en/latest/
HDBSCAN Now a part of scikit-learn-contrib HDBSCAN - Hierarchical Density-Based Spatial Clustering of Applications with Noise. Performs DBSCAN over va
 91 Dec 29, 2022
3D Vision functions with end-to-end support for deep learning developers, written in Ivy.
Ivy vision focuses predominantly on 3D vision, with functions for camera geometry, image projections, co-ordinate frame transformations, forward warping, inverse warping, optical flow, depth triangulation, voxel grids, point clouds, signed distance functions, and others. Check out the docs for more info!
 61 Dec 29, 2022