Filter By
527 Repositories
Python Data Visualization
A Python Library for Self Organizing Map (SOM)
SOMPY A Python Library for Self Organizing Map (SOM) As much as possible, the structure of SOM is similar to somtoolbox in Matlab. It has the followin
 497 Dec 29, 2022

Data Visualization Guide for Presentations, Reports, and Dashboards
This is a highly practical and example-based guide on visually representing data in reports and dashboards.
 395 Dec 29, 2022

A Python toolbox for gaining geometric insights into high-dimensional data
"To deal with hyper-planes in a 14 dimensional space, visualize a 3D space and say 'fourteen' very loudly. Everyone does it." - Geoff Hinton Overview
 1.8k Dec 29, 2022

:small_red_triangle: Ternary plotting library for python with matplotlib
python-ternary This is a plotting library for use with matplotlib to make ternary plots plots in the two dimensional simplex projected onto a two dime
 611 Dec 29, 2022

Seismic Waveform Inversion Toolbox-1.0
Seismic Waveform Inversion Toolbox (SWIT-1.0)
 98 Dec 29, 2022

Easily convert matplotlib plots from Python into interactive Leaflet web maps.
mplleaflet mplleaflet is a Python library that converts a matplotlib plot into a webpage containing a pannable, zoomable Leaflet map. It can also embe
 502 Dec 28, 2022
Curvipy - The Python package for visualizing curves and linear transformations in a super simple way
Curvipy - The Python package for visualizing curves and linear transformations in a super simple way
 55 Dec 28, 2022
An easy to use burndown chart generator for GitHub Project Boards.
Burndown Chart for GitHub Projects An easy to use burndown chart generator for GitHub Project Boards. Table of Contents Features Installation Assumpti
 15 Dec 28, 2022

Create artistic visualisations with your exercise data (Python version)
strava_py Create artistic visualisations with your exercise data (Python version). This is a port of the R strava package to Python. Examples Facets A
 53 Dec 28, 2022
Flexitext is a Python library that makes it easier to draw text with multiple styles in Matplotlib
Flexitext is a Python library that makes it easier to draw text with multiple styles in Matplotlib
 93 Dec 28, 2022
a plottling library for python, based on D3
Hello August 2013 Hello! Maybe you're looking for a nice Python interface to build interactive, javascript based plots that look as nice as all those
 1.4k Dec 28, 2022
Quickly and accurately render even the largest data.
Turn even the largest data into images, accurately Build Status Coverage Latest dev release Latest release Docs Support What is it? Datashader is a da
 2.9k Dec 28, 2022

Matplotlib tutorial for beginner
matplotlib is probably the single most used Python package for 2D-graphics. It provides both a very quick way to visualize data from Python and publication-quality figures in many formats. We are going to explore matplotlib in interactive mode covering most common cases.
 2.6k Dec 28, 2022
basemap - Plot on map projections (with coastlines and political boundaries) using matplotlib.
Basemap Plot on map projections (with coastlines and political boundaries) using matplotlib. ⚠️ Warning: this package is being deprecated in favour of
 706 Dec 28, 2022

Automate the case review on legal case documents and find the most critical cases using network analysis
Automation on Legal Court Cases Review This project is to automate the case review on legal case documents and find the most critical cases using netw
 7 Dec 28, 2022
Streaming pivot visualization via WebAssembly
Perspective is an interactive visualization component for large, real-time datasets. Originally developed for J.P. Morgan's trading business, Perspect
 5.1k Dec 27, 2022

A Jupyter - Three.js bridge
pythreejs A Python / ThreeJS bridge utilizing the Jupyter widget infrastructure. Getting Started Installation Using pip: pip install pythreejs And the
 844 Dec 27, 2022
Render Jupyter notebook in the terminal
jut - JUpyter notebook Terminal viewer. The command line tool view the IPython/Jupyter notebook in the terminal. Install pip install jut Usage $jut --
 169 Dec 27, 2022

Python package for hypergraph analysis and visualization.
The HyperNetX library provides classes and methods for the analysis and visualization of complex network data. HyperNetX uses data structures designed to represent set systems containing nested data and/or multi-way relationships. The library generalizes traditional graph metrics to hypergraphs.
 304 Dec 27, 2022

A Jupyter - Leaflet.js bridge
ipyleaflet A Jupyter / Leaflet bridge enabling interactive maps in the Jupyter notebook. Usage Selecting a basemap for a leaflet map: Loading a geojso
1.3k Dec 27, 2022

Simple Inkscape Scripting
Simple Inkscape Scripting Description In the Inkscape vector-drawing program, how would you go about drawing 100 diamonds, each with a random color an
 140 Dec 27, 2022

Debugging, monitoring and visualization for Python Machine Learning and Data Science
Welcome to TensorWatch TensorWatch is a debugging and visualization tool designed for data science, deep learning and reinforcement learning from Micr
 3.3k Dec 27, 2022
A curated list of awesome Dash (plotly) resources
Awesome Dash A curated list of awesome Dash (plotly) resources Dash is a productive Python framework for building web applications. Written on top of
 1.7k Dec 26, 2022

Import, visualize, and analyze SpiderFoot OSINT data in Neo4j, a graph database
SpiderFoot Neo4j Tools Import, visualize, and analyze SpiderFoot OSINT data in Neo4j, a graph database Step 1: Installation NOTE: This installs the sf
 42 Dec 26, 2022
Simple Python interface for Graphviz
Graphviz This package facilitates the creation and rendering of graph descriptions in the DOT language of the Graphviz graph drawing software (master
 1.3k Dec 26, 2022
Drag’n’drop Pivot Tables and Charts for Jupyter/IPython Notebook, care of PivotTable.js
pivottablejs: the Python module Drag’n’drop Pivot Tables and Charts for Jupyter/IPython Notebook, care of PivotTable.js Installation pip install pivot
 512 Dec 26, 2022

Interactive chemical viewer for 2D structures of small molecules
👀 mols2grid mols2grid is an interactive chemical viewer for 2D structures of small molecules, based on RDKit. ➡️ Try the demo notebook on Google Cola
 154 Dec 26, 2022

A Python package that provides evaluation and visualization tools for the DexYCB dataset
DexYCB Toolkit DexYCB Toolkit is a Python package that provides evaluation and visualization tools for the DexYCB dataset. The dataset and results wer
 107 Dec 26, 2022
Sentiment Analysis application created with Python and Dash, hosted at socialsentiment.net
Social Sentiment Dash Application Live-streaming sentiment analysis application created with Python and Dash, hosted at SocialSentiment.net. Dash Tuto
 456 Dec 25, 2022

Histogramming for analysis powered by boost-histogram
Hist Hist is an analyst-friendly front-end for boost-histogram, designed for Python 3.7+ (3.6 users get version 2.4). See what's new. Installation You
 97 Dec 25, 2022
Tools for exploratory data analysis in Python
Dora Exploratory data analysis toolkit for Python. Contents Summary Setup Usage Reading Data & Configuration Cleaning Feature Selection & Extraction V
 599 Dec 25, 2022

A simple python tool for explore your object detection dataset
A simple tool for explore your object detection dataset. The goal of this library is to provide simple and intuitive visualizations from your dataset and automatically find the best parameters for generating a specific grid of anchors that can fit you data characteristics
 142 Dec 25, 2022

An adaptable Snakemake workflow which uses GATKs best practice recommendations to perform germline mutation calling starting with BAM files
Germline Mutation Calling This Snakemake workflow follows the GATK best-practice recommandations to call small germline variants. The pipeline require
 12 Dec 24, 2022
The Timescale NFT Starter Kit is a step-by-step guide to get up and running with collecting, storing, analyzing and visualizing NFT data from OpenSea, using PostgreSQL and TimescaleDB.
Timescale NFT Starter Kit The Timescale NFT Starter Kit is a step-by-step guide to get up and running with collecting, storing, analyzing and visualiz
 102 Dec 24, 2022
The windML framework provides an easy-to-use access to wind data sources within the Python world, building upon numpy, scipy, sklearn, and matplotlib. Renewable Wind Energy, Forecasting, Prediction
windml Build status : The importance of wind in smart grids with a large number of renewable energy resources is increasing. With the growing infrastr
 125 Dec 24, 2022
Friday Night Funkin - converts a chart from 4/4 time to 6/8 time, or from regular to swing tempo.
Chart to swing converter As seen in https://twitter.com/i_winxd/status/1462220493558366214 A program written in python that converts a chart from 4/4
 5 Dec 23, 2022
Define fortify and autoplot functions to allow ggplot2 to handle some popular R packages.
ggfortify This package offers fortify and autoplot functions to allow automatic ggplot2 to visualize statistical result of popular R packages. Check o
 504 Dec 23, 2022
Calendar heatmaps from Pandas time series data
Note: See MarvinT/calmap for the maintained version of the project. That is also the version that gets published to PyPI and it has received several f
 195 Dec 22, 2022

Generate a 3D Skyline in STL format and a OpenSCAD file from Gitlab contributions
Your Gitlab's contributions in a 3D Skyline gitlab-skyline is a Python command to generate a skyline figure from Gitlab contributions as Github did at
 70 Dec 22, 2022

Tidy data structures, summaries, and visualisations for missing data
naniar naniar provides principled, tidy ways to summarise, visualise, and manipulate missing data with minimal deviations from the workflows in ggplot
 611 Dec 22, 2022

A guide for using Bootstrap 5 classes in Dash Bootstrap Components V1
dash-bootstrap-cheatsheet This handy interactive cheatsheet makes it easy to use the Bootstrap 5 classes with your Dash app made with the latest versi
 10 Dec 22, 2022

:bowtie: Create a dashboard with python!
Installation | Documentation | Gitter Chat | Google Group Bowtie Introduction Bowtie is a library for writing dashboards in Python. No need to know we
 753 Dec 22, 2022
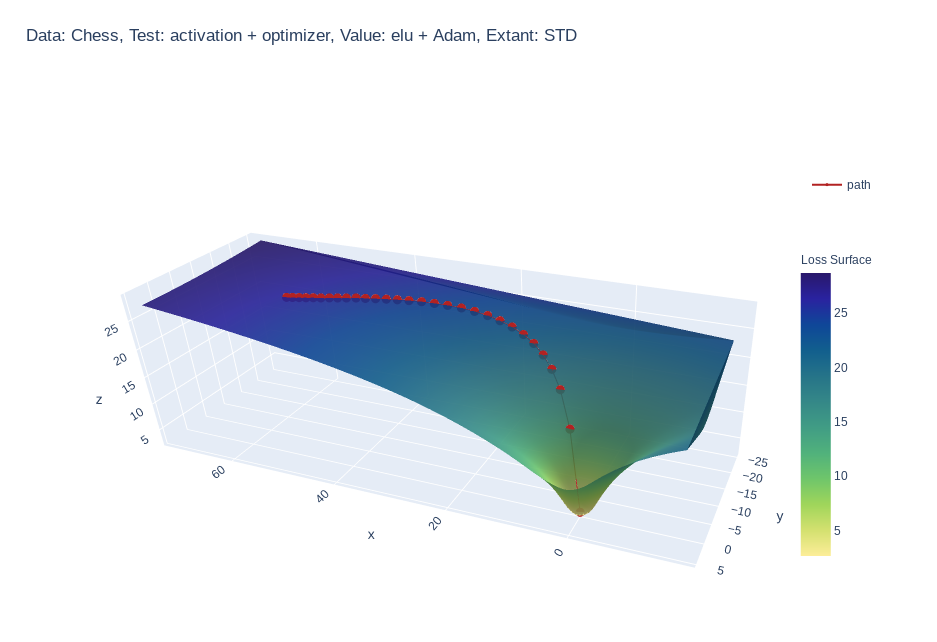
Create 3d loss surface visualizations, with optimizer path. Issues welcome!
MLVTK A loss surface visualization tool Simple feed-forward network trained on chess data, using elu activation and Adam optimizer Simple feed-forward
 7 Dec 21, 2022
FURY - A software library for scientific visualization in Python
Free Unified Rendering in Python A software library for scientific visualization in Python. General Information • Key Features • Installation • How to
 169 Dec 21, 2022

2D maze path solver visualizer implemented with python
2D maze path solver visualizer implemented with python
 14 Dec 21, 2022

cqMore is a CadQuery plugin based on CadQuery 2.1.
cqMore (under construction) cqMore is a CadQuery plugin based on CadQuery 2.1. Installation Please use conda to install CadQuery and its dependencies
 36 Dec 21, 2022
https://there.oughta.be/a/macro-keyboard
inkkeys Details and instructions can be found on https://there.oughta.be/a/macro-keyboard In contrast to most of my other projects, I decided to put t
 209 Dec 21, 2022

script to generate HeN ipfs app exports of GLSL shaders
HeNerator A simple script to generate HeN ipfs app exports from any frag shader created with: GlslViewer GlslEditor The Book of Shaders glslCanvas VS
 22 Dec 21, 2022
Streamlit dashboard examples - Twitter cashtags, StockTwits, WSB, Charts, SQL Pattern Scanner
streamlit-dashboards Streamlit dashboard examples - Twitter cashtags, StockTwits, WSB, Charts, SQL Pattern Scanner Tutorial Video https://ww
 122 Dec 21, 2022

YOPO is an interactive dashboard which generates various standard plots.
YOPO is an interactive dashboard which generates various standard plots.you can create various graphs and charts with a click of a button. This tool uses Dash and Flask in backend.
 38 Dec 20, 2022
Python package that generates hardware pinout diagrams as SVG images
PinOut A Python package that generates hardware pinout diagrams as SVG images. The package is designed to be quite flexible and works well for general
 336 Dec 20, 2022

Log visualizer for whirl-framework
Lumberjack Log visualizer for whirl-framework Установка pip install -r requirements.txt Как пользоваться python3 lumberjack.py -l путь до лога -o
 2 Dec 19, 2022

Squidpy is a tool for the analysis and visualization of spatial molecular data.
Squidpy is a tool for the analysis and visualization of spatial molecular data. It builds on top of scanpy and anndata, from which it inherits modularity and scalability. It provides analysis tools that leverages the spatial coordinates of the data, as well as tissue images if available.
 251 Dec 19, 2022
BGraph is a tool designed to generate dependencies graphs from Android.bp soong files.
BGraph BGraph is a tool designed to generate dependencies graphs from Android.bp soong files. Overview BGraph (for Build-Graphs) is a project aimed at
 10 Dec 19, 2022