Filter By
527 Repositories
Python Data Visualization
BrowZen correlates your emotional states with the web sites you visit to give you actionable insights about how you spend your time browsing the web.
BrowZen BrowZen correlates your emotional states with the web sites you visit to give you actionable insights about how you spend your time browsing t
 36 Sep 28, 2022

VDLdraw - Batch plot the log files exported from VisualDL using Matplotlib
VDLdraw Batch plot the log files exported from VisualDL using Matplotlib. At pre
 5 Sep 26, 2022
Color scales in Python for humans
colorlover Color scales for humans IPython notebook: https://plot.ly/ipython-notebooks/color-scales/ import colorlover as cl from IPython.display impo
 146 Sep 25, 2022
Resources for teaching & learning practical data visualization with python.
Practical Data Visualization with Python Overview All views expressed on this site are my own and do not represent the opinions of any entity with whi
 98 Sep 24, 2022

A python script editor for napari based on PyQode.
napari-script-editor A python script editor for napari based on PyQode. This napari plugin was generated with Cookiecutter using with @napari's cookie
 9 Sep 20, 2022
The visual framework is designed on the idea of module and implemented by mixin method
Visual Framework The visual framework is designed on the idea of module and implemented by mixin method. Its biggest feature is the mixins module whic
 9 Sep 19, 2022

a robust room presence solution for home automation with nearly no false negatives
Argos Room Presence This project builds a room presence solution on top of Argos. Using just a cheap raspberry pi zero w (plus an attached pi camera,
 46 Sep 18, 2022
Matplotlib colormaps from the yt project !
cmyt Matplotlib colormaps from the yt project ! Colormaps overview The following colormaps, as well as their respective reversed (*_r) versions are av
 5 Sep 16, 2022
Functions for easily making publication-quality figures with matplotlib.
Data-viz utils 📈 Functions for data visualization in matplotlib 📚 API Can be installed using pip install dvu and then imported with import dvu. You
 16 Sep 15, 2022

LinkedIn connections analyzer
LinkedIn Connections Analyzer 🔗 https://linkedin-analzyer.herokuapp.com Hey hey 👋 , welcome to my LinkedIn connections analyzer. I recently found ou
 5 Sep 13, 2022

A collection of 100 Deep Learning images and visualizations
A collection of Deep Learning images and visualizations. The project has been developed by the AI Summer team and currently contains almost 100 images.
 65 Sep 12, 2022
Visualize the bitcoin blockchain from your local node
Project Overview A new feature in Bitcoin Core 0.20 allows users to dump the state of the blockchain (the UTXO set) using the command dumptxoutset. I'
 18 Sep 11, 2022
Movie recommendation using RASA, TigerGraph
Demo run: The below video will highlight the runtime of this setup and some sample real-time conversations using the power of RASA + TigerGraph, Steps
 3 Sep 10, 2022

This plugin plots the time you spent on a tag as a histogram.
This plugin plots the time you spent on a tag as a histogram.
 7 Sep 9, 2022

A System Metrics Monitoring Tool Built using Python3 , rabbitmq,Grafana and InfluxDB. Setup using docker compose. Use to monitor system performance with graphical interface of grafana , storage of influxdb and message queuing of rabbitmq
SystemMonitoringRabbitMQGrafanaInflux This repository has code to setup a system monitoring tool The tools used are the follows Python3.6 Docker Rabbi
 7 Sep 6, 2022
Visualize tensors in a plain Python REPL using Sparklines
Visualize tensors in a plain Python REPL using Sparklines
 43 Sep 3, 2022
Simple and lightweight Spotify Overlay written in Python.
Simple Spotify Overlay This is a simple yet powerful Spotify Overlay. About I have been looking for something like this ever since I got Spotify. I th
 27 Sep 3, 2022

Chem: collection of mostly python code for molecular visualization, QM/MM, FEP, etc
chem: collection of mostly python code for molecular visualization, QM/MM, FEP,
 5 Sep 2, 2022

Here are my graphs for hw_02
Let's Have A Look At Some Graphs! Graph 1: State Mentions in Congressperson's Tweets on 10/01/2017 The graph below uses this data set to demonstrate h
 7 Sep 2, 2022

These data visualizations were created as homework for my CS40 class. I hope you enjoy!
Data Visualizations These data visualizations were created as homework for my CS40 class. I hope you enjoy! Nobel Laureates by their Country of Birth
 9 Sep 2, 2022
Data visualization electromagnetic spectrum
Datenvisualisierung-Elektromagnetischen-Spektrum Anhand des Moduls matplotlib sollen die Daten des elektromagnetischen Spektrums dargestellt werden. D
 1 Sep 1, 2022

Fractals plotted on MatPlotLib in Python.
About The Project Learning more about fractals through the process of visualization. Built With Matplotlib Numpy License This project is licensed unde
 2 Aug 30, 2022

Rick and Morty Data Visualization with python
Rick and Morty Data Visualization For this project I looked at data for the TV show Rick and Morty Number of Episodes at a Certain Location Here is th
 7 Aug 29, 2022

A tool to plot and execute Rossmos's Formula, that helps to catch serial criminals using mathematics
Rossmo Plotter A tool to plot and execute Rossmos's Formula using python, that helps to catch serial criminals using mathematics Author: Amlan Saha Ku
 3 Aug 29, 2022
Create Badges with stats of Scratch User, Project and Studio. Use those badges in Github readmes, etc.
Scratch-Stats-Badge Create customized Badges with stats of Scratch User, Studio or Project. Use those badges in Github readmes, etc. Examples Document
 5 Aug 28, 2022
Make visual music sheets for thatskygame (graphical representations of the Sky keyboard)
sky-python-music-sheet-maker This program lets you make visual music sheets for Sky: Children of the Light. It will ask you a few questions, and does
 21 Aug 26, 2022

Statistics and Visualization of acceptance rate, main keyword of CVPR 2021 accepted papers for the main Computer Vision conference (CVPR)
Statistics and Visualization of acceptance rate, main keyword of CVPR 2021 accepted papers for the main Computer Vision conference (CVPR)
 78 Aug 23, 2022

mysql relation charts
sqlcharts 自动生成数据库关联关系图 复制settings.py.example 重命名为settings.py 将数据库配置信息填入settings.DATABASE,目前支持mysql和postgresql 执行 python build.py -b,-b是读取数据库表结构,如果只更新匹
 6 Aug 22, 2022

Generate graphs with NetworkX, natively visualize with D3.js and pywebview
webview_d3 This is some PoC code to render graphs created with NetworkX natively using D3.js and pywebview. The main benifit of this approac
 68 Aug 18, 2022

Create a table with row explanations, column headers, using matplotlib
Create a table with row explanations, column headers, using matplotlib. Intended usage was a small table containing a custom heatmap.
 4 Aug 14, 2022
Regress.me is an easy to use data visualization tool powered by Dash/Plotly.
Regress.me Regress.me is an easy to use data visualization tool powered by Dash/Plotly. Regress.me.-.Google.Chrome.2022-05-10.15-58-59.mp4 Get Started
 14 Aug 14, 2022
eoplatform is a Python package that aims to simplify Remote Sensing Earth Observation by providing actionable information on a wide swath of RS platforms and provide a simple API for downloading and visualizing RS imagery
An Earth Observation Platform Earth Observation made easy. Report Bug | Request Feature About eoplatform is a Python package that aims to simplify Rem
 4 Aug 11, 2022

Drug design and development team HackBio internship is a virtual bioinformatics program that introduces students and professional to advanced practical bioinformatics and its applications globally.
-Nyokong. Drug design and development team HackBio internship is a virtual bioinformatics program that introduces students and professional to advance
 4 Aug 4, 2022
This is a web application to visualize various famous technical indicators and stocks tickers from user
Visualizing Technical Indicators Using Python and Plotly. Currently facing issues hosting the application on heroku. As soon as I am able to I'll like
 4 Aug 4, 2022

A python visualization of the A* path finding algorithm
A python visualization of the A* path finding algorithm. It allows you to pick your start, end location and make obstacles and then view the process of finding the shortest path. You can also choose to include or exclude diagonal movement.
 4 Aug 2, 2022

Attractors is a package for simulation and visualization of strange attractors.
attractors Attractors is a package for simulation and visualization of strange attractors. Installation The simplest way to install the module is via
 45 Jul 31, 2022
Peloton Stats to Google Sheets with Data Visualization through Seaborn and Plotly
Peloton Stats to Google Sheets with Data Visualization through Seaborn and Plotly Problem: 2 peloton users were looking for a way to track their metri
 9 Jul 22, 2022
Alternative layout visualizer for ZSA Moonlander keyboard
General info This is a keyboard layout visualizer for ZSA Moonlander keyboard (because I didn't find their Oryx or their training tool particularly us
 10 Jul 19, 2022
AB-test-analyzer - Python class to perform AB test analysis
AB-test-analyzer Python class to perform AB test analysis Overview This repo con
 13 Jul 16, 2022

Moscow DEG 2021 elections plots
Построение графиков на основе публичных данных о ДЭГ в Москве в 2021г. Описание Скрипты в данном репозитории позволяют собственноручно построить графи
 9 Jul 15, 2022

Plot toolbox based on Matplotlib, simple and elegant.
Elegant-Plot Plot toolbox based on Matplotlib, simple and elegant. 绘制效果 绘制过程 数据准备 每种图标类型的目录下有data.csv文件,依据样例数据填入自己的数据。
 3 Jul 15, 2022
A Python package for caclulations and visualizations in geological sciences.
geo_calcs A Python package for caclulations and visualizations in geological sciences. Free software: MIT license Documentation: https://geo-calcs.rea
 1 Jul 12, 2022
阴阳师后台全平台(使用网易 MuMu 模拟器)辅助。支持御魂,觉醒,御灵,结界突破,秘闻副本,地域鬼王。
阴阳师后台全平台辅助 Python 版本:Python 3.8.3 模拟器:网易 MuMu | 雷电模拟器 模拟器分辨率:1024*576 显卡渲染模式:兼容(OpenGL) 兼容 Windows 系统和 MacOS 系统 思路: 利用 adb 截图后,使用 opencv 找图找色,模拟点击。使用
 27 Jul 9, 2022

A visualization tool made in Pygame for various pathfinding algorithms.
Pathfinding-Visualizer 🚀 A visualization tool made in Pygame for various pathfinding algorithms. Pathfinding is closely related to the shortest path
 7 Jul 9, 2022

This is a super simple visualization toolbox (script) for transformer attention visualization ✌
Trans_attention_vis This is a super simple visualization toolbox (script) for transformer attention visualization ✌ 1. How to prepare your attention m
 3 Jul 9, 2022
Standardized plots and visualizations in Python
Standardized plots and visualizations in Python pltviz is a Python package for standardized visualization. Routine and novel plotting approaches are f
 0 Jul 9, 2022
This is a sorting visualizer made with Tkinter.
Sorting-Visualizer This is a sorting visualizer made with Tkinter. Make sure you've installed tkinter in your system to use this visualizer pip instal
 7 Jul 6, 2022
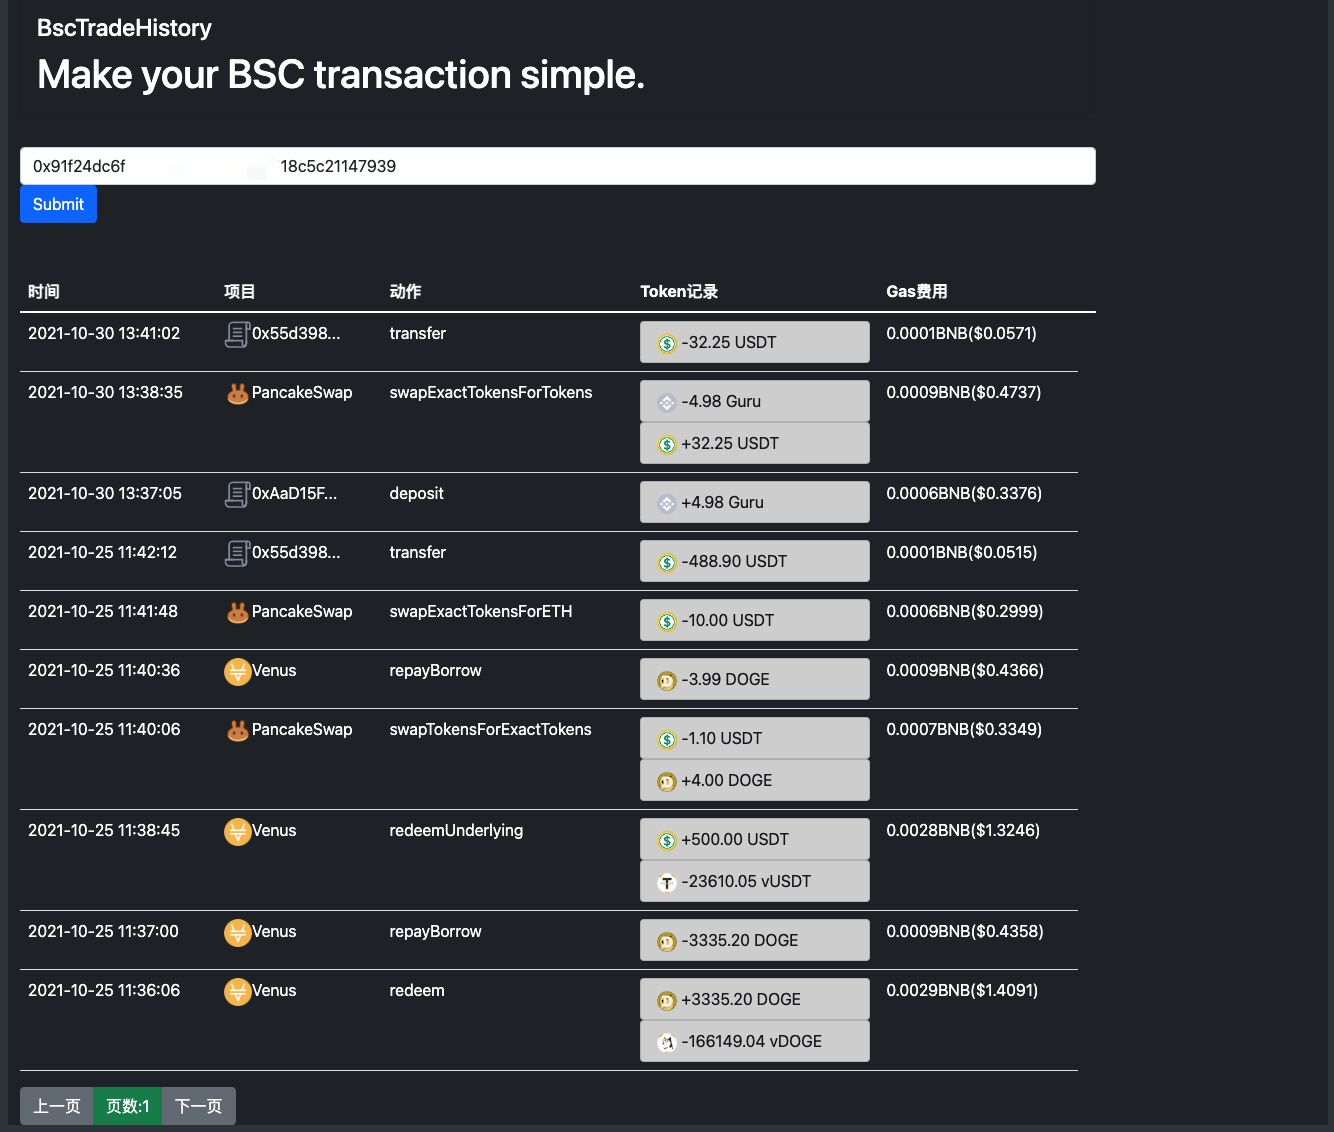
Make your BSC transaction simple.
bsc_trade_history Make your BSC transaction simple. 中文ReadMe Background: inspired by debank ,Practice my hands on this small project Blog:Crypto-BscTr
 7 Jul 6, 2022
Python module for drawing and rendering beautiful atoms and molecules using Blender.
Batoms is a Python package for editing and rendering atoms and molecules objects using blender. A Python interface that allows for automating workflows.
 1 Jul 6, 2022
nptsne is a numpy compatible python binary package that offers a number of APIs for fast tSNE calculation.
nptsne nptsne is a numpy compatible python binary package that offers a number of APIs for fast tSNE calculation and HSNE modelling. For more detail s
 29 Jul 5, 2022

metedraw is a project mainly for data visualization projects of Atmospheric Science, Marine Science, Environmental Science or other majors
It is mainly for data visualization projects of Atmospheric Science, Marine Science, Environmental Science or other majors.
 11 Jul 5, 2022
This is simply repo for line drawing rendering using freestyle in Blender.
blender_freestyle_line_drawing This is simply repo for line drawing rendering using freestyle in Blender. how to use blender2935 --background --python
 3 Jul 2, 2022

Visualize data of Vietnam's regions with interactive maps.
Plotting Vietnam Development Map This is my personal project that I use plotly to analyse and visualize data of Vietnam's regions with interactive map
 1 Jun 26, 2022

A command line tool for visualizing CSV/spreadsheet-like data
PerfPlotter Read data from CSV files using pandas and generate interactive plots using bokeh, which can then be embedded into HTML pages and served by
 0 Jun 25, 2022