582 Repositories
Python Boston-Payroll-Expense-Visualization-Website Libraries

Easily configurable, chart dashboards from any arbitrary API endpoint. JSON config only
Flask JSONDash Easily configurable, chart dashboards from any arbitrary API endpoint. JSON config only. Ready to go. This project is a flask blueprint
This is a webscraper for a specific website
This is a webscraper for a specific website. It is tuned to extract the headlines of that website. With some little adjustments the webscraper is able to extract any part of the website.
A powerful annex BUBT, BUBT Soft, and BUBT website scraping script.
Annex Bubt Scraping Script I think this is the first public repository that provides free annex-BUBT, BUBT-Soft, and BUBT website scraping API script

A part of HyRiver software stack for accessing hydrology data through web services
Package Description Status PyNHD Navigate and subset NHDPlus (MR and HR) using web services Py3DEP Access topographic data through National Map's 3DEP
Tinkerer is a blogging engine/static website generator powered by Sphinx.
Tinkerer What is Tinkerer? Tinkerer is a blogging engine/static website generator powered by Sphinx. It allows blogging in reStructuredText format, co
Fithub is a website application for athletes and fitness enthusiasts of all ages and experience levels.
Fithub is a website application for athletes and fitness enthusiasts of all ages and experience levels. Our website allows users to easily search, filter, and sort our comprehensive database of over 100 exercise types to connect with related equipment and fitness Youtubers. The data is obtained by using eBay and youtube APIs and stored in a mongoDB database
Tools ini hanya bisa digunakan untuk menyerang website atau http/s
☢️ Tawkun DoS ☢️ Tools ini hanya bisa digunakan untuk menyerang website atau http/s FITUR: [ ☯️ ] Proxy Mode [ 🔥 ] SOCKS Mode | Kadang Eror [ ☢️ ] Ht
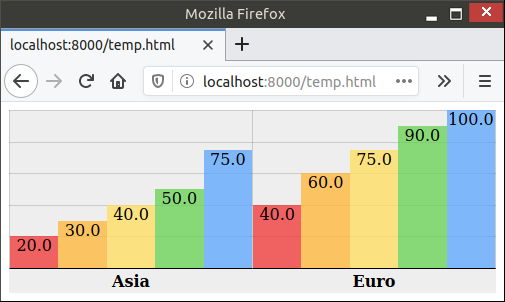
`charts.css.py` brings `charts.css` to Python. Online documentation and samples is available at the link below.
charts.css.py charts.css.py provides a python API to convert your 2-dimension data lists into html snippet, which will be rendered into charts by CSS,

A dashboard built using Plotly-Dash for interactive visualization of Dex-connected individuals across the country.
Dashboard For The DexConnect Platform of Dexterity Global Working prototype submission for internship at Dexterity Global Group. Dashboard for real ti

A python-generated website for visualizing the novel coronavirus (COVID-19) data for Greece.
COVID-19-Greece A python-generated website for visualizing the novel coronavirus (COVID-19) data for Greece. Data sources Data provided by Johns Hopki
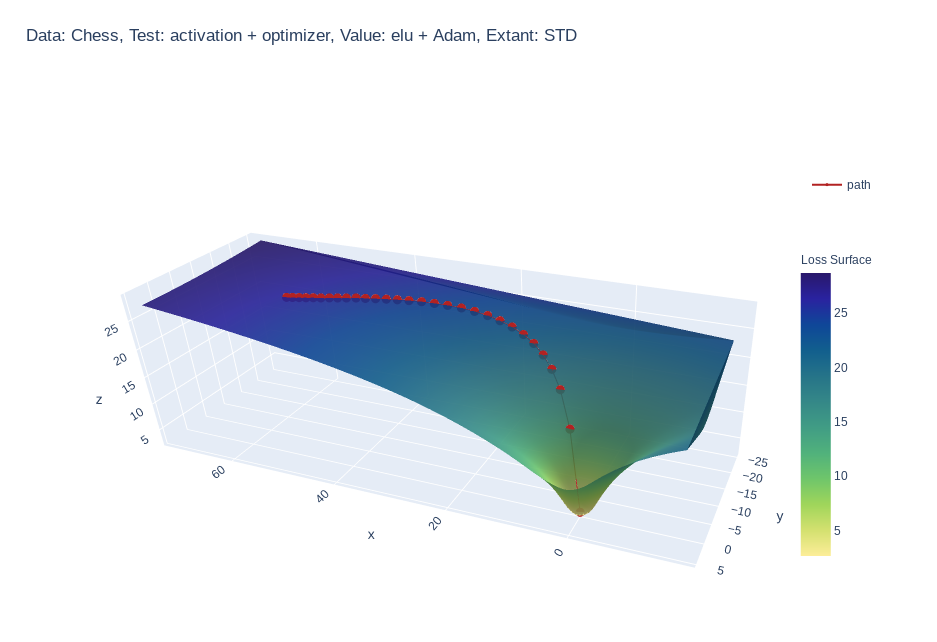
Create 3d loss surface visualizations, with optimizer path. Issues welcome!
MLVTK A loss surface visualization tool Simple feed-forward network trained on chess data, using elu activation and Adam optimizer Simple feed-forward

apysc is the Python frontend library to create html and js file, that has ActionScript 3 (as3)-like interface.
apysc apysc is the Python frontend library to create HTML and js files, that has ActionScript 3 (as3)-like interface. Notes: Currently developing and
Track requests to your Flask website with Matomo
Flask-Matomo Flask-Matomo is a library which lets you track the requests of your Flask website using Matomo (Piwik). Installation pip install flask-ma
A small Django app to easily broadcast an announcement across a website.
django-site-broadcasts The site broadcast application allows users to define short messages and announcements that should be displayed across a site.

A concise grammar of interactive graphics, built on Vega.
Vega-Lite Vega-Lite provides a higher-level grammar for visual analysis that generates complete Vega specifications. You can find more details, docume

Grammar of Scalable Linked Interactive Nucleotide Graphics
Gosling.js Gosling.js is a declarative grammar for interactive (epi)genomics visualization on the Web. ⚠️ Please be aware that the grammar of Gosling.

A declarative (epi)genomics visualization library for Python
gos is a declarative (epi)genomics visualization library for Python. It is built on top of the Gosling JSON specification, providing a simplified interface for authoring interactive genomic visualizations.

Pytorch Implementations of large number classical backbone CNNs, data enhancement, torch loss, attention, visualization and some common algorithms.
Torch-template-for-deep-learning Pytorch implementations of some **classical backbone CNNs, data enhancement, torch loss, attention, visualization and

A web scraper for nomadlist.com, made to avoid website restrictions.
Gypsylist gypsylist.py is a web scraper for nomadlist.com, made to avoid website restrictions. nomadlist.com is a website with a lot of information fo
Interactive Visualization to empower domain experts to align ML model behaviors with their knowledge.
An interactive visualization system designed to helps domain experts responsibly edit Generalized Additive Models (GAMs). For more information, check
Codes for the compilation and visualization examples to the HIF vegetation dataset
High-impedance vegetation fault dataset This repository contains the codes that compile the "Vegetation Conduction Ignition Test Report" data, which a
Linky bot, A open-source discord bot that allows you to add links to ur website, youtube url, etc for the people all around discord to see!
LinkyBot Linky bot, An open-source discord bot that allows you to add links to ur website, youtube url, etc for the people all around discord to see!

CNN visualization tool in TensorFlow
tf_cnnvis A blog post describing the library: https://medium.com/@falaktheoptimist/want-to-look-inside-your-cnn-we-have-just-the-right-tool-for-you-ad

Implementation of the ivis algorithm as described in the paper Structure-preserving visualisation of high dimensional single-cell datasets.
Implementation of the ivis algorithm as described in the paper Structure-preserving visualisation of high dimensional single-cell datasets.

Data Visualizer Web-Application
Viz-It Data Visualizer Web-Application If I ask you where most of the data wrangler looses their time ? It is Data Overview and EDA. Presenting "Viz-I
A website for courses of Major Computer Science, NKU
A website for courses of Major Computer Science, NKU
Fast visualization of radar_scenes based on oleschum/radar_scenes
RadarScenes Tools About This python package provides fast visualization for the RadarScenes dataset. The Open GL based visualizer is smoother than ole
The first public repository that provides free BUBT website scraping API script on Github.
BUBT WEBSITE SCRAPPING SCRIPT I think this is the first public repository that provides free BUBT website scraping API script on github. When I was do
Website for D2C paper
D2C This is the repository that contains source code for the D2C Website. If you find D2C useful for your work please cite: @article{sinha2021d2c au

Visualize large time-series data in plotly
plotly_resampler enables visualizing large sequential data by adding resampling functionality to Plotly figures. In this Plotly-Resampler demo over 11
FIVE, Vulnerability Scanner And Mass Exploiter, made for pentesting.
$ FIVE - FIVE is a Pentesting Framework to Test the Security & Integrity of a Website, or Multiple Websites. $ Info FIVE Was Made After Vulnnr to Prod

Python toolkit for defining+simulating+visualizing+analyzing attractors, dynamical systems, iterated function systems, roulette curves, and more
Attractors A small module that provides functions and classes for very efficient simulation and rendering of iterated function systems; dynamical syst

hCaptcha solver and bypasser for Python Selenium. Simple website to try to solve hCaptcha.
hCaptcha solver for Python Selenium. Many thanks to engageub for his hCaptcha solver userscript. This script is solely intended for the use of educati
Scrapping the data from each page of biocides listed on the BAUA website into a csv file
Scrapping the data from each page of biocides listed on the BAUA website into a csv file

Plot and save the ground truth and predicted results of human 3.6 M and CMU mocap dataset.
Visualization-of-Human3.6M-Dataset Plot and save the ground truth and predicted results of human 3.6 M and CMU mocap dataset. human-motion-prediction

🛰️ Scripts démontrant l'utilisation de l'imagerie RADARSAT-1 à partir d'un seau AWS | 🛰️ Scripts demonstrating the use of RADARSAT-1 imagery from an AWS bucket
🛰️ Scripts démontrant l'utilisation de l'imagerie RADARSAT-1 à partir d'un seau AWS | 🛰️ Scripts demonstrating the use of RADARSAT-1 imagery from an AWS bucket
A package that provides you Latest Cyber/Hacker News from website using Web-Scraping.
cybernews A package that provides you Latest Cyber/Hacker News from website using Web-Scraping. Latest Cyber/Hacker News Using Webscraping Developed b

🌐 Local tile server for viewing geospatial raster files with ipyleaflet or folium
🌐 Local Tile Server for Geospatial Rasters Need to visualize a rather large (gigabytes) raster you have locally? This is for you. A Flask application

Boston House Prediction Valuation Tool
Boston-House-Prediction-Valuation-Tool From Below Anlaysis The Valuation Tool is Designed Correlation Matrix Regrssion Analysis Between Target Vs Pred
Learning Convolutional Neural Networks with Interactive Visualization.
CNN Explainer An interactive visualization system designed to help non-experts learn about Convolutional Neural Networks (CNNs) For more information,

We want to check several batch of web URLs (1~100 K) and find the phishing website/URL among them.
We want to check several batch of web URLs (1~100 K) and find the phishing website/URL among them. This module is designed to do the URL/web attestation by using the API from NUS-Phishperida-Project.

Automatically visualize your pandas dataframe via a single print! 📊 💡
A Python API for Intelligent Visual Discovery Lux is a Python library that facilitate fast and easy data exploration by automating the visualization a
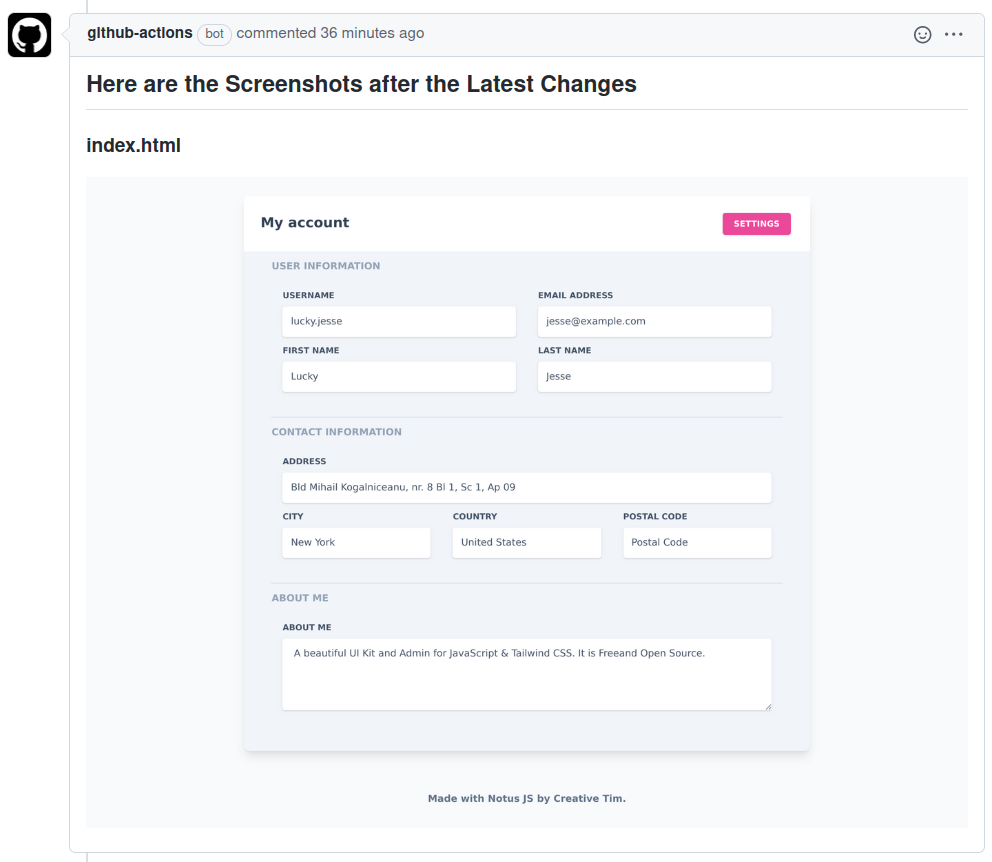
Comment Webpage Screenshot is a GitHub Action that captures screenshots of web pages and HTML files located in the repository
Comment Webpage Screenshot is a GitHub Action that helps maintainers visually review HTML file changes introduced on a Pull Request by adding comments with the screenshots of the latest HTML file changes on the Pull Request

Delve is a Python package for analyzing the inference dynamics of your PyTorch model.
Delve is a Python package for analyzing the inference dynamics of your PyTorch model.

Python+Numpy+OpenGL: fast, scalable and beautiful scientific visualization
Python+Numpy+OpenGL: fast, scalable and beautiful scientific visualization

Tensorboard for pytorch (and chainer, mxnet, numpy, ...)
tensorboardX Write TensorBoard events with simple function call. The current release (v2.3) is tested on anaconda3, with PyTorch 1.8.1 / torchvision 0
Fast Fourier Transform-accelerated Interpolation-based t-SNE (FIt-SNE)
FFT-accelerated Interpolation-based t-SNE (FIt-SNE) Introduction t-Stochastic Neighborhood Embedding (t-SNE) is a highly successful method for dimensi
An interactive UMAP visualization of the MNIST data set.
Code for an interactive UMAP visualization of the MNIST data set. Demo at https://grantcuster.github.io/umap-explorer/. You can read more about the de
Live training loss plot in Jupyter Notebook for Keras, PyTorch and others
livelossplot Don't train deep learning models blindfolded! Be impatient and look at each epoch of your training! (RECENT CHANGES, EXAMPLES IN COLAB, A

3D rendered visualization of the austrian monuments registry
Visualization of the Austrian Monuments Visualization of the monument landscape of the austrian monuments registry (Bundesdenkmalamt Denkmalverzeichni
Create beautiful diagrams just by typing mathematical notation in plain text.
Penrose Penrose is an early-stage system that is still in development. Our system is not ready for contributions or public use yet, but hopefully will
A Bokeh project developed for learning and teaching Bokeh interactive plotting!
Bokeh-Python-Visualization A Bokeh project developed for learning and teaching Bokeh interactive plotting! See my medium blog posts about making bokeh
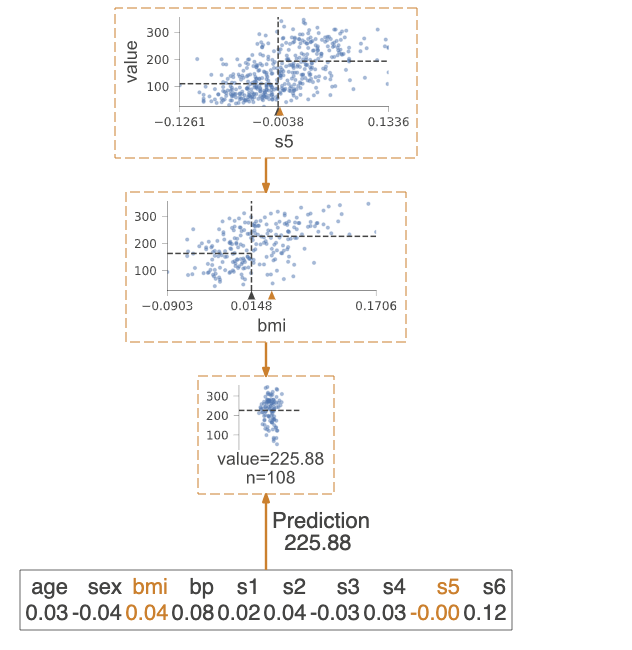
A python library for decision tree visualization and model interpretation.
dtreeviz : Decision Tree Visualization Description A python library for decision tree visualization and model interpretation. Currently supports sciki
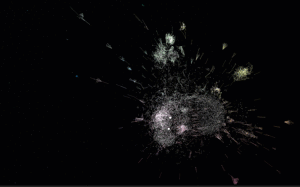
Package managers visualization
Software Galaxies This repository combines visualizations of major software package managers. All visualizations are available here: http://anvaka.git

Fast scatter density plots for Matplotlib
About Plotting millions of points can be slow. Real slow... 😴 So why not use density maps? ⚡ The mpl-scatter-density mini-package provides functional

Streamlit — The fastest way to build data apps in Python
Welcome to Streamlit 👋 The fastest way to build and share data apps. Streamlit lets you turn data scripts into sharable web apps in minutes, not week

Visualization ideas for data science
Nuance I use Nuance to curate varied visualization thoughts during my data scientist career. It is not yet a package but a list of small ideas. Welcom
Python library for interactive topic model visualization. Port of the R LDAvis package.
pyLDAvis Python library for interactive topic model visualization. This is a port of the fabulous R package by Carson Sievert and Kenny Shirley. pyLDA
Nick Craig-Wood's Website
Nick Craig-Wood's public website This directory tree is used to build all the different docs for Nick Craig-Wood's website. The content here is (c) Ni

🌐 Local tile server for viewing geospatial raster files with ipyleaflet
🌐 Local Tile Server for Geospatial Rasters Need to visualize a rather large raster (gigabytes) you have locally? This is for you. A Flask application
UNAVOIDS: Unsupervised and Nonparametric Approach for Visualizing Outliers and Invariant Detection Scoring
UNAVOIDS: Unsupervised and Nonparametric Approach for Visualizing Outliers and Invariant Detection Scoring Code Summary aggregate.py: this script aggr

Neural network graphs and training metrics for PyTorch, Tensorflow, and Keras.
HiddenLayer A lightweight library for neural network graphs and training metrics for PyTorch, Tensorflow, and Keras. HiddenLayer is simple, easy to ex

Source code and notebooks to reproduce experiments and benchmarks on Bias Faces in the Wild (BFW).
Face Recognition: Too Bias, or Not Too Bias? Robinson, Joseph P., Gennady Livitz, Yann Henon, Can Qin, Yun Fu, and Samson Timoner. "Face recognition:

Biterm Topic Model (BTM): modeling topics in short texts
Biterm Topic Model Bitermplus implements Biterm topic model for short texts introduced by Xiaohui Yan, Jiafeng Guo, Yanyan Lan, and Xueqi Cheng. Actua

PyExplainer: A Local Rule-Based Model-Agnostic Technique (Explainable AI)
PyExplainer PyExplainer is a local rule-based model-agnostic technique for generating explanations (i.e., why a commit is predicted as defective) of J

An interactive dashboard for visualisation, integration and classification of data using Active Learning.
AstronomicAL An interactive dashboard for visualisation, integration and classification of data using Active Learning. AstronomicAL is a human-in-the-
This repository contains code for building education startup.
Learning Management System Overview It's the code for EssayBrain, a tool for teacher that automatically grades and validates essays. In order to valid

A simple djagno music website.
Mrock A simple djagno music website. I used this template and I translated it to eng. Also some changes commited. My Live Domo : https://mrock.pythona

An educational platform for students
Watch N Learn About Watch N Learn is an educational platform for students. Watch N Learn incentivizes students to learn with fun activities and reward

Neurons Dataset API - The official dataloader and visualization tools for Neurons Datasets.
Neurons Dataset API - The official dataloader and visualization tools for Neurons Datasets. Introduction We propose our dataloader API for loading and
A template themes for phyton flask website
Flask Phyton Web template A template themes for phyton flask website
Cryptocurrency Centralized Exchange Visualization
This is a simple one that uses Grafina to visualize cryptocurrency from the Bitkub exchange. This service will make a request to the Bitkub API from your wallet and save the response to Postgresql. Grafina will retrieve data from Postgresql and display the graph.

Visualization of numerical optimization algorithms
Visualization of numerical optimization algorithms

A multi-platform GUI for bit-based analysis, processing, and visualization
A multi-platform GUI for bit-based analysis, processing, and visualization

Render tokei's output to interactive sunburst chart.
Render tokei's output to interactive sunburst chart.
Project issue to website data transformation toolkit
braintransform Project issue to website data transformation toolkit. Introduction The purpose of these scripts is to be able to dynamically generate t

Pebble is a stat's visualization tool, this will provide a skeleton to develop a monitoring tool.
Pebble is a stat's visualization tool, this will provide a skeleton to develop a monitoring tool.
An insecure login and registration website with Django.
An insecure login and registration website with Django.
An airlines clone website with django
abc_airlines is a clone website of an airlines system the way it works is that first you add flights to the website then the users can search flights

Portfolio analytics for quants, written in Python
QuantStats: Portfolio analytics for quants QuantStats Python library that performs portfolio profiling, allowing quants and portfolio managers to unde

Python package to visualize and cluster partial dependence.
partial_dependence A python library for plotting partial dependence patterns of machine learning classifiers. The technique is a black box approach to

moDel Agnostic Language for Exploration and eXplanation
moDel Agnostic Language for Exploration and eXplanation Overview Unverified black box model is the path to the failure. Opaqueness leads to distrust.

Scientific Visualization: Python + Matplotlib
An open access book on scientific visualization using python and matplotlib

Interactive convnet features visualization for Keras
Quiver Interactive convnet features visualization for Keras The quiver workflow Video Demo Build your model in keras model = Model(...) Launch the vis

VizTracer is a low-overhead logging/debugging/profiling tool that can trace and visualize your python code execution.
VizTracer is a low-overhead logging/debugging/profiling tool that can trace and visualize your python code execution.
Doom o’clock is a website/project that features a countdown of “when will the earth end” and a greenhouse gas effect emission prediction that’s predicted
Doom o’clock is a website/project that features a countdown of “when will the earth end” and a greenhouse gas effect emission prediction that’s predicted
Django Phyton Web Apps template themes
Django Phyton Web Apps template themes Free download source code project for build a modern website using django phyton web apps. Documentation instal

Screenhook is a script that captures an image of a web page and send it to a discord webhook.
screenshot from the web for discord webhooks screenhook is a script that captures an image of a web page and send it to a discord webhook.
Scraping Bot for the Covid19 vaccination website of the Canton of Zurich, Switzerland.
Hi 👋 , I'm David A passionate developer from France. 🌱 I’m currently learning Kotlin, ReactJS and Kubernetes 👨💻 All of my projects are available
A static website generator for people who enjoy the simpler things in life.
A static website generator for people who enjoy the simpler things in life.

NexScanner is a tool which allows you to scan a website and find the admin login panel and sub-domains
NexScanner NexScanner is a tool which helps you scan a website for sub-domains and also to find login pages in the website like the admin login panel

Pytools is an open source library containing general machine learning and visualisation utilities for reuse
pytools is an open source library containing general machine learning and visualisation utilities for reuse, including: Basic tools for API developmen

Image Segmentation using U-Net, U-Net with skip connections and M-Net architectures
Brain-Image-Segmentation Segmentation of brain tissues in MRI image has a number of applications in diagnosis, surgical planning, and treatment of bra
Chess bot can play automatically as white or black on lichess.com, chess.com and any website using drag and drop to move pieces
Chessbot "Why create another chessbot ?" The explanation is simple : I did not find a free bot I liked online : all the bots I saw on internet are par

Daily social mapping project in November 2021. Maps made using PyGMT whenever possible.
Daily social mapping project in November 2021. Maps made using PyGMT whenever possible.

Python Package for CanvasXpress JS Visualization Tools
CanvasXpress Python Library About CanvasXpress for Python CanvasXpress was developed as the core visualization component for bioinformatics and system

A simple project on Data Visualization for CSCI-40 course.
Simple-Data-Visualization A simple project on Data Visualization for CSCI-40 course - the instructions can be found here SAT results in New York in 20
ecoglib: visualization and statistics for high density microecog signals
ecoglib: visualization and statistics for high density microecog signals This library contains high-level analysis tools for "topos" and "chronos" asp

A program that can download animations from myself website
MYD A program that can download animations from myself website 一個可以用來下載Myself網站上動漫的程式 Quick Start [無GUI版本] 確定電腦內包含 ffmpeg 並設為環境變數 (Environment Variabl

Exploratory analysis and data visualization of aircraft accidents and incidents in Brazil.
Exploring aircraft accidents in Brazil Occurrencies with aircraft in Brazil are investigated by the Center for Investigation and Prevention of Aircraf