710 Repositories
Python Visualization-of-the-Fourier-series Libraries

A package which efficiently applies any function to a pandas dataframe or series in the fastest available manner
swifter A package which efficiently applies any function to a pandas dataframe or series in the fastest available manner. Blog posts Release 1.0.0 Fir
High performance datastore for time series and tick data
Arctic TimeSeries and Tick store Arctic is a high performance datastore for numeric data. It supports Pandas, numpy arrays and pickled objects out-of-

Logging MXNet data for visualization in TensorBoard.
Logging MXNet Data for Visualization in TensorBoard Overview MXBoard provides a set of APIs for logging MXNet data for visualization in TensorBoard. T

tensorboard for pytorch (and chainer, mxnet, numpy, ...)
tensorboardX Write TensorBoard events with simple function call. The current release (v2.1) is tested on anaconda3, with PyTorch 1.5.1 / torchvision 0
A collection of infrastructure and tools for research in neural network interpretability.
Lucid Lucid is a collection of infrastructure and tools for research in neural network interpretability. We're not currently supporting tensorflow 2!

🎆 A visualization of the CapsNet layers to better understand how it works
CapsNet-Visualization For more information on capsule networks check out my Medium articles here and here. Setup Use pip to install the required pytho

An intuitive library to add plotting functionality to scikit-learn objects.
Welcome to Scikit-plot Single line functions for detailed visualizations The quickest and easiest way to go from analysis... ...to this. Scikit-plot i

Visual analysis and diagnostic tools to facilitate machine learning model selection.
Yellowbrick Visual analysis and diagnostic tools to facilitate machine learning model selection. What is Yellowbrick? Yellowbrick is a suite of visual
![Python histogram library - histograms as updateable, fully semantic objects with visualization tools. [P]ython [HYST]ograms.](https://github.com/janpipek/physt/raw/dev/doc/heights.png)
Python histogram library - histograms as updateable, fully semantic objects with visualization tools. [P]ython [HYST]ograms.
physt P(i/y)thon h(i/y)stograms. Inspired (and based on) numpy.histogram, but designed for humans(TM) on steroids(TM). The goal is to unify different
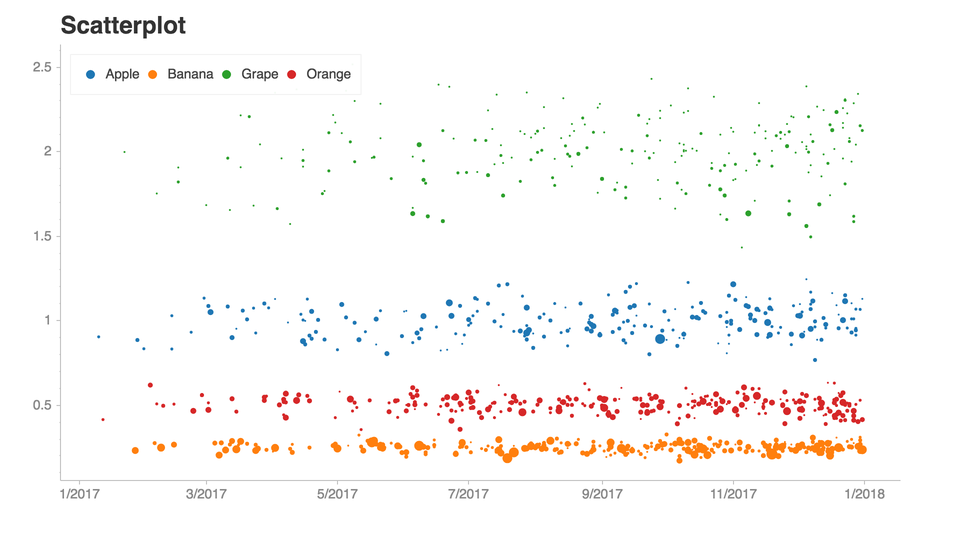
Python library that makes it easy for data scientists to create charts.
Chartify Chartify is a Python library that makes it easy for data scientists to create charts. Why use Chartify? Consistent input data format: Spend l
Train/evaluate a Keras model, get metrics streamed to a dashboard in your browser.
Hera Train/evaluate a Keras model, get metrics streamed to a dashboard in your browser. Setting up Step 1. Plant the spy Install the package pip

Probabilistic programming framework that facilitates objective model selection for time-varying parameter models.
Time series analysis today is an important cornerstone of quantitative science in many disciplines, including natural and life sciences as well as eco
Open source time series library for Python
PyFlux PyFlux is an open source time series library for Python. The library has a good array of modern time series models, as well as a flexible array
Tool for producing high quality forecasts for time series data that has multiple seasonality with linear or non-linear growth.
Prophet: Automatic Forecasting Procedure Prophet is a procedure for forecasting time series data based on an additive model where non-linear trends ar
A machine learning toolkit dedicated to time-series data
tslearn The machine learning toolkit for time series analysis in Python Section Description Installation Installing the dependencies and tslearn Getti
Code examples for my Write Better Python Code series on YouTube.
Write Better Python Code This repository contains the code examples used in my Write Better Python Code series published on YouTube: https:/

🍊 :bar_chart: :bulb: Orange: Interactive data analysis
Orange Data Mining Orange is a data mining and visualization toolbox for novice and expert alike. To explore data with Orange, one requires no program
A modular single-molecule analysis interface
MOSAIC: A modular single-molecule analysis interface MOSAIC is a single molecule analysis toolbox that automatically decodes multi-state nanopore data
3D visualization of scientific data in Python
Mayavi: 3D visualization of scientific data in Python Mayavi docs: http://docs.enthought.com/mayavi/mayavi/ TVTK docs: http://docs.enthought.com/mayav

An interactive explorer for single-cell transcriptomics data
an interactive explorer for single-cell transcriptomics data cellxgene (pronounced "cell-by-gene") is an interactive data explorer for single-cell tra
Automatic Video Library Manager for TV Shows. It watches for new episodes of your favorite shows, and when they are posted it does its magic.
Automatic Video Library Manager for TV Shows. It watches for new episodes of your favorite shows, and when they are posted it does its magic. Exclusiv
ForecastGA is a Python tool to forecast Google Analytics data using several popular time series models.
ForecastGA is a tool that combines a couple of popular libraries, Atspy and googleanalytics, with a few enhancements.

Python package for hypergraph analysis and visualization.
The HyperNetX library provides classes and methods for the analysis and visualization of complex network data. HyperNetX uses data structures designed to represent set systems containing nested data and/or multi-way relationships. The library generalizes traditional graph metrics to hypergraphs.
Sequence-to-sequence framework with a focus on Neural Machine Translation based on Apache MXNet
Sockeye This package contains the Sockeye project, an open-source sequence-to-sequence framework for Neural Machine Translation based on Apache MXNet

Text preprocessing, representation and visualization from zero to hero.
Text preprocessing, representation and visualization from zero to hero. From zero to hero • Installation • Getting Started • Examples • API • FAQ • Co
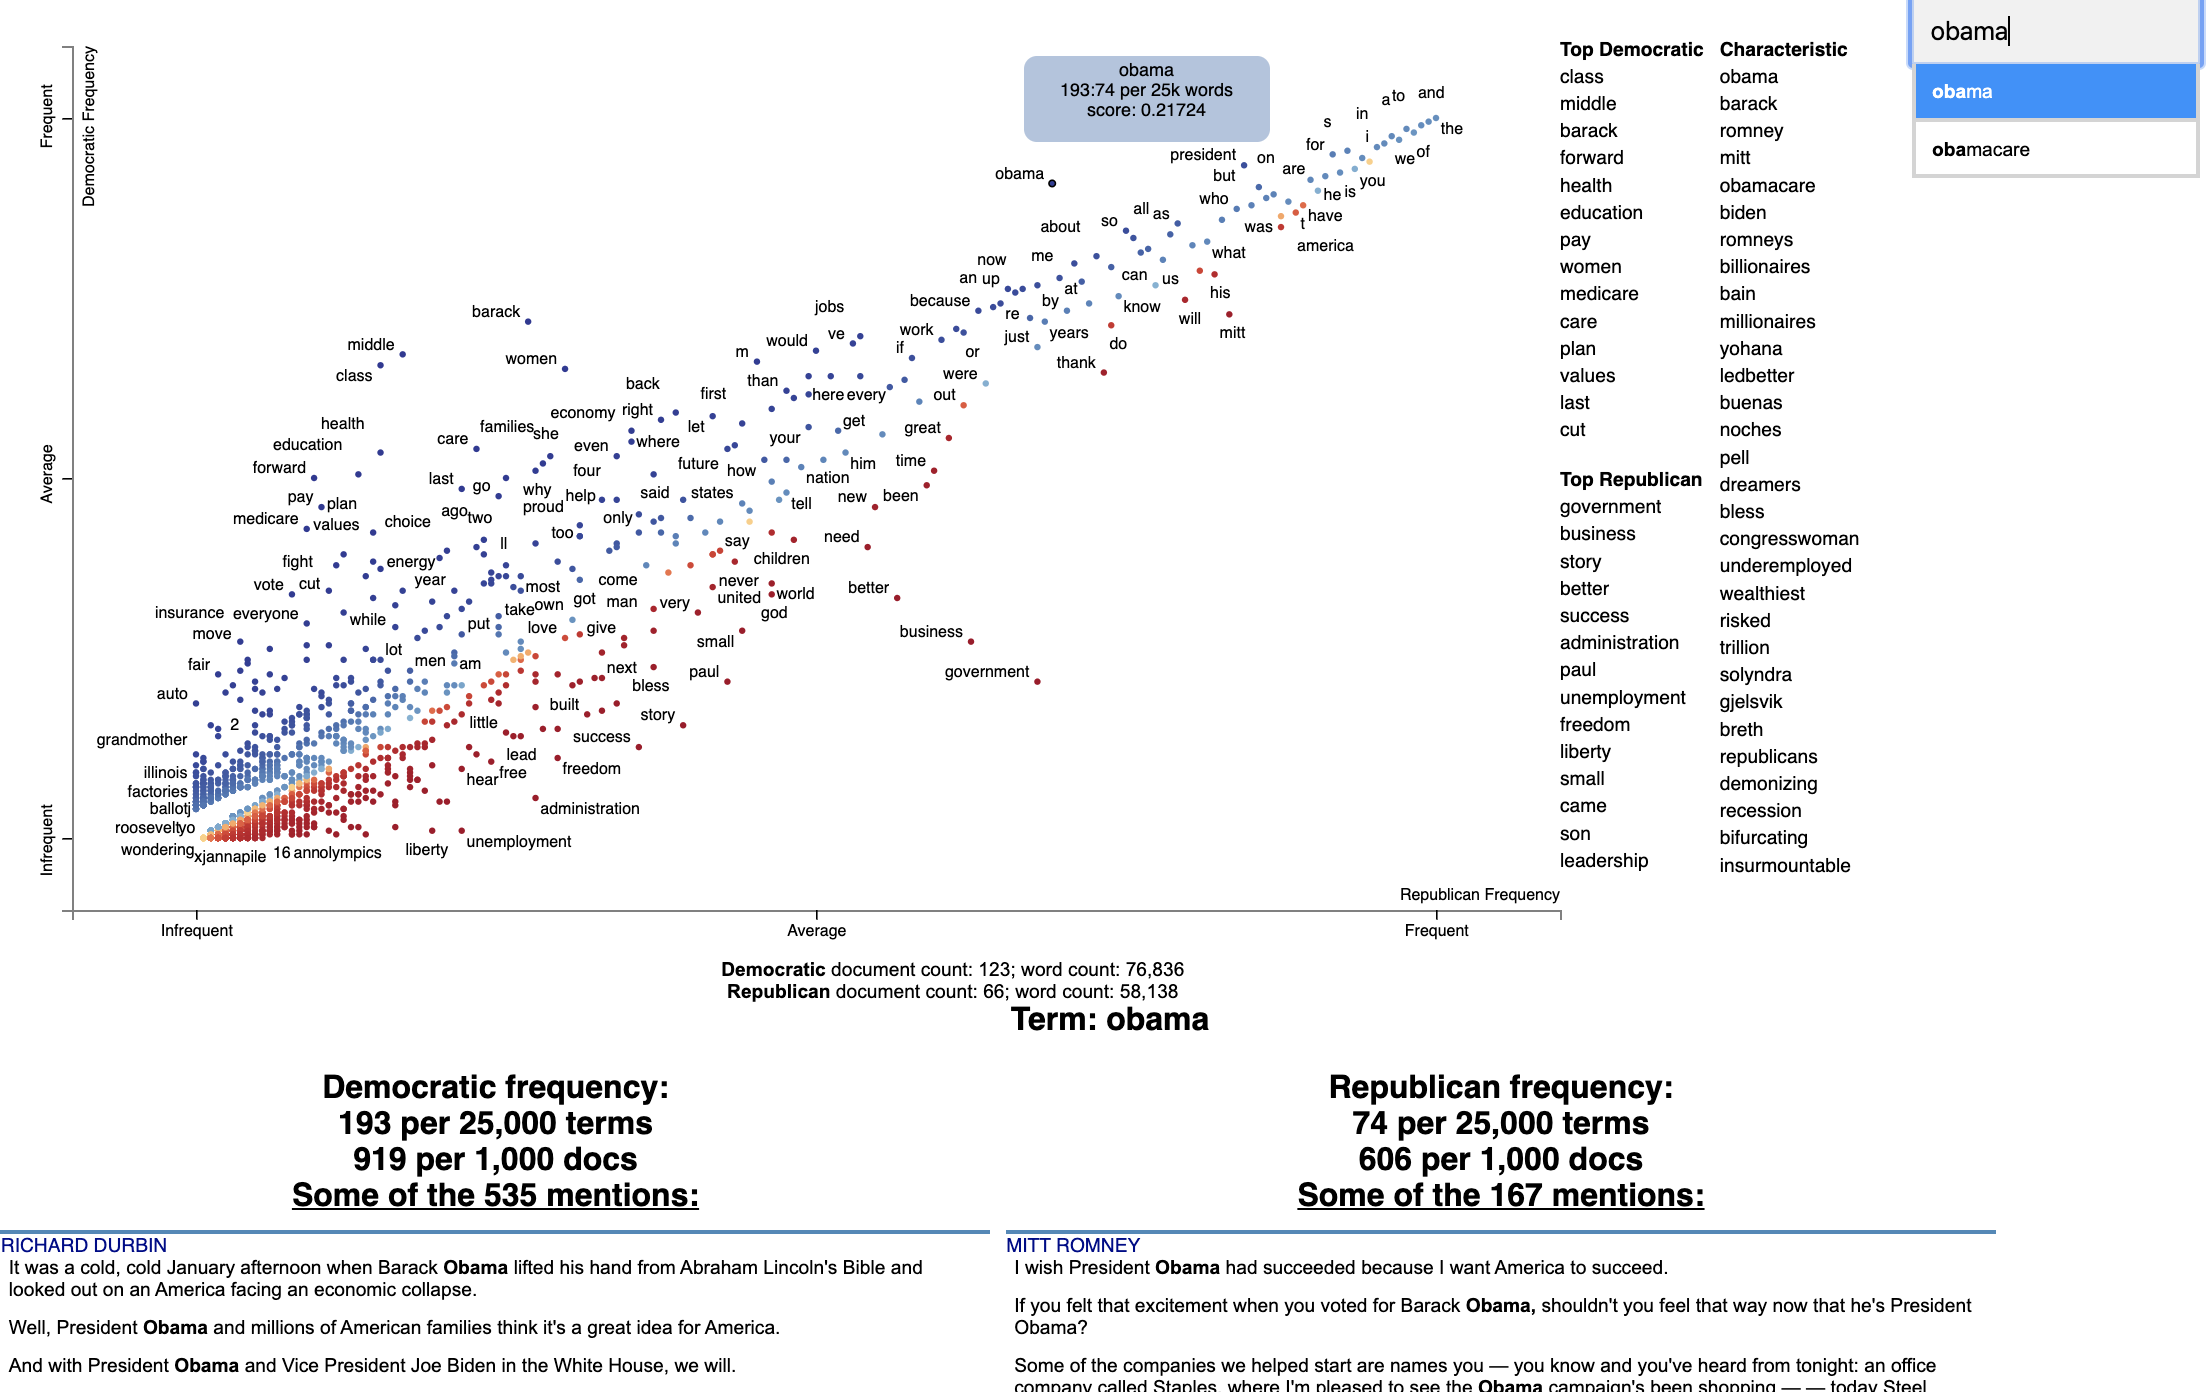
Beautiful visualizations of how language differs among document types.
Scattertext 0.1.0.0 A tool for finding distinguishing terms in corpora and displaying them in an interactive HTML scatter plot. Points corresponding t

Dimensionality reduction in very large datasets using Siamese Networks
ivis Implementation of the ivis algorithm as described in the paper Structure-preserving visualisation of high dimensional single-cell datasets. Ivis
🧇 Make Waffle Charts in Python.
PyWaffle PyWaffle is an open source, MIT-licensed Python package for plotting waffle charts. It provides a Figure constructor class Waffle, which coul

Automatically Visualize any dataset, any size with a single line of code. Created by Ram Seshadri. Collaborators Welcome. Permission Granted upon Request.
AutoViz Automatically Visualize any dataset, any size with a single line of code. AutoViz performs automatic visualization of any dataset with one lin

A python package for animating plots build on matplotlib.
animatplot A python package for making interactive as well as animated plots with matplotlib. Requires Python = 3.5 Matplotlib = 2.2 (because slider

An open-source plotting library for statistical data.
Lets-Plot Lets-Plot is an open-source plotting library for statistical data. It is implemented using the Kotlin programming language. The design of Le
Visualize and compare datasets, target values and associations, with one line of code.
In-depth EDA (target analysis, comparison, feature analysis, correlation) in two lines of code! Sweetviz is an open-source Python library that generat

Joyplots in Python with matplotlib & pandas :chart_with_upwards_trend:
JoyPy JoyPy is a one-function Python package based on matplotlib + pandas with a single purpose: drawing joyplots (a.k.a. ridgeline plots). The code f

Extensible, parallel implementations of t-SNE
openTSNE openTSNE is a modular Python implementation of t-Distributed Stochasitc Neighbor Embedding (t-SNE) [1], a popular dimensionality-reduction al

Visualizations for machine learning datasets
Introduction The facets project contains two visualizations for understanding and analyzing machine learning datasets: Facets Overview and Facets Dive

Python library that makes it easy for data scientists to create charts.
Chartify Chartify is a Python library that makes it easy for data scientists to create charts. Why use Chartify? Consistent input data format: Spend l

A Python toolbox for gaining geometric insights into high-dimensional data
"To deal with hyper-planes in a 14 dimensional space, visualize a 3D space and say 'fourteen' very loudly. Everyone does it." - Geoff Hinton Overview

3D plotting and mesh analysis through a streamlined interface for the Visualization Toolkit (VTK)
PyVista Deployment Build Status Metrics Citation License Community 3D plotting and mesh analysis through a streamlined interface for the Visualization
Streaming pivot visualization via WebAssembly
Perspective is an interactive visualization component for large, real-time datasets. Originally developed for J.P. Morgan's trading business, Perspect
Missing data visualization module for Python.
missingno Messy datasets? Missing values? missingno provides a small toolset of flexible and easy-to-use missing data visualizations and utilities tha
Main repository for Vispy
VisPy: interactive scientific visualization in Python Main website: http://vispy.org VisPy is a high-performance interactive 2D/3D data visualization
Fast data visualization and GUI tools for scientific / engineering applications
PyQtGraph A pure-Python graphics library for PyQt5/PyQt6/PySide2/PySide6 Copyright 2020 Luke Campagnola, University of North Carolina at Chapel Hill h

Uniform Manifold Approximation and Projection
UMAP Uniform Manifold Approximation and Projection (UMAP) is a dimension reduction technique that can be used for visualisation similarly to t-SNE, bu

Declarative statistical visualization library for Python
Altair http://altair-viz.github.io Altair is a declarative statistical visualization library for Python. With Altair, you can spend more time understa
Interactive Data Visualization in the browser, from Python
Bokeh is an interactive visualization library for modern web browsers. It provides elegant, concise construction of versatile graphics, and affords hi

Analytical Web Apps for Python, R, Julia, and Jupyter. No JavaScript Required.
Dash Dash is the most downloaded, trusted Python framework for building ML & data science web apps. Built on top of Plotly.js, React and Flask, Dash t
Statistical data visualization using matplotlib
seaborn: statistical data visualization Seaborn is a Python visualization library based on matplotlib. It provides a high-level interface for drawing

The interactive graphing library for Python (includes Plotly Express) :sparkles:
plotly.py Latest Release User forum PyPI Downloads License Data Science Workspaces Our recommended IDE for Plotly’s Python graphing library is Dash En

Gammatone-based spectrograms, using gammatone filterbanks or Fourier transform weightings.
Gammatone Filterbank Toolkit Utilities for analysing sound using perceptual models of human hearing. Jason Heeris, 2013 Summary This is a port of Malc

text_recognition_toolbox: The reimplementation of a series of classical scene text recognition papers with Pytorch in a uniform way.
text recognition toolbox 1. 项目介绍 该项目是基于pytorch深度学习框架,以统一的改写方式实现了以下6篇经典的文字识别论文,论文的详情如下。该项目会持续进行更新,欢迎大家提出问题以及对代码进行贡献。 模型 论文标题 发表年份 模型方法划分 CRNN 《An End-t
MINIROCKET: A Very Fast (Almost) Deterministic Transform for Time Series Classification
MINIROCKET: A Very Fast (Almost) Deterministic Transform for Time Series Classification

Implementation of the paper NAST: Non-Autoregressive Spatial-Temporal Transformer for Time Series Forecasting.
Non-AR Spatial-Temporal Transformer Introduction Implementation of the paper NAST: Non-Autoregressive Spatial-Temporal Transformer for Time Series For
Sequence-to-sequence framework with a focus on Neural Machine Translation based on Apache MXNet
Sockeye This package contains the Sockeye project, an open-source sequence-to-sequence framework for Neural Machine Translation based on Apache MXNet

Text preprocessing, representation and visualization from zero to hero.
Text preprocessing, representation and visualization from zero to hero. From zero to hero • Installation • Getting Started • Examples • API • FAQ • Co

Beautiful visualizations of how language differs among document types.
Scattertext 0.1.0.0 A tool for finding distinguishing terms in corpora and displaying them in an interactive HTML scatter plot. Points corresponding t

Dimensionality reduction in very large datasets using Siamese Networks
ivis Implementation of the ivis algorithm as described in the paper Structure-preserving visualisation of high dimensional single-cell datasets. Ivis
🧇 Make Waffle Charts in Python.
PyWaffle PyWaffle is an open source, MIT-licensed Python package for plotting waffle charts. It provides a Figure constructor class Waffle, which coul

Automatically Visualize any dataset, any size with a single line of code. Created by Ram Seshadri. Collaborators Welcome. Permission Granted upon Request.
AutoViz Automatically Visualize any dataset, any size with a single line of code. AutoViz performs automatic visualization of any dataset with one lin

A python package for animating plots build on matplotlib.
animatplot A python package for making interactive as well as animated plots with matplotlib. Requires Python = 3.5 Matplotlib = 2.2 (because slider

An open-source plotting library for statistical data.
Lets-Plot Lets-Plot is an open-source plotting library for statistical data. It is implemented using the Kotlin programming language. The design of Le
Visualize and compare datasets, target values and associations, with one line of code.
In-depth EDA (target analysis, comparison, feature analysis, correlation) in two lines of code! Sweetviz is an open-source Python library that generat

Joyplots in Python with matplotlib & pandas :chart_with_upwards_trend:
JoyPy JoyPy is a one-function Python package based on matplotlib + pandas with a single purpose: drawing joyplots (a.k.a. ridgeline plots). The code f

Extensible, parallel implementations of t-SNE
openTSNE openTSNE is a modular Python implementation of t-Distributed Stochasitc Neighbor Embedding (t-SNE) [1], a popular dimensionality-reduction al

Visualizations for machine learning datasets
Introduction The facets project contains two visualizations for understanding and analyzing machine learning datasets: Facets Overview and Facets Dive

Python library that makes it easy for data scientists to create charts.
Chartify Chartify is a Python library that makes it easy for data scientists to create charts. Why use Chartify? Consistent input data format: Spend l

A Python toolbox for gaining geometric insights into high-dimensional data
"To deal with hyper-planes in a 14 dimensional space, visualize a 3D space and say 'fourteen' very loudly. Everyone does it." - Geoff Hinton Overview

3D plotting and mesh analysis through a streamlined interface for the Visualization Toolkit (VTK)
PyVista Deployment Build Status Metrics Citation License Community 3D plotting and mesh analysis through a streamlined interface for the Visualization
Streaming pivot visualization via WebAssembly
Perspective is an interactive visualization component for large, real-time datasets. Originally developed for J.P. Morgan's trading business, Perspect
Missing data visualization module for Python.
missingno Messy datasets? Missing values? missingno provides a small toolset of flexible and easy-to-use missing data visualizations and utilities tha
Main repository for Vispy
VisPy: interactive scientific visualization in Python Main website: http://vispy.org VisPy is a high-performance interactive 2D/3D data visualization
Fast data visualization and GUI tools for scientific / engineering applications
PyQtGraph A pure-Python graphics library for PyQt5/PyQt6/PySide2/PySide6 Copyright 2020 Luke Campagnola, University of North Carolina at Chapel Hill h

Uniform Manifold Approximation and Projection
UMAP Uniform Manifold Approximation and Projection (UMAP) is a dimension reduction technique that can be used for visualisation similarly to t-SNE, bu

Declarative statistical visualization library for Python
Altair http://altair-viz.github.io Altair is a declarative statistical visualization library for Python. With Altair, you can spend more time understa
Interactive Data Visualization in the browser, from Python
Bokeh is an interactive visualization library for modern web browsers. It provides elegant, concise construction of versatile graphics, and affords hi

Analytical Web Apps for Python, R, Julia, and Jupyter. No JavaScript Required.
Dash Dash is the most downloaded, trusted Python framework for building ML & data science web apps. Built on top of Plotly.js, React and Flask, Dash t
Statistical data visualization using matplotlib
seaborn: statistical data visualization Seaborn is a Python visualization library based on matplotlib. It provides a high-level interface for drawing

The interactive graphing library for Python (includes Plotly Express) :sparkles:
plotly.py Latest Release User forum PyPI Downloads License Data Science Workspaces Our recommended IDE for Plotly’s Python graphing library is Dash En
Visual profiler for Python
vprof vprof is a Python package providing rich and interactive visualizations for various Python program characteristics such as running time and memo

Web mining module for Python, with tools for scraping, natural language processing, machine learning, network analysis and visualization.
Pattern Pattern is a web mining module for Python. It has tools for: Data Mining: web services (Google, Twitter, Wikipedia), web crawler, HTML DOM par
🏆 A ranked list of awesome machine learning Python libraries. Updated weekly.
Best-of Machine Learning with Python 🏆 A ranked list of awesome machine learning Python libraries. Updated weekly. This curated list contains 840 awe

curl statistics made simple
httpstat httpstat visualizes curl(1) statistics in a way of beauty and clarity. It is a single file 🌟 Python script that has no dependency 👏 and is
🎨 Python3 binding for `@AntV/G2Plot` Plotting Library .
PyG2Plot 🎨 Python3 binding for @AntV/G2Plot which an interactive and responsive charting library. Based on the grammar of graphics, you can easily ma

Informer: Beyond Efficient Transformer for Long Sequence Time-Series Forecasting
Informer: Beyond Efficient Transformer for Long Sequence Time-Series Forecasting This is the origin Pytorch implementation of Informer in the followin

Python script to generate a visualization of various sorting algorithms, image or video.
sorting_algo_visualizer Python script to generate a visualization of various sorting algorithms, image or video.
Graphing communities on Twitch.tv in a visually intuitive way
VisualizingTwitchCommunities This project maps communities of streamers on Twitch.tv based on shared viewership. The data is collected from the Twitch

The fastest way to visualize GradCAM with your Keras models.
VizGradCAM VizGradCam is the fastest way to visualize GradCAM in Keras models. GradCAM helps with providing visual explainability of trained models an

Debugging, monitoring and visualization for Python Machine Learning and Data Science
Welcome to TensorWatch TensorWatch is a debugging and visualization tool designed for data science, deep learning and reinforcement learning from Micr

Analytical Web Apps for Python, R, Julia, and Jupyter. No JavaScript Required.
Dash Dash is the most downloaded, trusted Python framework for building ML & data science web apps. Built on top of Plotly.js, React and Flask, Dash t

:bowtie: Create a dashboard with python!
Installation | Documentation | Gitter Chat | Google Group Bowtie Introduction Bowtie is a library for writing dashboards in Python. No need to know we

An intuitive library to add plotting functionality to scikit-learn objects.
Welcome to Scikit-plot Single line functions for detailed visualizations The quickest and easiest way to go from analysis... ...to this. Scikit-plot i

Apache Superset is a Data Visualization and Data Exploration Platform
Superset A modern, enterprise-ready business intelligence web application. Why Superset? | Supported Databases | Installation and Configuration | Rele
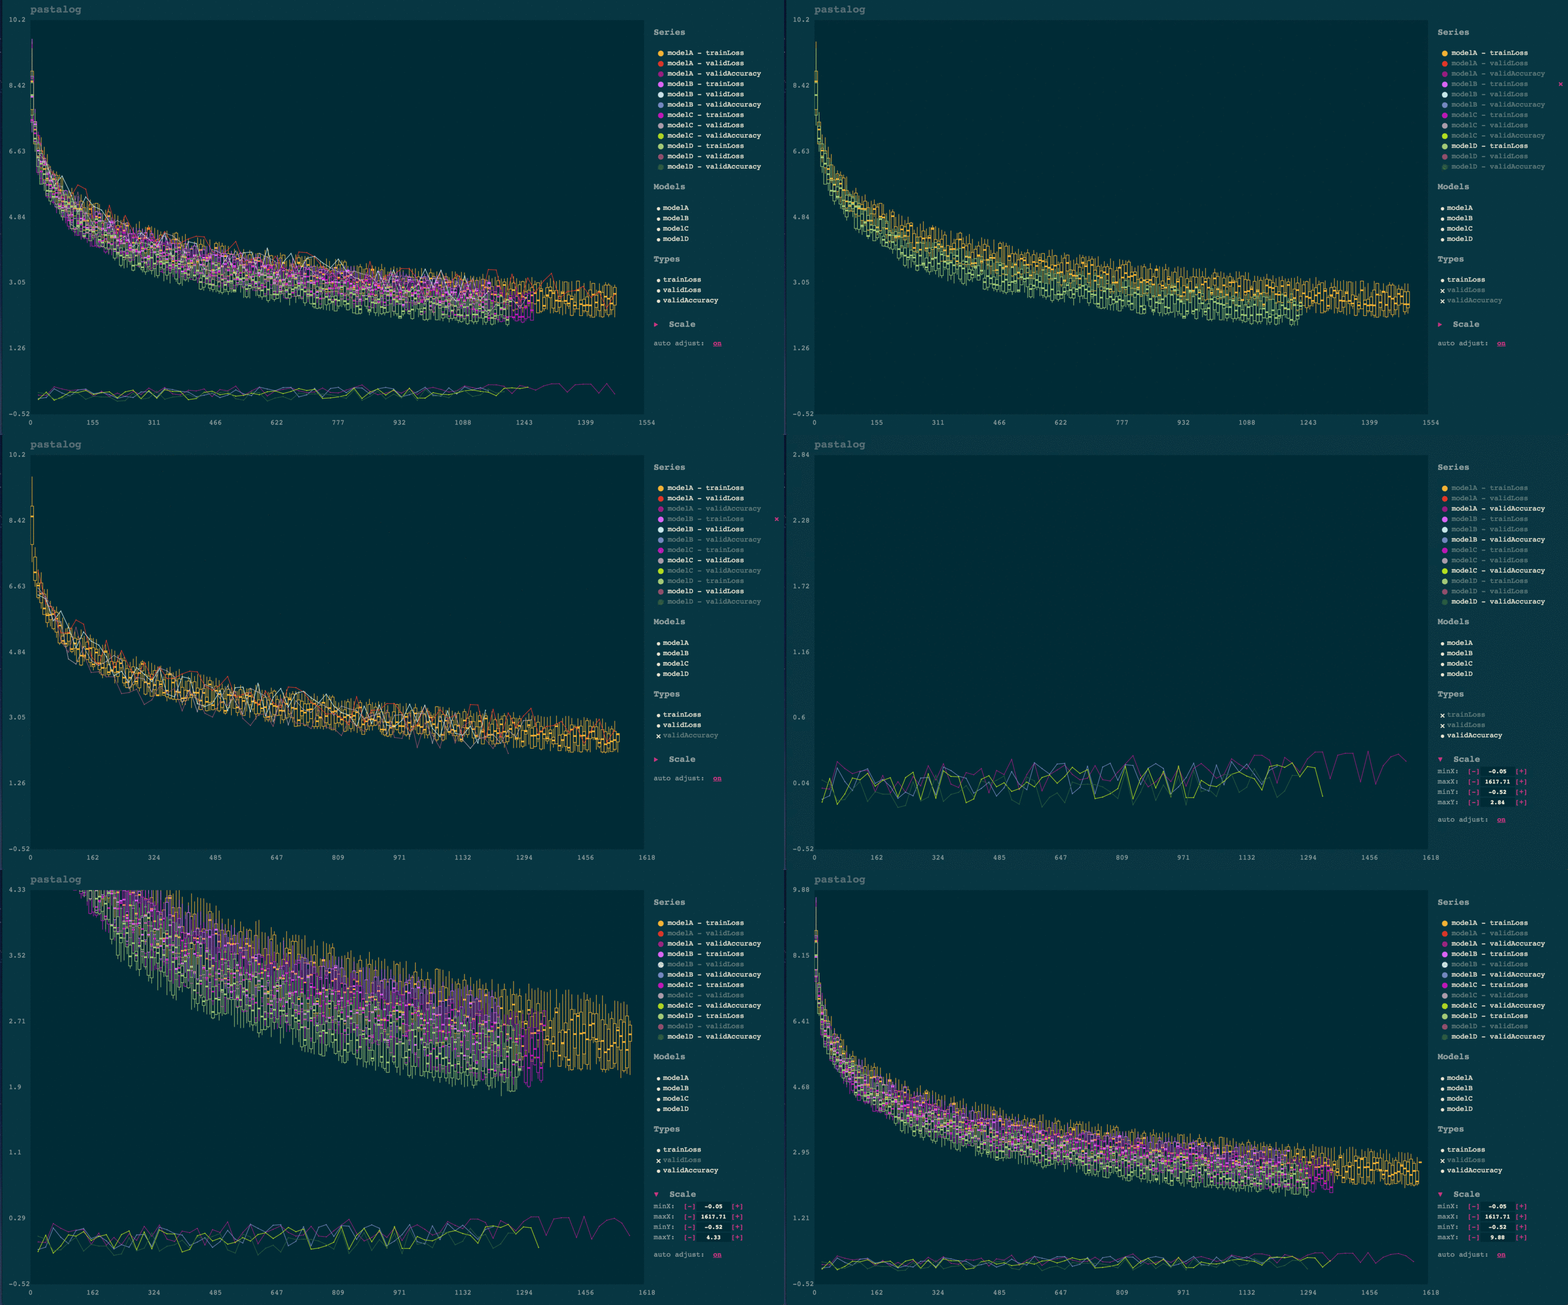
Simple, realtime visualization of neural network training performance.
pastalog Simple, realtime visualization server for training neural networks. Use with Lasagne, Keras, Tensorflow, Torch, Theano, and basically everyth
Fast data visualization and GUI tools for scientific / engineering applications
PyQtGraph A pure-Python graphics library for PyQt5/PyQt6/PySide2/PySide6 Copyright 2020 Luke Campagnola, University of North Carolina at Chapel Hill h

A Python package implementing a new model for text classification with visualization tools for Explainable AI :octocat:
A Python package implementing a new model for text classification with visualization tools for Explainable AI 🍣 Online live demos: http://tworld.io/s

Web mining module for Python, with tools for scraping, natural language processing, machine learning, network analysis and visualization.
Pattern Pattern is a web mining module for Python. It has tools for: Data Mining: web services (Google, Twitter, Wikipedia), web crawler, HTML DOM par

Create UIs for prototyping your machine learning model in 3 minutes
Note: We just launched Hosted, where anyone can upload their interface for permanent hosting. Check it out! Welcome to Gradio Quickly create customiza
A unified framework for machine learning with time series
Welcome to sktime A unified framework for machine learning with time series We provide specialized time series algorithms and scikit-learn compatible

Web mining module for Python, with tools for scraping, natural language processing, machine learning, network analysis and visualization.
Pattern Pattern is a web mining module for Python. It has tools for: Data Mining: web services (Google, Twitter, Wikipedia), web crawler, HTML DOM par
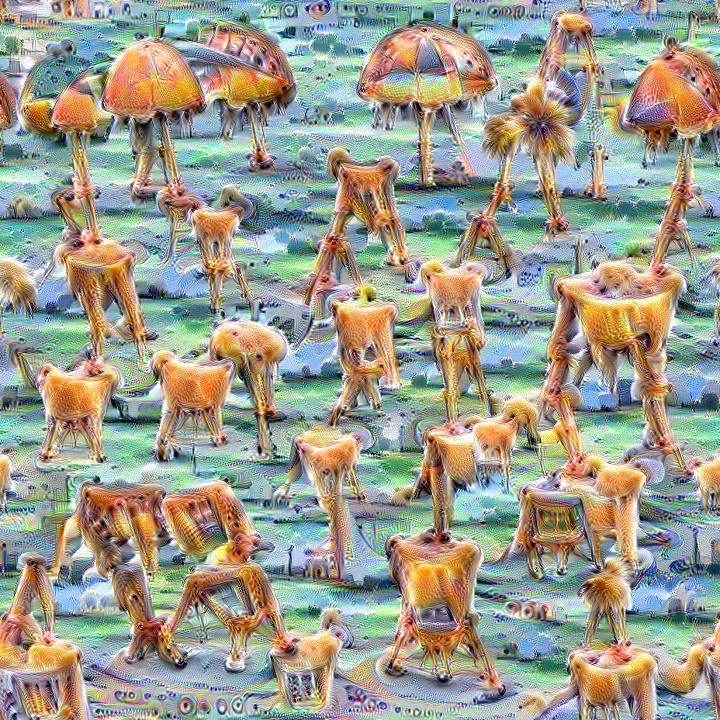
Quickly and easily create / train a custom DeepDream model
Dream-Creator This project aims to simplify the process of creating a custom DeepDream model by using pretrained GoogleNet models and custom image dat

PyTorch implementation of DeepDream algorithm
neural-dream This is a PyTorch implementation of DeepDream. The code is based on neural-style-pt. Here we DeepDream a photograph of the Golden Gate Br