710 Repositories
Python Visualization-of-the-Fourier-series Libraries

🌐 Local tile server for viewing geospatial raster files with ipyleaflet or folium
🌐 Local Tile Server for Geospatial Rasters Need to visualize a rather large (gigabytes) raster you have locally? This is for you. A Flask application

Eulera Dashboard is an easy and intuitive way to get a quick feel of what’s happening on the world’s market.
an easy and intuitive way to get a quick feel of what’s happening on the world’s market ! Eulera dashboard is a tool allows you to monitor historical
Learning Convolutional Neural Networks with Interactive Visualization.
CNN Explainer An interactive visualization system designed to help non-experts learn about Convolutional Neural Networks (CNNs) For more information,
JAX bindings to the Flatiron Institute Non-uniform Fast Fourier Transform (FINUFFT) library
JAX bindings to FINUFFT This package provides a JAX interface to (a subset of) the Flatiron Institute Non-uniform Fast Fourier Transform (FINUFFT) lib

Pandas DataFrames and Series as Interactive Tables in Jupyter
Pandas DataFrames and Series as Interactive Tables in Jupyter Star Turn pandas DataFrames and Series into interactive datatables in both your notebook

Automatically visualize your pandas dataframe via a single print! 📊 💡
A Python API for Intelligent Visual Discovery Lux is a Python library that facilitate fast and easy data exploration by automating the visualization a

The code for 'Deep Residual Fourier Transformation for Single Image Deblurring'
Deep Residual Fourier Transformation for Single Image Deblurring Xintian Mao, Yiming Liu, Wei Shen, Qingli Li and Yan Wang code will be released soon
A Python implementation of GRAIL, a generic framework to learn compact time series representations.
GRAIL A Python implementation of GRAIL, a generic framework to learn compact time series representations. Requirements Python 3.6+ numpy scipy tslearn

Delve is a Python package for analyzing the inference dynamics of your PyTorch model.
Delve is a Python package for analyzing the inference dynamics of your PyTorch model.
A Python package to preprocess time series
Disclaimer: This package is WIP. Do not take any APIs for granted. tspreprocess Time series can contain noise, may be sampled under a non fitting rate
Python implementation of "Elliptic Fourier Features of a Closed Contour"
PyEFD An Python/NumPy implementation of a method for approximating a contour with a Fourier series, as described in [1]. Installation pip install pyef

Python+Numpy+OpenGL: fast, scalable and beautiful scientific visualization
Python+Numpy+OpenGL: fast, scalable and beautiful scientific visualization

Tensorboard for pytorch (and chainer, mxnet, numpy, ...)
tensorboardX Write TensorBoard events with simple function call. The current release (v2.3) is tested on anaconda3, with PyTorch 1.8.1 / torchvision 0
Fast Fourier Transform-accelerated Interpolation-based t-SNE (FIt-SNE)
FFT-accelerated Interpolation-based t-SNE (FIt-SNE) Introduction t-Stochastic Neighborhood Embedding (t-SNE) is a highly successful method for dimensi
An interactive UMAP visualization of the MNIST data set.
Code for an interactive UMAP visualization of the MNIST data set. Demo at https://grantcuster.github.io/umap-explorer/. You can read more about the de
Live training loss plot in Jupyter Notebook for Keras, PyTorch and others
livelossplot Don't train deep learning models blindfolded! Be impatient and look at each epoch of your training! (RECENT CHANGES, EXAMPLES IN COLAB, A

3D rendered visualization of the austrian monuments registry
Visualization of the Austrian Monuments Visualization of the monument landscape of the austrian monuments registry (Bundesdenkmalamt Denkmalverzeichni
Create beautiful diagrams just by typing mathematical notation in plain text.
Penrose Penrose is an early-stage system that is still in development. Our system is not ready for contributions or public use yet, but hopefully will
A Bokeh project developed for learning and teaching Bokeh interactive plotting!
Bokeh-Python-Visualization A Bokeh project developed for learning and teaching Bokeh interactive plotting! See my medium blog posts about making bokeh

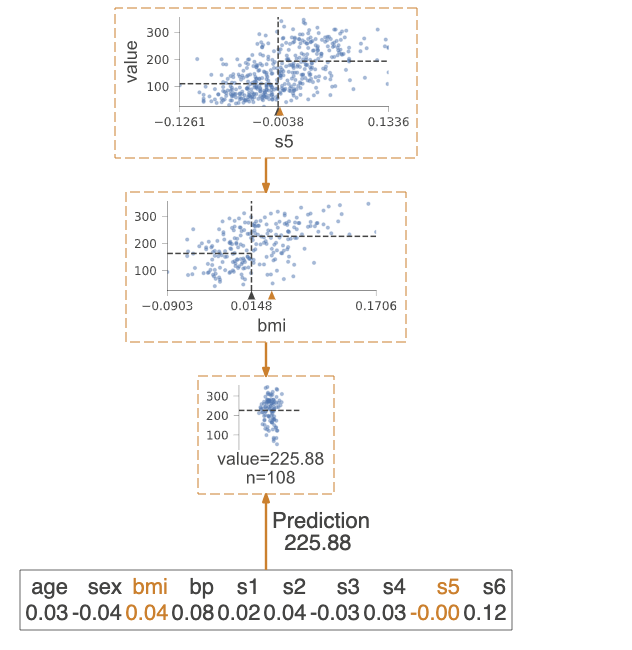
A python library for decision tree visualization and model interpretation.
dtreeviz : Decision Tree Visualization Description A python library for decision tree visualization and model interpretation. Currently supports sciki

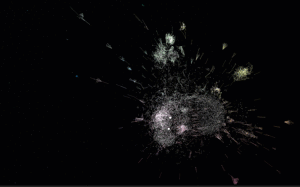
Package managers visualization
Software Galaxies This repository combines visualizations of major software package managers. All visualizations are available here: http://anvaka.git

Fast scatter density plots for Matplotlib
About Plotting millions of points can be slow. Real slow... 😴 So why not use density maps? ⚡ The mpl-scatter-density mini-package provides functional

Streamlit — The fastest way to build data apps in Python
Welcome to Streamlit 👋 The fastest way to build and share data apps. Streamlit lets you turn data scripts into sharable web apps in minutes, not week

PyCaret is an open-source, low-code machine learning library in Python that automates machine learning workflows.
An open-source, low-code machine learning library in Python 🚀 Version 2.3.5 out now! Check out the release notes here. Official • Docs • Install • Tu

Visualization ideas for data science
Nuance I use Nuance to curate varied visualization thoughts during my data scientist career. It is not yet a package but a list of small ideas. Welcom
Python library for interactive topic model visualization. Port of the R LDAvis package.
pyLDAvis Python library for interactive topic model visualization. This is a port of the fabulous R package by Carson Sievert and Kenny Shirley. pyLDA
ETNA – time series forecasting framework
ETNA Time Series Library Predict your time series the easiest way Homepage | Documentation | Tutorials | Contribution Guide | Release Notes ETNA is an

🌐 Local tile server for viewing geospatial raster files with ipyleaflet
🌐 Local Tile Server for Geospatial Rasters Need to visualize a rather large raster (gigabytes) you have locally? This is for you. A Flask application
UNAVOIDS: Unsupervised and Nonparametric Approach for Visualizing Outliers and Invariant Detection Scoring
UNAVOIDS: Unsupervised and Nonparametric Approach for Visualizing Outliers and Invariant Detection Scoring Code Summary aggregate.py: this script aggr

Neural network graphs and training metrics for PyTorch, Tensorflow, and Keras.
HiddenLayer A lightweight library for neural network graphs and training metrics for PyTorch, Tensorflow, and Keras. HiddenLayer is simple, easy to ex

Source code and notebooks to reproduce experiments and benchmarks on Bias Faces in the Wild (BFW).
Face Recognition: Too Bias, or Not Too Bias? Robinson, Joseph P., Gennady Livitz, Yann Henon, Can Qin, Yun Fu, and Samson Timoner. "Face recognition:

Biterm Topic Model (BTM): modeling topics in short texts
Biterm Topic Model Bitermplus implements Biterm topic model for short texts introduced by Xiaohui Yan, Jiafeng Guo, Yanyan Lan, and Xueqi Cheng. Actua

PyExplainer: A Local Rule-Based Model-Agnostic Technique (Explainable AI)
PyExplainer PyExplainer is a local rule-based model-agnostic technique for generating explanations (i.e., why a commit is predicted as defective) of J

An interactive dashboard for visualisation, integration and classification of data using Active Learning.
AstronomicAL An interactive dashboard for visualisation, integration and classification of data using Active Learning. AstronomicAL is a human-in-the-

Neurons Dataset API - The official dataloader and visualization tools for Neurons Datasets.
Neurons Dataset API - The official dataloader and visualization tools for Neurons Datasets. Introduction We propose our dataloader API for loading and
Cryptocurrency Centralized Exchange Visualization
This is a simple one that uses Grafina to visualize cryptocurrency from the Bitkub exchange. This service will make a request to the Bitkub API from your wallet and save the response to Postgresql. Grafina will retrieve data from Postgresql and display the graph.

Visualization of numerical optimization algorithms
Visualization of numerical optimization algorithms

A multi-platform GUI for bit-based analysis, processing, and visualization
A multi-platform GUI for bit-based analysis, processing, and visualization

Render tokei's output to interactive sunburst chart.
Render tokei's output to interactive sunburst chart.
Kats, a kit to analyze time series data, a lightweight, easy-to-use, generalizable, and extendable framework to perform time series analysis, from understanding the key statistics and characteristics, detecting change points and anomalies, to forecasting future trends.
Description Kats is a toolkit to analyze time series data, a lightweight, easy-to-use, and generalizable framework to perform time series analysis. Ti
A statistical library designed to fill the void in Python's time series analysis capabilities, including the equivalent of R's auto.arima function.
pmdarima Pmdarima (originally pyramid-arima, for the anagram of 'py' + 'arima') is a statistical library designed to fill the void in Python's time se
A statistical library designed to fill the void in Python's time series analysis capabilities, including the equivalent of R's auto.arima function.
pmdarima Pmdarima (originally pyramid-arima, for the anagram of 'py' + 'arima') is a statistical library designed to fill the void in Python's time se
Hierarchical Time Series Forecasting using Prophet
htsprophet Hierarchical Time Series Forecasting using Prophet Credit to Rob J. Hyndman and research partners as much of the code was developed with th

Time Series Prediction with tf.contrib.timeseries
TensorFlow-Time-Series-Examples Additional examples for TensorFlow Time Series(TFTS). Read a Time Series with TFTS From a Numpy Array: See "test_input

Sequence to Sequence (seq2seq) Recurrent Neural Network (RNN) for Time Series Forecasting
Sequence to Sequence (seq2seq) Recurrent Neural Network (RNN) for Time Series Forecasting Note: You can find here the accompanying seq2seq RNN forecas

Contains an implementation (sklearn API) of the algorithm proposed in "GENDIS: GEnetic DIscovery of Shapelets" and code to reproduce all experiments.
GENDIS GENetic DIscovery of Shapelets In the time series classification domain, shapelets are small subseries that are discriminative for a certain cl

Pebble is a stat's visualization tool, this will provide a skeleton to develop a monitoring tool.
Pebble is a stat's visualization tool, this will provide a skeleton to develop a monitoring tool.
PyAF is an Open Source Python library for Automatic Time Series Forecasting built on top of popular pydata modules.
PyAF (Python Automatic Forecasting) PyAF is an Open Source Python library for Automatic Forecasting built on top of popular data science python module

MASS (Mueen's Algorithm for Similarity Search) - a python 2 and 3 compatible library used for searching time series sub-sequences under z-normalized Euclidean distance for similarity.
Introduction MASS allows you to search a time series for a subquery resulting in an array of distances. These array of distances enable you to identif

Unofficial Implementation of RobustSTL: A Robust Seasonal-Trend Decomposition Algorithm for Long Time Series (AAAI 2019)
RobustSTL: A Robust Seasonal-Trend Decomposition Algorithm for Long Time Series (AAAI 2019) This repository contains python (3.5.2) implementation of

Short and long time series classification using convolutional neural networks
time-series-classification Short and long time series classification via convolutional neural networks In this project, we present a novel framework f
sktime companion package for deep learning based on TensorFlow
NOTE: sktime-dl is currently being updated to work correctly with sktime 0.6, and wwill be fully relaunched over the summer. The plan is Refactor and
ROCKET: Exceptionally fast and accurate time series classification using random convolutional kernels
ROCKET + MINIROCKET ROCKET: Exceptionally fast and accurate time series classification using random convolutional kernels. Data Mining and Knowledge D

Luminaire is a python package that provides ML driven solutions for monitoring time series data.
A hands-off Anomaly Detection Library Table of contents What is Luminaire Quick Start Time Series Outlier Detection Workflow Anomaly Detection for Hig
Time Series Cross-Validation -- an extension for scikit-learn
TSCV: Time Series Cross-Validation This repository is a scikit-learn extension for time series cross-validation. It introduces gaps between the traini

Portfolio analytics for quants, written in Python
QuantStats: Portfolio analytics for quants QuantStats Python library that performs portfolio profiling, allowing quants and portfolio managers to unde

Banpei is a Python package of the anomaly detection.
Banpei Banpei is a Python package of the anomaly detection. Anomaly detection is a technique used to identify unusual patterns that do not conform to
A framework for using LSTMs to detect anomalies in multivariate time series data. Includes spacecraft anomaly data and experiments from the Mars Science Laboratory and SMAP missions.
Telemanom (v2.0) v2.0 updates: Vectorized operations via numpy Object-oriented restructure, improved organization Merge branches into single branch fo

Python package for causal inference using Bayesian structural time-series models.
Python Causal Impact Causal inference using Bayesian structural time-series models. This package aims at defining a python equivalent of the R CausalI

Python package to visualize and cluster partial dependence.
partial_dependence A python library for plotting partial dependence patterns of machine learning classifiers. The technique is a black box approach to

moDel Agnostic Language for Exploration and eXplanation
moDel Agnostic Language for Exploration and eXplanation Overview Unverified black box model is the path to the failure. Opaqueness leads to distrust.

Scientific Visualization: Python + Matplotlib
An open access book on scientific visualization using python and matplotlib
Very simple encoding scheme that will encode data as a series of OwOs or UwUs.
OwO Encoder Very simple encoding scheme that will encode data as a series of OwOs or UwUs. The encoder is a simple state machine. Still needs a decode

Interactive convnet features visualization for Keras
Quiver Interactive convnet features visualization for Keras The quiver workflow Video Demo Build your model in keras model = Model(...) Launch the vis

VizTracer is a low-overhead logging/debugging/profiling tool that can trace and visualize your python code execution.
VizTracer is a low-overhead logging/debugging/profiling tool that can trace and visualize your python code execution.
A Python script to convert your favorite TV series into an Anki deck.
Ankiniser A Python3.8 script to convert your favorite TV series into an Anki deck. How to install? Download the script with git or download it manualy
A Simple LSTM-Based Solution for "Heartbeat Signal Classification and Prediction" in Tianchi
LSTM-Time-Series-Prediction A Simple LSTM-Based Solution for "Heartbeat Signal Classification and Prediction" in Tianchi Contest. The Link of the Cont

The Spectral Diagram (SD) is a new tool for the comparison of time series in the frequency domain
The Spectral Diagram (SD) is a new tool for the comparison of time series in the frequency domain. The SD provides a novel way to display the coherence function, power, amplitude, phase, and skill score of discrete frequencies of two time series. Each SD summarises these quantities in a single plot for multiple targeted frequencies.

Pytools is an open source library containing general machine learning and visualisation utilities for reuse
pytools is an open source library containing general machine learning and visualisation utilities for reuse, including: Basic tools for API developmen

Image Segmentation using U-Net, U-Net with skip connections and M-Net architectures
Brain-Image-Segmentation Segmentation of brain tissues in MRI image has a number of applications in diagnosis, surgical planning, and treatment of bra
Code for "Long Range Probabilistic Forecasting in Time-Series using High Order Statistics"
Long Range Probabilistic Forecasting in Time-Series using High Order Statistics This is the code produced as part of the paper Long Range Probabilisti

Daily social mapping project in November 2021. Maps made using PyGMT whenever possible.
Daily social mapping project in November 2021. Maps made using PyGMT whenever possible.
advance python series: Data Classes, OOPs, python
Working With Pydantic - Built-in Data Process ========================== Normal way to process data (reading json file): the normal princiople, it's f

Python Package for CanvasXpress JS Visualization Tools
CanvasXpress Python Library About CanvasXpress for Python CanvasXpress was developed as the core visualization component for bioinformatics and system

A simple project on Data Visualization for CSCI-40 course.
Simple-Data-Visualization A simple project on Data Visualization for CSCI-40 course - the instructions can be found here SAT results in New York in 20
Biblioteca Python que extrai dados de mercado do Bacen (Séries Temporais)
Pybacen This library was developed for economic analysis in the Brazilian scenario (Investments, micro and macroeconomic indicators) Installation Inst
ecoglib: visualization and statistics for high density microecog signals
ecoglib: visualization and statistics for high density microecog signals This library contains high-level analysis tools for "topos" and "chronos" asp

Exploratory analysis and data visualization of aircraft accidents and incidents in Brazil.
Exploring aircraft accidents in Brazil Occurrencies with aircraft in Brazil are investigated by the Center for Investigation and Prevention of Aircraf

A Python package to facilitate research on building and evaluating automated scoring models.
Rater Scoring Modeling Tool Introduction Automated scoring of written and spoken test responses is a growing field in educational natural language pro

cLoops2: full stack analysis tool for chromatin interactions
cLoops2: full stack analysis tool for chromatin interactions Introduction cLoops2 is an extension of our previous work, cLoops. From loop-calling base
LSTM Neural Networks for Spectroscopic Studies of Type Ia Supernovae
Package Description The difficulties in acquiring spectroscopic data have been a major challenge for supernova surveys. snlstm is developed to provide

edaSQL is a library to link SQL to Exploratory Data Analysis and further more in the Data Engineering.
edaSQL is a python library to bridge the SQL with Exploratory Data Analysis where you can connect to the Database and insert the queries. The query results can be passed to the EDA tool which can give greater insights to the user.

Convolutional neural network visualization techniques implemented in PyTorch.
This repository contains a number of convolutional neural network visualization techniques implemented in PyTorch.
A method to perform unsupervised cross-region adaptation of crop classifiers trained with satellite image time series.
TimeMatch Official source code of TimeMatch: Unsupervised Cross-region Adaptation by Temporal Shift Estimation by Joachim Nyborg, Charlotte Pelletier,

A collection of Scikit-Learn compatible time series transformers and tools.
tsfeast A collection of Scikit-Learn compatible time series transformers and tools. Installation Create a virtual environment and install: From PyPi p

A diff tool for language models
LMdiff Qualitative comparison of large language models. Demo & Paper: http://lmdiff.net LMdiff is a MIT-IBM Watson AI Lab collaboration between: Hendr

Companion repo of the UCC 2021 paper "Predictive Auto-scaling with OpenStack Monasca"
Predictive Auto-scaling with OpenStack Monasca Giacomo Lanciano*, Filippo Galli, Tommaso Cucinotta, Davide Bacciu, Andrea Passarella 2021 IEEE/ACM 14t

MPL Plotter is a Matplotlib based Python plotting library built with the goal of delivering publication-quality plots concisely.
MPL Plotter is a Matplotlib based Python plotting library built with the goal of delivering publication-quality plots concisely.

NitroFE is a Python feature engineering engine which provides a variety of modules designed to internally save past dependent values for providing continuous calculation.
NitroFE is a Python feature engineering engine which provides a variety of modules designed to internally save past dependent values for providing continuous calculation.

A python module for scientific analysis of 3D objects based on VTK and Numpy
A lightweight and powerful python module for scientific analysis and visualization of 3d objects.

Time Series Forecasting with Temporal Fusion Transformer in Pytorch
Forecasting with the Temporal Fusion Transformer Multi-horizon forecasting often contains a complex mix of inputs – including static (i.e. time-invari

Visualization Data Drug in thailand during 2014 to 2020
Visualization Data Drug in thailand during 2014 to 2020 Data sorce from ข้อมูลเปิดภาครัฐ สำนักงาน ป.ป.ส Inttroducing program Using tkinter module for

The Metabolomics Integrator (MINT) is a post-processing tool for liquid chromatography-mass spectrometry (LCMS) based metabolomics.
MINT (Metabolomics Integrator) The Metabolomics Integrator (MINT) is a post-processing tool for liquid chromatography-mass spectrometry (LCMS) based m

Data science, Data manipulation and Machine learning package.
duality Data science, Data manipulation and Machine learning package. Use permitted according to the terms of use and conditions set by the attached l

This is an auto-ML tool specialized in detecting of outliers
Auto-ML tool specialized in detecting of outliers Description This tool will allows you, with a Dash visualization, to compare 10 models of machine le

Decision Border Visualizer for Classification Algorithms
dbv Decision Border Visualizer for Classification Algorithms Project description A python package for Machine Learning Engineers who want to visualize
Python library for analysis of time series data including dimensionality reduction, clustering, and Markov model estimation
deeptime Releases: Installation via conda recommended. conda install -c conda-forge deeptime pip install deeptime Documentation: deeptime-ml.github.io

A command line tool for visualizing CSV/spreadsheet-like data
PerfPlotter Read data from CSV files using pandas and generate interactive plots using bokeh, which can then be embedded into HTML pages and served by
This repo provides a demo for the CVPR 2021 paper "A Fourier-based Framework for Domain Generalization" on the PACS dataset.
FACT This repo provides a demo for the CVPR 2021 paper "A Fourier-based Framework for Domain Generalization" on the PACS dataset. To cite, please use:
