62 Repositories
Python chia-plots Libraries

Seaborn is one of the go-to tools for statistical data visualization in python. It has been actively developed since 2012 and in July 2018, the author released version 0.9. This version of Seaborn has several new plotting features, API changes and documentation updates which combine to enhance an already great library. This article will walk through a few of the highlights and show how to use the new scatter and line plot functions for quickly creating very useful visualizations of data.
12_Python_Seaborn_Module Introduction 👋 From the website, “Seaborn is a Python data visualization library based on matplotlib. It provides a high-lev

A workshop on data visualization in Python with notebooks and exercises for following along.
Beyond the Basics: Data Visualization in Python The human brain excels at finding patterns in visual representations, which is why data visualizations

Shaded 😎 quantile plots
shadyquant 😎 This python package allows you to quantile and plot lines where you have multiple samples, typically for visualizing uncertainty. Your d

Challenge2022 - A backend of a Chia project donation platform
Overview This is a backend of a Chia project donation platform. People can publi

This component provides a wrapper to display SHAP plots in Streamlit.
streamlit-shap This component provides a wrapper to display SHAP plots in Streamlit.

Displaying plot of death rates from past years in Poland. Data source from these years is in readme
Average-Death-Rate Displaying plot of death rates from past years in Poland The goal collect the data from a CSV file count the ADR (Average Death Rat
Orbital-patterns - A program which plots pattern that revolving planets make
orbital-patterns Click to spawn planets Press "S" to capture screenshot. Image w

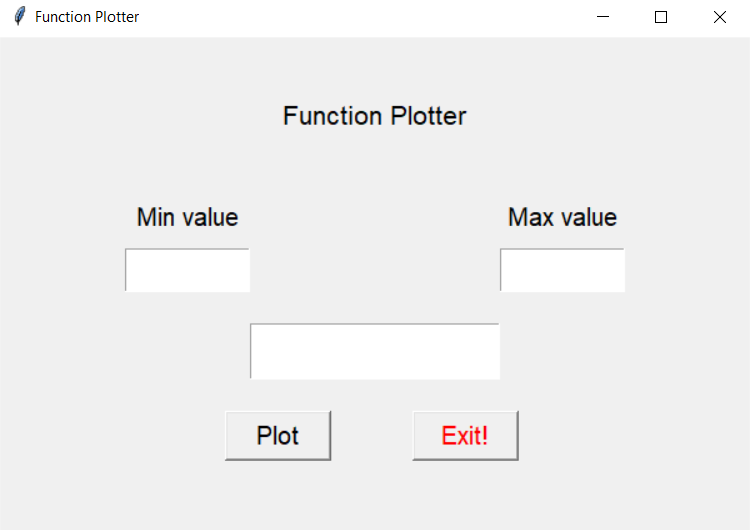
Function-Plotter - GUI Python program that plots functions that are entered by the user
FunctionPlotter GUI Python program that plots functions that are entered by the user. The program takes minimum and maximum value for x and plot it as
DeFi wallet on Chia Network.
DeFi wallet on Chia Network.

web application for flight log analysis & review
Flight Review This is a web application for flight log analysis. It allows users to upload ULog flight logs, and analyze them through the browser. It

The plottify package is makes matplotlib plots more legible
plottify The plottify package is makes matplotlib plots more legible. It's a thin wrapper around matplotlib that automatically adjusts font sizes, sca

YOPO is an interactive dashboard which generates various standard plots.
YOPO is an interactive dashboard which generates various standard plots.you can create various graphs and charts with a click of a button. This tool uses Dash and Flask in backend.
Highly decentralized and censorship-resistant way to store key data
Beacon coin Beacon coin is a Chia singelton coin that can store data that needs to be: always available censorship resistant versioned potentially imm

Standardized plots and visualizations in Python
Standardized plots and visualizations in Python pltviz is a Python package for standardized visualization. Routine and novel plotting approaches are f

A simple bot that lives in your Telegram group, logging messages to a Postgresql database and serving statistical tables and plots to users as Telegram messages.
telegram-stats-bot Telegram-stats-bot is a simple bot that lives in your Telegram group, logging messages to a Postgresql database and serving statist
A Python function that makes flower plots.
Flower plot A Python 3.9+ function that makes flower plots. Installation This package requires at least Python 3.9. pip install
Plots the graph of a function with ASCII characters.
ASCII Graph Plotter Plots the graph of a function with ASCII characters. See the change log here. Developed by InformaticFreak (c) 2021 How to use py
🌀❄️🌩️ This repository contains some examples for creating 2d and 3d weather plots using matplotlib and cartopy libraries in python3.
Weather-Plotting 🌀 ❄️ 🌩️ This repository contains some examples for creating 2d and 3d weather plots using matplotlib and cartopy libraries in pytho

Machine learning model evaluation made easy: plots, tables, HTML reports, experiment tracking and Jupyter notebook analysis.
sklearn-evaluation Machine learning model evaluation made easy: plots, tables, HTML reports, experiment tracking, and Jupyter notebook analysis. Suppo

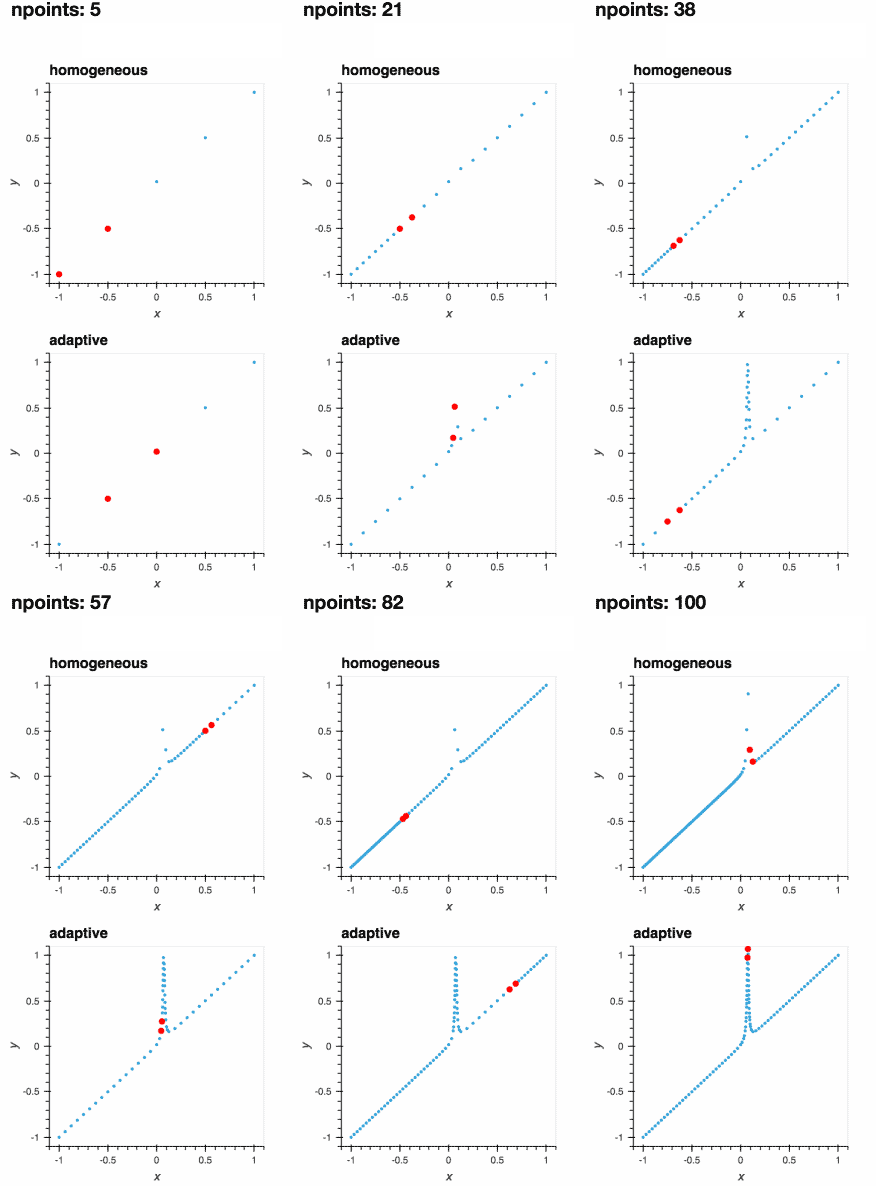
Adaptive: parallel active learning of mathematical functions
adaptive Adaptive: parallel active learning of mathematical functions. adaptive is an open-source Python library designed to make adaptive parallel fu

A Docker image for plotting and farming the Chia™ cryptocurrency on one computer or across many.
An easy-to-use WebUI for crypto plotting and farming. Offers Plotman, MadMax, Chiadog, Bladebit, Farmr, and Forktools in a Docker container. Supports Chia, Cactus, Chives, Flax, Flora, HDDCoin, Maize, N-Chain, Staicoin, and Stor among others.

It's an .exe file that can notify your chia profit and warning message every time automatically.
chia-Notify-with-Line 警示程式 It's an .exe file that can notify your chia profit and warning message every time automatically. 這是我自行設計的小程式,有轉成.exe檔了,可以在沒
Generate "Jupiter" plots for circular genomes
jupiter Generate "Jupiter" plots for circular genomes Description Python scripts to generate plots from ViennaRNA output. Written in "pidgin" python w

Fast scatter density plots for Matplotlib
About Plotting millions of points can be slow. Real slow... 😴 So why not use density maps? ⚡ The mpl-scatter-density mini-package provides functional

A streamlit component for bi-directional communication with bokeh plots.
Streamlit Bokeh Events A streamlit component for bi-directional communication with bokeh plots. Its just a workaround till streamlit team releases sup
SHIBgreen is a cryptocurrency forked from Chia and uses the Proof of Space and Time consensus algorithm
SHIBgreen is a cryptocurrency forked from Chia and uses the Proof of Space and Time consensus algorithm
ETHGreen blockchain is a fork from STAI and Chia blockchain including features implemented by Covid blockchain.
Welcome to ETHGreen Blockchain ETHGreen blockchain is a fork from STAI and Chia blockchain including features implemented by Covid blockchain. About t

cLoops2: full stack analysis tool for chromatin interactions
cLoops2: full stack analysis tool for chromatin interactions Introduction cLoops2 is an extension of our previous work, cLoops. From loop-calling base

MPL Plotter is a Matplotlib based Python plotting library built with the goal of delivering publication-quality plots concisely.
MPL Plotter is a Matplotlib based Python plotting library built with the goal of delivering publication-quality plots concisely.
This GitHub repository contains code used for plots in NeurIPS 2021 paper 'Stochastic Multi-Armed Bandits with Control Variates.'
About Repository This repository contains code used for plots in NeurIPS 2021 paper 'Stochastic Multi-Armed Bandits with Control Variates.' About Code

A minimal Python package that produces slice plots through h5m DAGMC geometry files
A minimal Python package that produces slice plots through h5m DAGMC geometry files Installation pip install dagmc_geometry_slice_plotter Python API U

This plugin plots the time you spent on a tag as a histogram.
This plugin plots the time you spent on a tag as a histogram.

Moscow DEG 2021 elections plots
Построение графиков на основе публичных данных о ДЭГ в Москве в 2021г. Описание Скрипты в данном репозитории позволяют собственноручно построить графи
This is a telegram bot hosted by a Raspberry Pi equipped with a temperature and humidity sensor. The bot is capable of sending plots and readings.
raspy-temperature-bot This is a telegram bot hosted by a Raspberry Pi equipped with a temperature and humidity sensor. The bot is capable of sending p

Ceres is a combine harvester designed to harvest plots for Chia blockchain and its forks using proof-of-space-and-time(PoST) consensus algorithm.
Ceres Combine-Harvester Ceres is a combine harvester designed to harvest plots for Chia blockchain and its forks using proof-of-space-and-time(PoST) c
This package creates clean and beautiful matplotlib plots that work on light and dark backgrounds
This package creates clean and beautiful matplotlib plots that work on light and dark backgrounds. Inspired by the work of Edward Tufte.

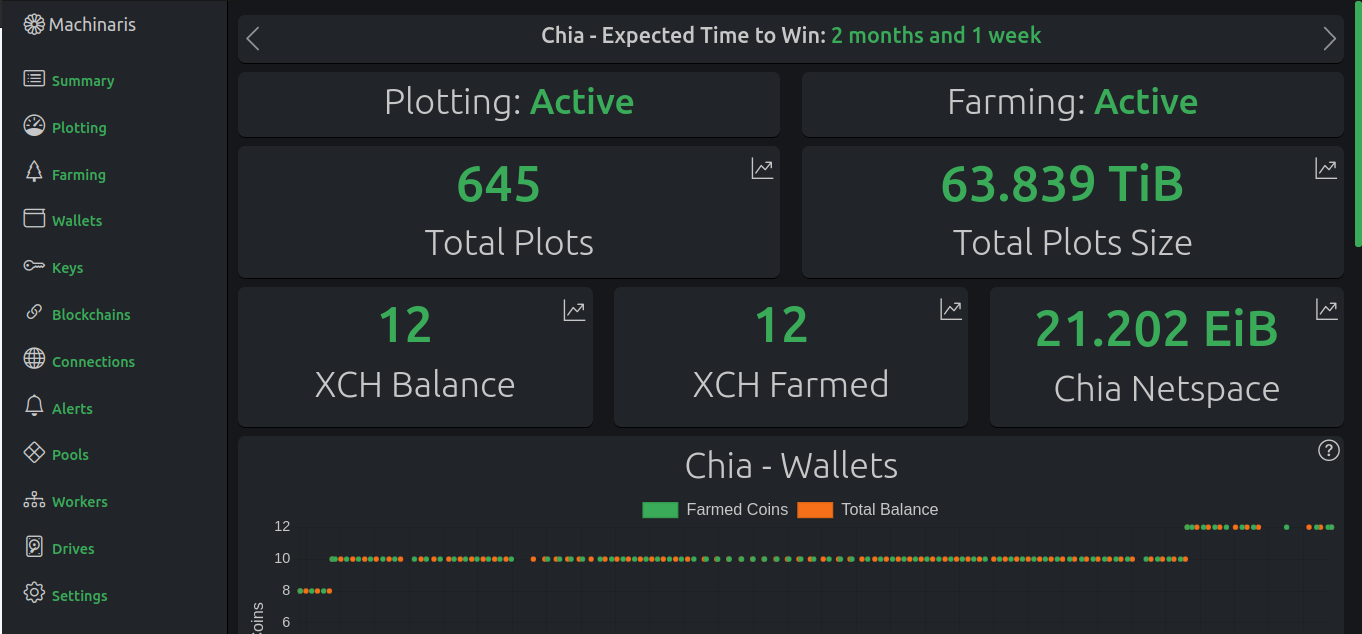
🍃 A comprehensive monitoring and alerting solution for the status of your Chia farmer and harvesters.
chia-monitor A monitoring tool to collect all important metrics from your Chia farming node and connected harvesters. It can send you push notificatio
Example scripts for generating plots of Bohemian matrices
Bohemian Eigenvalue Plotting Examples This repository contains examples of generating plots of Bohemian eigenvalues. The examples in this repository a
seno-blockchain is just a fork of Chia, designed to be efficient, decentralized, and secure
seno-blockchain https://seno.uno Seno is just a fork of Chia, designed to be efficient, decentralized, and secure. Here are some of the features and b

Reference python implementation of Chia pool operations for pool operators
This repository provides a sample server written in python, which is meant to server as a basis for a Chia Pool. While this is a fully functional implementation, it requires some work in scalability and security to run in production.

chiarose(XCR) based on chia(XCH) source code fork, open source public chain
chia-rosechain 一个无耻的小活动 | A shameless little event 如果您喜欢这个项目,请点击star 将赠送您520朵玫瑰,可以去 facebook 留下您的(xcr)地址,和github用户名。 If you like this project, please

Plot, scatter plots and histograms in the terminal using braille dots
Plot, scatter plots and histograms in the terminal using braille dots, with (almost) no dependancies. Plot with color or make complex figures - similar to a very small sibling to matplotlib. Or use the canvas to plot dots and lines yourself.

Prometheus exporter for several chia node statistics
prometheus-chia-exporter Prometheus exporter for several chia node statistics It's assumed that the full node, the harvester and the wallet run on the

Attempt at a Windows version of the plotman Chia Plot Manager system
windows plotman: an attempt to get plotman to work on windows THIS IS A BETA. Not ready for production use just yet. Almost, but not quite there yet.
This is a Cross-Platform Plot Manager for Chia Plotting that is simple, easy-to-use, and reliable.
Swar's Chia Plot Manager A plot manager for Chia plotting: https://www.chia.net/ Development Version: v0.0.1 This is a cross-platform Chia Plot Manage

Python scripts to manage Chia plots and drive space, providing full reports. Also monitors the number of chia coins you have.
Chia Plot, Drive Manager & Coin Monitor (V0.5 - April 20th, 2021) Multi Server Chia Plot and Drive Management Solution Be sure to ⭐ my repo so you can

Visualize classified time series data with interactive Sankey plots in Google Earth Engine
sankee Visualize changes in classified time series data with interactive Sankey plots in Google Earth Engine Contents Description Installation Using P

Easily convert matplotlib plots from Python into interactive Leaflet web maps.
mplleaflet mplleaflet is a Python library that converts a matplotlib plot into a webpage containing a pannable, zoomable Leaflet map. It can also embe

A watch dog providing a piece in mind that your Chia farm is running smoothly 24/7.
Photo by Zoltan Tukacs on Unsplash Watchdog for your Chia farm So you've become a Chia farmer and want to maximize the probability of getting a reward

Make sankey, alluvial and sankey bump plots in ggplot
The goal of ggsankey is to make beautiful sankey, alluvial and sankey bump plots in ggplot2

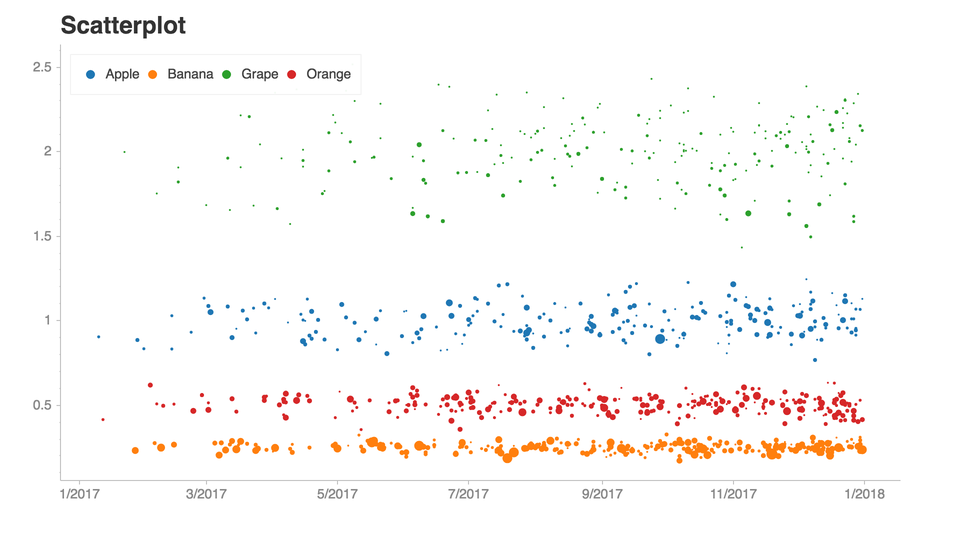
Python library that makes it easy for data scientists to create charts.
Chartify Chartify is a Python library that makes it easy for data scientists to create charts. Why use Chartify? Consistent input data format: Spend l
Painlessly create beautiful matplotlib plots.
Announcement Thank you to everyone who has used prettyplotlib and made it what it is today! Unfortunately, I no longer have the bandwidth to maintain
Plots is a graph plotting app for GNOME.
Plots is a graph plotting app for GNOME. Plots makes it easy to visualise mathematical formulae. In addition to basic arithmetic operations, it supports trigonometric, hyperbolic, exponential and logarithmic functions, as well as arbitrary sums and products.Plots is designed to integrate well with the GNOME desktop and takes advantage of modern hardware using OpenGL, and currently supports OpenGL 3.3+.

A python package for animating plots build on matplotlib.
animatplot A python package for making interactive as well as animated plots with matplotlib. Requires Python = 3.5 Matplotlib = 2.2 (because slider

:small_red_triangle: Ternary plotting library for python with matplotlib
python-ternary This is a plotting library for use with matplotlib to make ternary plots plots in the two dimensional simplex projected onto a two dime

Python library that makes it easy for data scientists to create charts.
Chartify Chartify is a Python library that makes it easy for data scientists to create charts. Why use Chartify? Consistent input data format: Spend l
Interactive Data Visualization in the browser, from Python
Bokeh is an interactive visualization library for modern web browsers. It provides elegant, concise construction of versatile graphics, and affords hi

A python package for animating plots build on matplotlib.
animatplot A python package for making interactive as well as animated plots with matplotlib. Requires Python = 3.5 Matplotlib = 2.2 (because slider

:small_red_triangle: Ternary plotting library for python with matplotlib
python-ternary This is a plotting library for use with matplotlib to make ternary plots plots in the two dimensional simplex projected onto a two dime

Python library that makes it easy for data scientists to create charts.
Chartify Chartify is a Python library that makes it easy for data scientists to create charts. Why use Chartify? Consistent input data format: Spend l
Interactive Data Visualization in the browser, from Python
Bokeh is an interactive visualization library for modern web browsers. It provides elegant, concise construction of versatile graphics, and affords hi
Interactive Data Visualization in the browser, from Python
Bokeh is an interactive visualization library for modern web browsers. It provides elegant, concise construction of versatile graphics, and affords hi