415 Repositories
Python 3d-genome-visualization Libraries

Python Package for CanvasXpress JS Visualization Tools
CanvasXpress Python Library About CanvasXpress for Python CanvasXpress was developed as the core visualization component for bioinformatics and system

A simple project on Data Visualization for CSCI-40 course.
Simple-Data-Visualization A simple project on Data Visualization for CSCI-40 course - the instructions can be found here SAT results in New York in 20
ecoglib: visualization and statistics for high density microecog signals
ecoglib: visualization and statistics for high density microecog signals This library contains high-level analysis tools for "topos" and "chronos" asp

Exploratory analysis and data visualization of aircraft accidents and incidents in Brazil.
Exploring aircraft accidents in Brazil Occurrencies with aircraft in Brazil are investigated by the Center for Investigation and Prevention of Aircraf

A Python package to facilitate research on building and evaluating automated scoring models.
Rater Scoring Modeling Tool Introduction Automated scoring of written and spoken test responses is a growing field in educational natural language pro

cLoops2: full stack analysis tool for chromatin interactions
cLoops2: full stack analysis tool for chromatin interactions Introduction cLoops2 is an extension of our previous work, cLoops. From loop-calling base

edaSQL is a library to link SQL to Exploratory Data Analysis and further more in the Data Engineering.
edaSQL is a python library to bridge the SQL with Exploratory Data Analysis where you can connect to the Database and insert the queries. The query results can be passed to the EDA tool which can give greater insights to the user.

Convolutional neural network visualization techniques implemented in PyTorch.
This repository contains a number of convolutional neural network visualization techniques implemented in PyTorch.

A diff tool for language models
LMdiff Qualitative comparison of large language models. Demo & Paper: http://lmdiff.net LMdiff is a MIT-IBM Watson AI Lab collaboration between: Hendr

MPL Plotter is a Matplotlib based Python plotting library built with the goal of delivering publication-quality plots concisely.
MPL Plotter is a Matplotlib based Python plotting library built with the goal of delivering publication-quality plots concisely.

A python module for scientific analysis of 3D objects based on VTK and Numpy
A lightweight and powerful python module for scientific analysis and visualization of 3d objects.

Visualization Data Drug in thailand during 2014 to 2020
Visualization Data Drug in thailand during 2014 to 2020 Data sorce from ข้อมูลเปิดภาครัฐ สำนักงาน ป.ป.ส Inttroducing program Using tkinter module for
CBMPy Metadraft: a flexible and extensible genome-scale model reconstruction tool
CBMPy Metadraft: a flexible and extensible, GUI-based genome-scale model reconstruction tool that supports multiple Systems Biology standards.

The Metabolomics Integrator (MINT) is a post-processing tool for liquid chromatography-mass spectrometry (LCMS) based metabolomics.
MINT (Metabolomics Integrator) The Metabolomics Integrator (MINT) is a post-processing tool for liquid chromatography-mass spectrometry (LCMS) based m

Data science, Data manipulation and Machine learning package.
duality Data science, Data manipulation and Machine learning package. Use permitted according to the terms of use and conditions set by the attached l

This is an auto-ML tool specialized in detecting of outliers
Auto-ML tool specialized in detecting of outliers Description This tool will allows you, with a Dash visualization, to compare 10 models of machine le

Decision Border Visualizer for Classification Algorithms
dbv Decision Border Visualizer for Classification Algorithms Project description A python package for Machine Learning Engineers who want to visualize

A command line tool for visualizing CSV/spreadsheet-like data
PerfPlotter Read data from CSV files using pandas and generate interactive plots using bokeh, which can then be embedded into HTML pages and served by
Data visualization electromagnetic spectrum
Datenvisualisierung-Elektromagnetischen-Spektrum Anhand des Moduls matplotlib sollen die Daten des elektromagnetischen Spektrums dargestellt werden. D
Identify and annotate mutations from genome editing assays.
CRISPR-detector Here we propose our CRISPR-detector to facilitate the CRISPR-edited amplicon and whole genome sequencing data analysis, with functions

Homework 2: Matplotlib and Data Visualization
Homework 2: Matplotlib and Data Visualization Overview These data visualizations were created for my introductory computer science course using Python

Can we visualize a large scientific data set with a surrogate model? We're building a GAN for the Earth's Mantle Convection data set to see if we can!
EarthGAN - Earth Mantle Surrogate Modeling Can a surrogate model of the Earth’s Mantle Convection data set be built such that it can be readily run in

Data visualization using matplotlib
Data visualization using matplotlib project instructions Top 5 Most Common Coffee Origins In this visualization I used data from Ankur Chavda on Kaggl

Rick and Morty Data Visualization with python
Rick and Morty Data Visualization For this project I looked at data for the TV show Rick and Morty Number of Episodes at a Certain Location Here is th

Create a visualization for Trump's Tweeted Words Using Python
Data Trump's Tweeted Words This plot illustrates twitter word occurences. We already did the coding I needed for this plot, so I was very inspired to

China and India Population and GDP Visualization
China and India Population and GDP Visualization Historical Population Comparison between India and China This graph shows the population data of Indi
Python IDE or notebook to generate a basic Kepler.gl data visualization
geospatial-data-analysis [readme] Use this code in your Python IDE or notebook to generate a basic Kepler.gl data visualization, without pre-configura
This is a web application to visualize various famous technical indicators and stocks tickers from user
Visualizing Technical Indicators Using Python and Plotly. Currently facing issues hosting the application on heroku. As soon as I am able to I'll like

LibreMind is a free meditation app made in under 24 hours. It has various meditation, breathwork, and visualization exercises.
libreMind Meditation exercises What is it? LibreMind is a free meditation app made in under 24 hours. It has various meditation, breathwork, and visua
3D detection and tracking viewer (visualization) for kitti & waymo dataset
3D detection and tracking viewer (visualization) for kitti & waymo dataset
This is a sorting visualizer made with Tkinter.
Sorting-Visualizer This is a sorting visualizer made with Tkinter. Make sure you've installed tkinter in your system to use this visualizer pip instal

JittorVis - Visual understanding of deep learning models
JittorVis: Visual understanding of deep learning model JittorVis is an open-source library for understanding the inner workings of Jittor models by vi

A multi-functional library for full-stack Deep Learning. Simplifies Model Building, API development, and Model Deployment.
chitra What is chitra? chitra (चित्र) is a multi-functional library for full-stack Deep Learning. It simplifies Model Building, API development, and M
A simple example of ML classification, cross validation, and visualization of feature importances
Simple-Classifier This is a basic example of how to use several different libraries for classification and ensembling, mostly with sklearn. Example as

QuakeLabeler is a Python package to create and manage your seismic training data, processes, and visualization in a single place — so you can focus on building the next big thing.
QuakeLabeler Quake Labeler was born from the need for seismologists and developers who are not AI specialists to easily, quickly, and independently bu

Retentioneering: product analytics, data-driven customer journey map optimization, marketing analytics, web analytics, transaction analytics, graph visualization, and behavioral segmentation with customer segments in Python.
What is Retentioneering? Retentioneering is a Python framework and library to assist product analysts and marketing analysts as it makes it easier to

Seaborn-image is a Python image visualization library based on matplotlib and provides a high-level API to draw attractive and informative images quickly and effectively.
seaborn-image: image data visualization Description Seaborn-image is a Python image visualization library based on matplotlib and provides a high-leve

Doosan robotic arm, simulation, control, visualization in Gazebo and ROS2 for Reinforcement Learning.
Robotic Arm Simulation in ROS2 and Gazebo General Overview This repository includes: First, how to simulate a 6DoF Robotic Arm from scratch using GAZE
missing-pixel-filler is a python package that, given images that may contain missing data regions (like satellite imagery with swath gaps), returns these images with the regions filled.
Missing Pixel Filler This is the official code repository for the Missing Pixel Filler by SpaceML. missing-pixel-filler is a python package that, give

A GUI visualization of QuickSort algorithm
QQuickSort A simple GUI visualization of QuickSort algorithm. It only uses PySide6, it does not have any other external dependency. How to run Install

PoseViz – Multi-person, multi-camera 3D human pose visualization tool built using Mayavi.
PoseViz – 3D Human Pose Visualizer Multi-person, multi-camera 3D human pose visualization tool built using Mayavi. As used in MeTRAbs visualizations.

Glue is a python project to link visualizations of scientific datasets across many files.
Glue Glue is a python project to link visualizations of scientific datasets across many files. Click on the image for a quick demo: Features Interacti

🌌 Economics Observatory Visualisation Repository
Economics Observatory Visualisation Repository Website | Visualisations | Data | Here you will find all the data visualisations and infographics attac

A gui application to visualize various sorting algorithms using pure python.
Sorting Algorithm Visualizer A gui application to visualize various sorting algorithms using pure python. Language : Python 3 Libraries required Tkint
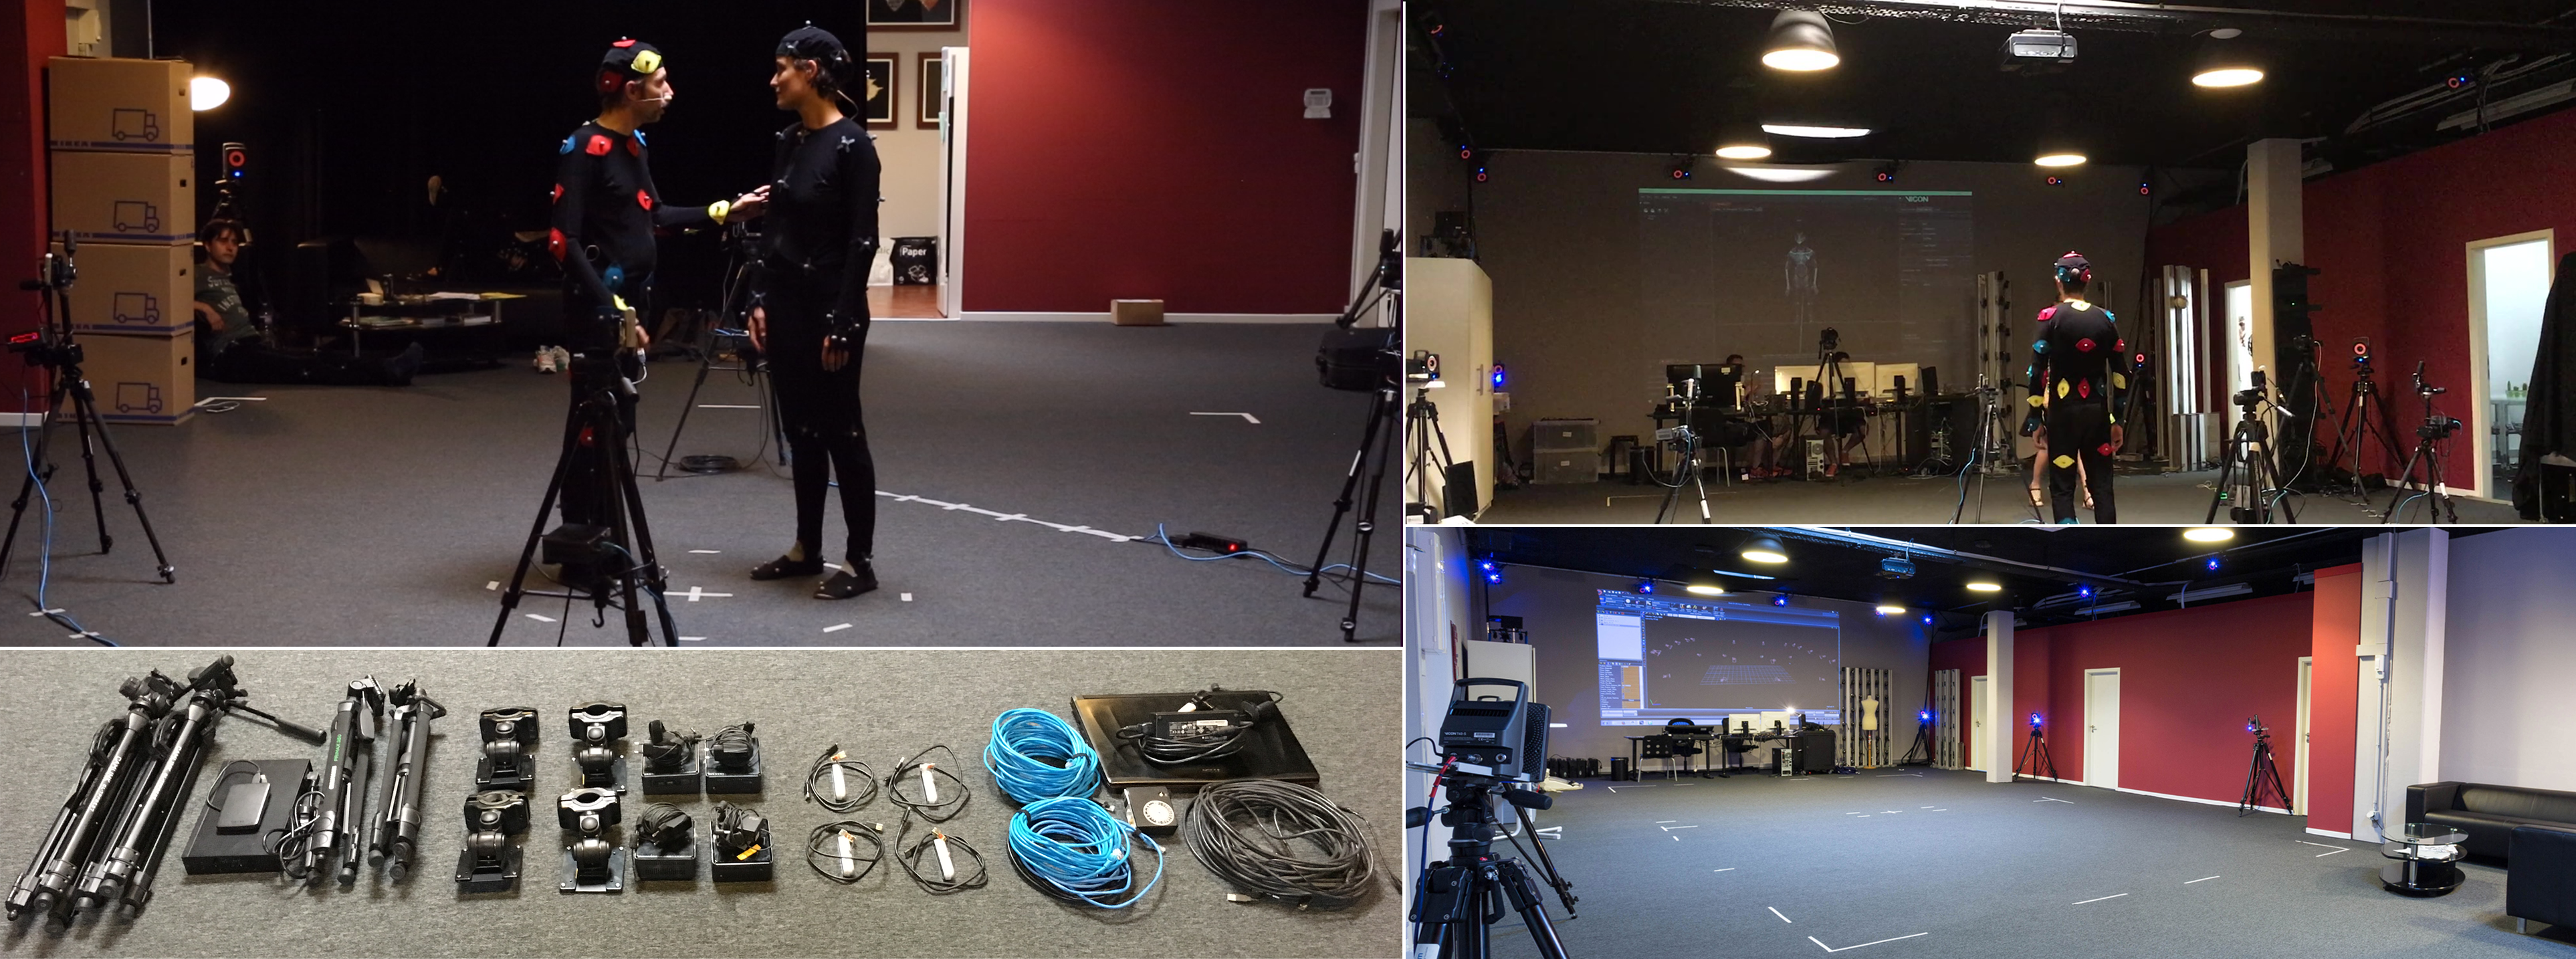
Human4D Dataset tools for processing and visualization
HUMAN4D: A Human-Centric Multimodal Dataset for Motions & Immersive Media HUMAN4D constitutes a large and multimodal 4D dataset that contains a variet
A data visualization curriculum of interactive notebooks.
A data visualization curriculum of interactive notebooks, using Vega-Lite and Altair. This repository contains a series of Python-based Jupyter notebooks.

A visualization tool made in Pygame for various pathfinding algorithms.
Pathfinding-Visualizer 🚀 A visualization tool made in Pygame for various pathfinding algorithms. Pathfinding is closely related to the shortest path

Using Selenium with Python to Web Scrap Popular Youtube Tech Channels.
Web Scrapping Popular Youtube Tech Channels with Selenium Data Mining, Data Wrangling, and Exploratory Data Analysis About the Data Web scrapi
HyperSpy is an open source Python library for the interactive analysis of multidimensional datasets
HyperSpy is an open source Python library for the interactive analysis of multidimensional datasets that can be described as multidimensional arrays o

Pytorch implementation for our ICCV 2021 paper "TRAR: Routing the Attention Spans in Transformers for Visual Question Answering".
TRAnsformer Routing Networks (TRAR) This is an official implementation for ICCV 2021 paper "TRAR: Routing the Attention Spans in Transformers for Visu
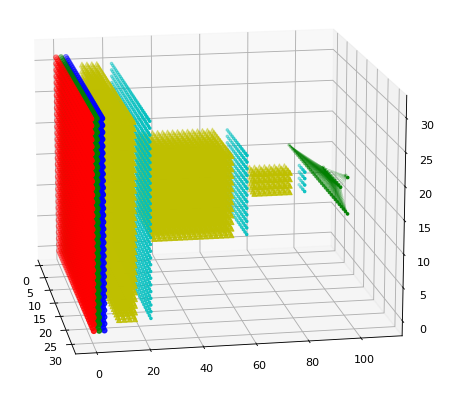
A ultra-lightweight 3D renderer of the Tensorflow/Keras neural network architectures
A ultra-lightweight 3D renderer of the Tensorflow/Keras neural network architectures

Reporting and Visualization for Hazardous Events
Reporting and Visualization for Hazardous Events
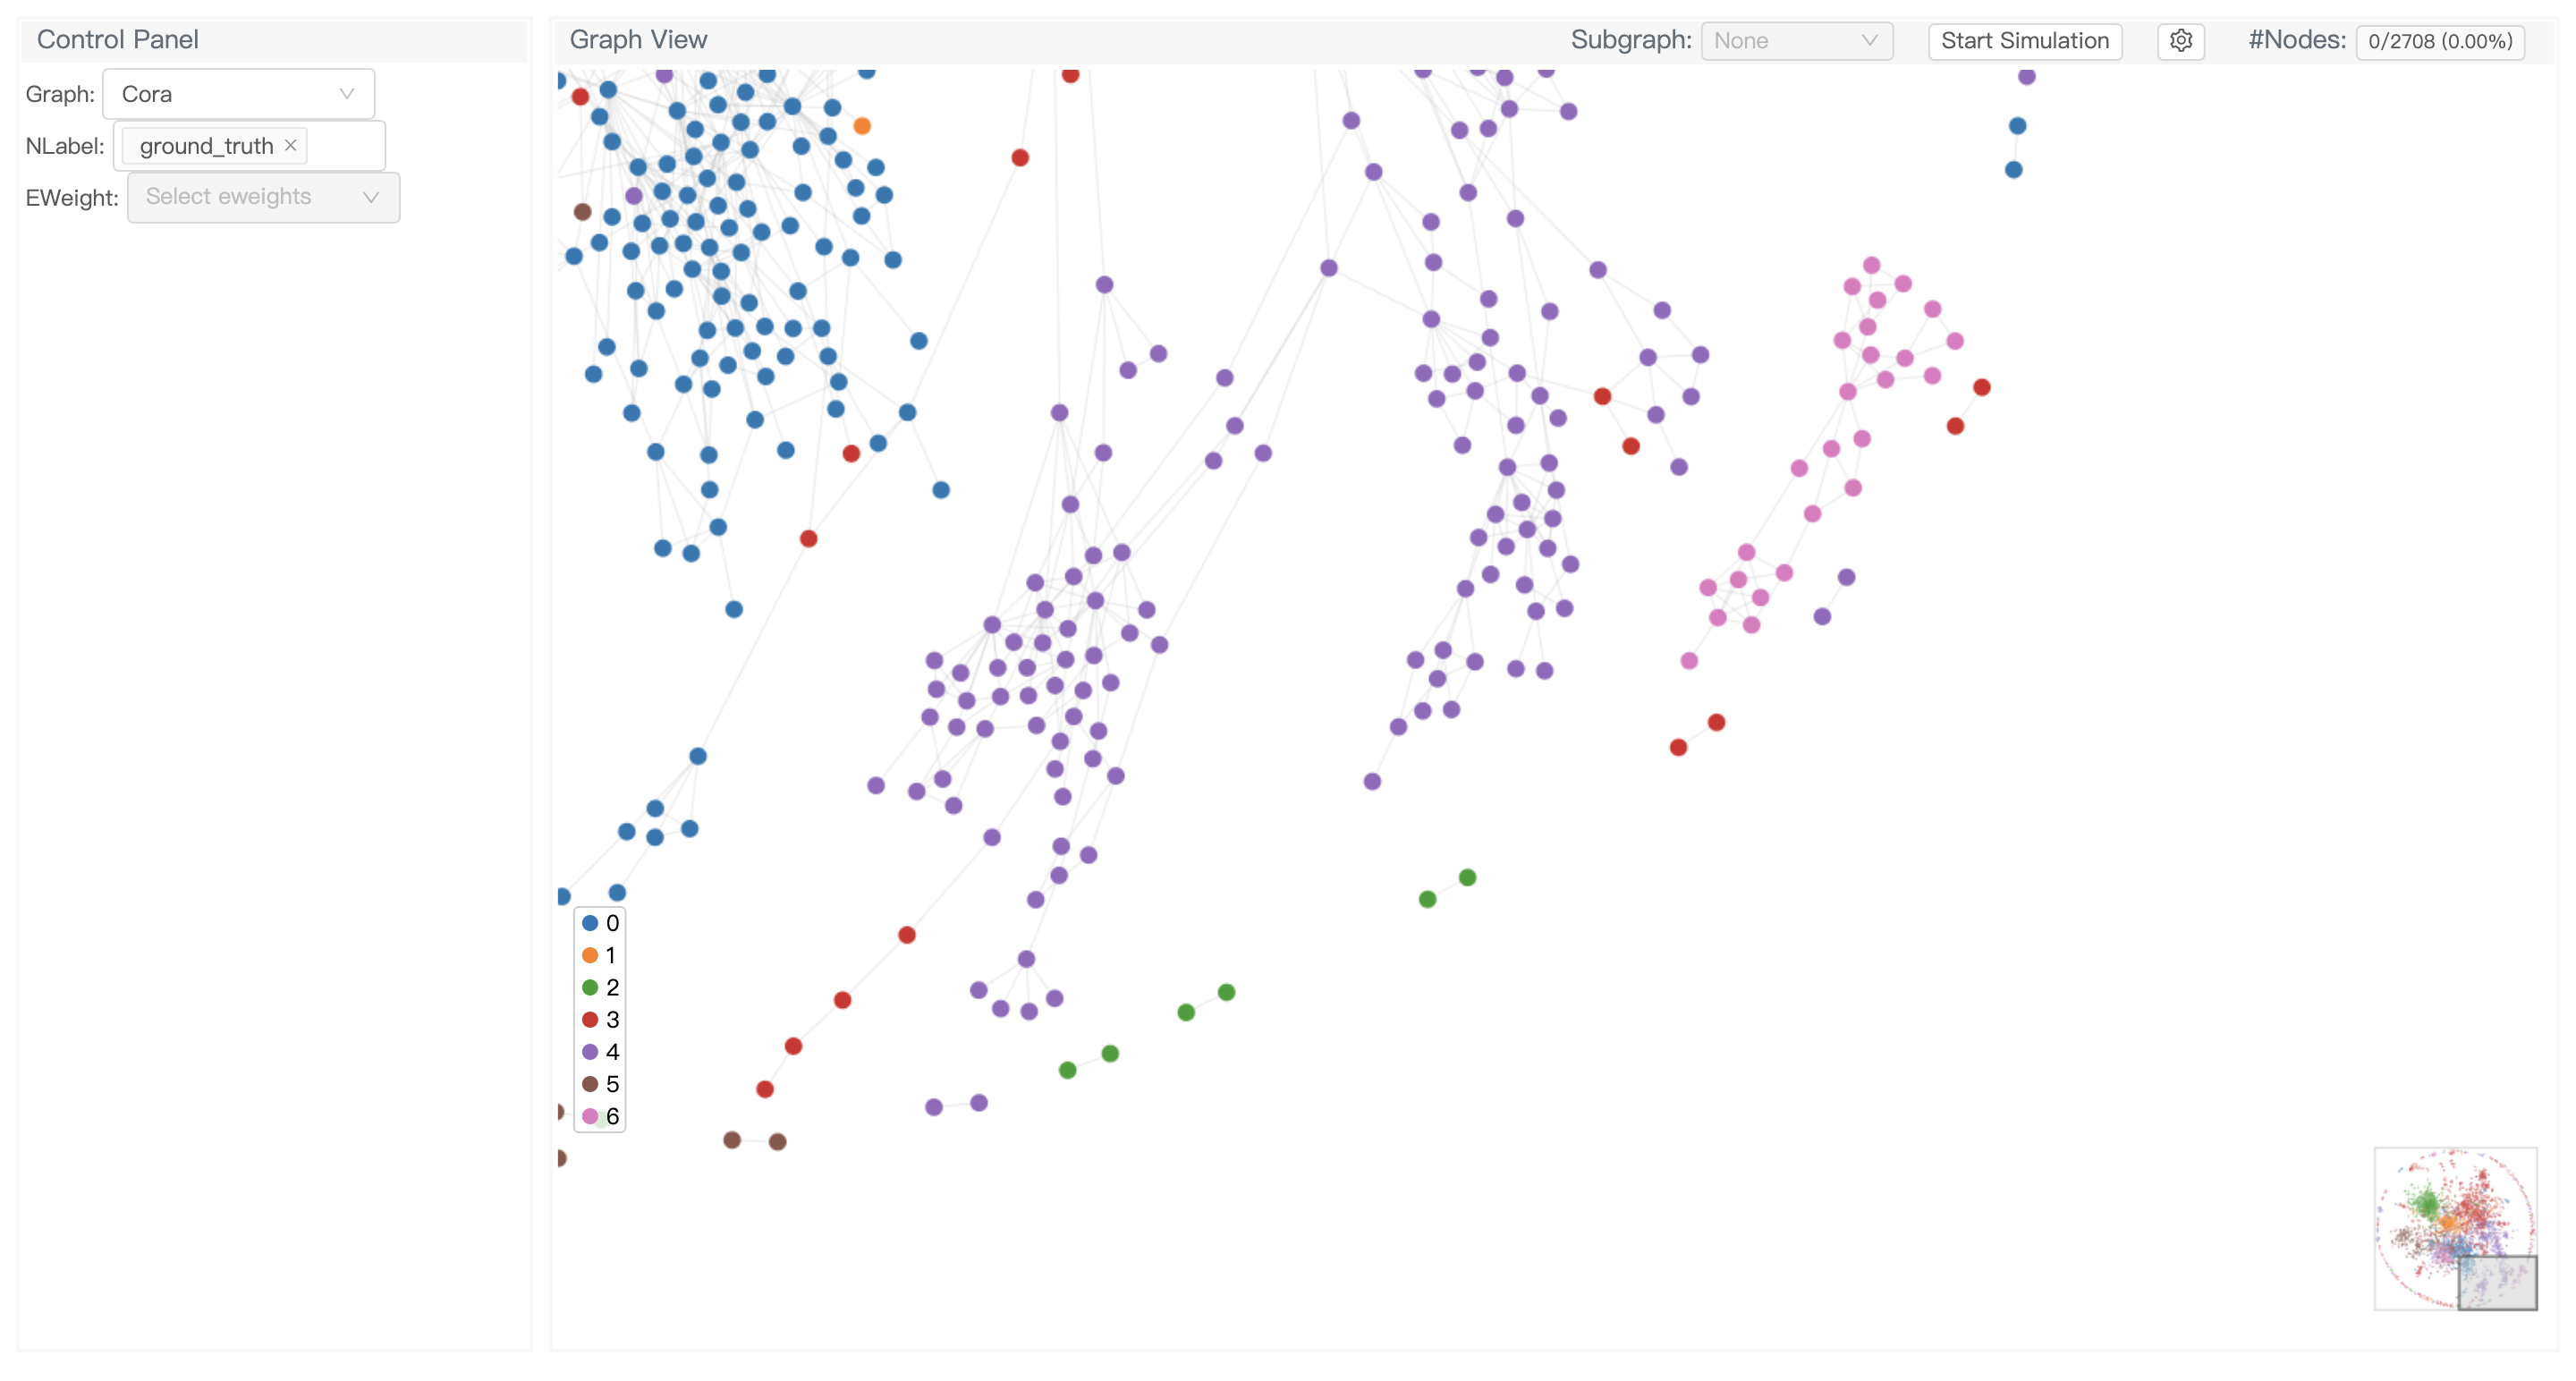
GNNLens2 is an interactive visualization tool for graph neural networks (GNN).
GNNLens2 is an interactive visualization tool for graph neural networks (GNN).

Interactive Terraform visualization. State and configuration explorer.
Rover - Terraform Visualizer Rover is a Terraform visualizer. In order to do this, Rover: generates a plan file and parses the configuration in the ro
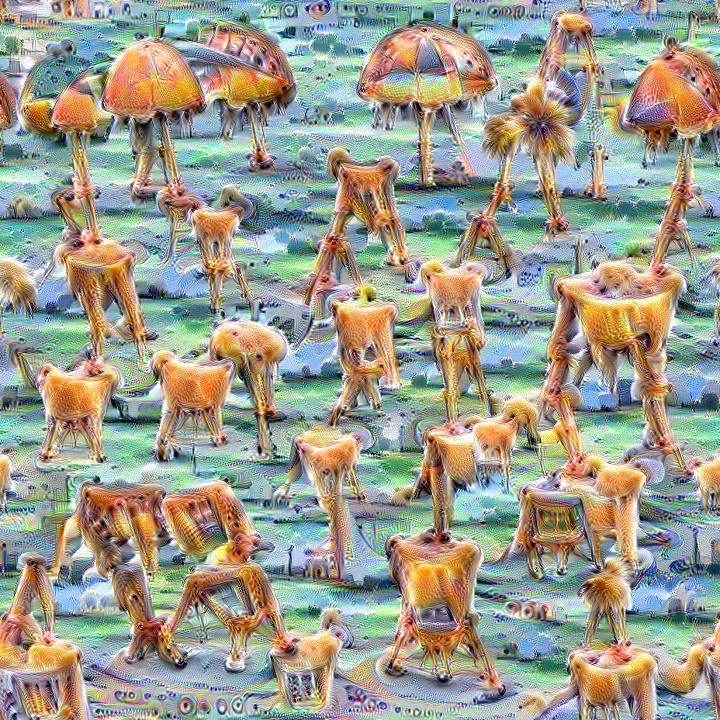
Quickly and easily create / train a custom DeepDream model
Dream-Creator This project aims to simplify the process of creating a custom DeepDream model by using pretrained GoogleNet models and custom image dat

Visualization toolkit for neural networks in PyTorch! Demo --
FlashTorch A Python visualization toolkit, built with PyTorch, for neural networks in PyTorch. Neural networks are often described as "black box". The

PyTorch implementation of DeepDream algorithm
neural-dream This is a PyTorch implementation of DeepDream. The code is based on neural-style-pt. Here we DeepDream a photograph of the Golden Gate Br

Pytorch implementation of convolutional neural network visualization techniques
Convolutional Neural Network Visualizations This repository contains a number of convolutional neural network visualization techniques implemented in

A python toolbox for predictive uncertainty quantification, calibration, metrics, and visualization
Website, Tutorials, and Docs Uncertainty Toolbox A python toolbox for predictive uncertainty quantification, calibration, metrics, and visualizatio
Simple spectra visualization tool for astronomers
SpecViewer A simple visualization tool for astronomers. Dependencies Python = 3.7.4 PyQt5 = 5.15.4 pyqtgraph == 0.10.0 numpy = 1.19.4 How to use py

A Structured Self-attentive Sentence Embedding
Structured Self-attentive sentence embeddings Implementation for the paper A Structured Self-Attentive Sentence Embedding, which was published in ICLR

PyTorch implementation of Value Iteration Networks (VIN): Clean, Simple and Modular. Visualization in Visdom.
VIN: Value Iteration Networks This is an implementation of Value Iteration Networks (VIN) in PyTorch to reproduce the results.(TensorFlow version) Key
NeRF visualization library under construction
NeRF visualization library using PlenOctrees, under construction pip install nerfvis Docs will be at: https://nerfvis.readthedocs.org import nerfvis s
Point cloud processing tool library.
Point Cloud ToolBox This point cloud processing tool library can be used to process point clouds, 3d meshes, and voxels. Environment python 3.7.5 Dep
An open-source Python project series where beginners can contribute and practice coding.
Python Mini Projects A collection of easy Python small projects to help you improve your programming skills. Table Of Contents Aim Of The Project Cont

决策树分类与回归模型的实现和可视化
DecisionTree 决策树分类与回归模型,以及可视化 DecisionTree ID3 C4.5 CART 分类 回归 决策树绘制 分类树 回归树 调参 剪枝 ID3 ID3决策树是最朴素的决策树分类器: 无剪枝 只支持离散属性 采用信息增益准则 在data.py中,我们记录了一个小的西瓜数据

A visualization of people a user follows on Twitter
Twitter-Map This software allows the user to create maps of Twitter accounts. Installation git clone [email protected]:OGreenwood672/Twitter-Map.git cd T

A scalable implementation of WobblyStitcher for 3D microscopy images
WobblyStitcher Introduction A scalable implementation of WobblyStitcher Dependencies $ python -m pip install numpy scikit-image Visualization ImageJ

PyTorch implementation of Interpretable Explanations of Black Boxes by Meaningful Perturbation
PyTorch implementation of Interpretable Explanations of Black Boxes by Meaningful Perturbation The paper: https://arxiv.org/abs/1704.03296 What makes

Evidence enables analysts to deliver a polished business intelligence system using SQL and markdown.
Evidence enables analysts to deliver a polished business intelligence system using SQL and markdown

Data Preparation, Processing, and Visualization for MoVi Data
MoVi-Toolbox Data Preparation, Processing, and Visualization for MoVi Data, https://www.biomotionlab.ca/movi/ MoVi is a large multipurpose dataset of

Neural network visualization toolkit for tf.keras
Neural network visualization toolkit for tf.keras

A Structured Self-attentive Sentence Embedding
Structured Self-attentive sentence embeddings Implementation for the paper A Structured Self-Attentive Sentence Embedding, which was published in ICLR

Attractors is a package for simulation and visualization of strange attractors.
attractors Attractors is a package for simulation and visualization of strange attractors. Installation The simplest way to install the module is via

PyTorch implementation of "Transparency by Design: Closing the Gap Between Performance and Interpretability in Visual Reasoning"
Transparency-by-Design networks (TbD-nets) This repository contains code for replicating the experiments and visualizations from the paper Transparenc

This is the pytorch implementation of the paper - Axiomatic Attribution for Deep Networks.
Integrated Gradients This is the pytorch implementation of "Axiomatic Attribution for Deep Networks". The original tensorflow version could be found h
DRIFT is a tool for Diachronic Analysis of Scientific Literature.
About DRIFT is a tool for Diachronic Analysis of Scientific Literature. The application offers user-friendly and customizable utilities for two modes:
A Python library for reading, writing and visualizing the OMEGA Format
A Python library for reading, writing and visualizing the OMEGA Format, targeted towards storing reference and perception data in the automotive context on an object list basis with a focus on an urban use case.

Squidpy is a tool for the analysis and visualization of spatial molecular data.
Squidpy is a tool for the analysis and visualization of spatial molecular data. It builds on top of scanpy and anndata, from which it inherits modularity and scalability. It provides analysis tools that leverages the spatial coordinates of the data, as well as tissue images if available.

🛠 All-in-one web-based IDE specialized for machine learning and data science.
All-in-one web-based development environment for machine learning Getting Started • Features & Screenshots • Support • Report a Bug • FAQ • Known Issu

Code for "Learning Canonical Representations for Scene Graph to Image Generation", Herzig & Bar et al., ECCV2020
Learning Canonical Representations for Scene Graph to Image Generation (ECCV 2020) Roei Herzig*, Amir Bar*, Huijuan Xu, Gal Chechik, Trevor Darrell, A

Streamlit component for TensorBoard, TensorFlow's visualization toolkit
streamlit-tensorboard This is a work-in-progress, providing a function to embed TensorBoard, TensorFlow's visualization toolkit, in Streamlit apps. In
Temporal network visualization
Temporal network visualization This code is what I used to make the visualizations of SocioPatterns' primary school data here It requires the data of

JittorVis is a deep neural network computational graph visualization library based on Jittor.
JittorVis - Visual understanding of deep learning model.

Leaderboard and Visualization for RLCard
RLCard Showdown This is the GUI support for the RLCard project and DouZero project. RLCard-Showdown provides evaluation and visualization tools to hel

Hierarchical Uniform Manifold Approximation and Projection
HUMAP Hierarchical Manifold Approximation and Projection (HUMAP) is a technique based on UMAP for hierarchical non-linear dimensionality reduction. HU
minimizer-space de Bruijn graphs (mdBG) for whole genome assembly
rust-mdbg: Minimizer-space de Bruijn graphs (mdBG) for whole-genome assembly rust-mdbg is an ultra-fast minimizer-space de Bruijn graph (mdBG) impleme

Statistics and Visualization of acceptance rate, main keyword of CVPR 2021 accepted papers for the main Computer Vision conference (CVPR)
Statistics and Visualization of acceptance rate, main keyword of CVPR 2021 accepted papers for the main Computer Vision conference (CVPR)

LinkedIn connections analyzer
LinkedIn Connections Analyzer 🔗 https://linkedin-analzyer.herokuapp.com Hey hey 👋 , welcome to my LinkedIn connections analyzer. I recently found ou

Streamlit component for Let's-Plot visualization library
streamlit-letsplot This is a work-in-progress, providing a convenience function to plot charts from the Lets-Plot visualization library. Example usage

Learn Blockchains by Building One, A simple Blockchain in Python using Flask as a micro web framework.
Blockchain ✨ Learn Blockchains by Building One Yourself Installation Make sure Python 3.6+ is installed. Install Flask Web Framework. Clone this repos
Code for CVPR2021 "Visualizing Adapted Knowledge in Domain Transfer". Visualization for domain adaptation. #explainable-ai
Visualizing Adapted Knowledge in Domain Transfer @inproceedings{hou2021visualizing, title={Visualizing Adapted Knowledge in Domain Transfer}, auth

Plot, scatter plots and histograms in the terminal using braille dots
Plot, scatter plots and histograms in the terminal using braille dots, with (almost) no dependancies. Plot with color or make complex figures - similar to a very small sibling to matplotlib. Or use the canvas to plot dots and lines yourself.

notebookJS: seamless JavaScript integration in Python Notebooks
notebookJS enables the execution of custom JavaScript code in Python Notebooks (Jupyter Notebook and Google Colab). This Python library can be useful for implementing and reusing interactive Data Visualizations in the Notebook environment.

A Python package that provides evaluation and visualization tools for the DexYCB dataset
DexYCB Toolkit DexYCB Toolkit is a Python package that provides evaluation and visualization tools for the DexYCB dataset. The dataset and results wer
Sequence-to-sequence framework with a focus on Neural Machine Translation based on Apache MXNet
Sequence-to-sequence framework with a focus on Neural Machine Translation based on Apache MXNet

SummVis is an interactive visualization tool for text summarization.
SummVis is an interactive visualization tool for analyzing abstractive summarization model outputs and datasets.

Visualization Toolbox for Long Short Term Memory networks (LSTMs)
Visualization Toolbox for Long Short Term Memory networks (LSTMs)

Visualize classified time series data with interactive Sankey plots in Google Earth Engine
sankee Visualize changes in classified time series data with interactive Sankey plots in Google Earth Engine Contents Description Installation Using P
