78 Repositories
Python geographic-visualizations Libraries

Seaborn is one of the go-to tools for statistical data visualization in python. It has been actively developed since 2012 and in July 2018, the author released version 0.9. This version of Seaborn has several new plotting features, API changes and documentation updates which combine to enhance an already great library. This article will walk through a few of the highlights and show how to use the new scatter and line plot functions for quickly creating very useful visualizations of data.
12_Python_Seaborn_Module Introduction 👋 From the website, “Seaborn is a Python data visualization library based on matplotlib. It provides a high-lev

Data Visualizations for the #30DayChartChallenge
The #30DayChartChallenge This repository contains all the charts made for the #30DayChartChallenge during the month of April. This project aims to exp

Easily pull telemetry data and create beautiful visualizations for analysis.
This repository is a work in progress. Anything and everything is subject to change. Porpo Table of Contents Porpo Table of Contents General Informati

ManimML is a project focused on providing animations and visualizations of common machine learning concepts with the Manim Community Library.
ManimML ManimML is a project focused on providing animations and visualizations of common machine learning concepts with the Manim Community Library.

A workshop on data visualization in Python with notebooks and exercises for following along.
Beyond the Basics: Data Visualization in Python The human brain excels at finding patterns in visual representations, which is why data visualizations

Create matplotlib visualizations from the command-line
MatplotCLI Create matplotlib visualizations from the command-line MatplotCLI is a simple utility to quickly create plots from the command-line, levera

The LaTeX and Python code for generating the paper, experiments' results and visualizations reported in each paper is available (whenever possible) in the paper's directory
This repository contains the software implementation of most algorithms used or developed in my research. The LaTeX and Python code for generating the
Map Ookla server locations as a Kernel Density Estimation (KDE) geographic map plot.
Ookla Server KDE Plotting This notebook was created to map Ookla server locations as a Kernel Density Estimation (KDE) geographic map plot. Currently,
A Bayesian cognition approach for belief updating of correlation judgement through uncertainty visualizations
Overview Code and supplemental materials for Karduni et al., 2020 IEEE Vis. "A Bayesian cognition approach for belief updating of correlation judgemen
Mmdb-server - An open source fast API server to lookup IP addresses for their geographic location
mmdb-server mmdb-server is an open source fast API server to lookup IP addresses
Generate daily updated visualizations of user and repository statistics from the GitHub API using GitHub Actions
Generate daily updated visualizations of user and repository statistics from the GitHub API using GitHub Actions for any combination of private and public repositories - dark mode supported
Data aggregated from the reports found at the MCPS COVID Dashboard into a set of visualizations.
Montgomery County Public Schools COVID-19 Visualizer Contents About this project Data Support this project About this project Data All data we use can

This is RFA-Toolbox, a simple and easy-to-use library that allows you to optimize your neural network architectures using receptive field analysis (RFA) and create graph visualizations of your architecture.
ReceptiveFieldAnalysisToolbox This is RFA-Toolbox, a simple and easy-to-use library that allows you to optimize your neural network architectures usin

A ninja python package that unifies the Google Earth Engine ecosystem.
A Python package that unifies the Google Earth Engine ecosystem. EarthEngine.jl | rgee | rgee+ | eemont GitHub: https://github.com/r-earthengine/ee_ex

This repository contains small projects related to Neural Networks and Deep Learning in general.
ILearnDeepLearning.py Description People say that nothing develops and teaches you like getting your hands dirty. This repository contains small proje

BlockVis - Create beautiful visualizations of Bitcoin Blockheaders
BlockVis Create beautiful visualizations of Bitcoin Blockheaders How to run To r
Python’s bokeh, holoviews, matplotlib, plotly, seaborn package-based visualizations about COVID statistics eventually hosted as a web app on Heroku
COVID-Watch-NYC-Python-Visualization-App Python’s bokeh, holoviews, matplotlib, plotly, seaborn package-based visualizations about COVID statistics ev
SAT Project - The first project I had done at General Assembly, performed EDA, data cleaning and created data visualizations
Project 1: Standardized Test Analysis by Adam Klesc Overview This project covers: Basic statistics and probability Many Python programming concepts Pr
Ecco is a python library for exploring and explaining Natural Language Processing models using interactive visualizations.
Visualize, analyze, and explore NLP language models. Ecco creates interactive visualizations directly in Jupyter notebooks explaining the behavior of Transformer-based language models (like GPT2, BERT, RoBERTA, T5, and T0).

Visualize data of Vietnam's regions with interactive maps.
Plotting Vietnam Development Map This is my personal project that I use plotly to analyse and visualize data of Vietnam's regions with interactive map
Visualizations of some specific solutions of different differential equations.
Diff_sims Visualizations of some specific solutions of different differential equations. Heat Equation in 1 Dimension (A very beautiful and elegant ex
Generate visualizations of GitHub user and repository statistics using GitHubActions
GitHub Stats Visualization Generate visualizations of GitHub user and repository
Generate visualizations of GitHub user and repository statistics using GitHub Actions.
GitHub Stats Visualization Generate visualizations of GitHub user and repository statistics using GitHub Actions. This project is currently a work-in-
A search engine to query social media insights with political theme
social-insights Social insights is an open source big data project that generates insights about various interesting topics happening every day. Curre

Example Code Notebooks for Data Visualization in Python
This repository contains sample code scripts for creating awesome data visualizations from scratch using different python libraries (such as matplotli
A library for bridging Python and HTML/Javascript (via Svelte) for creating interactive visualizations
A library for bridging Python and HTML/Javascript (via Svelte) for creating interactive visualizations

Standardized plots and visualizations in Python
Standardized plots and visualizations in Python pltviz is a Python package for standardized visualization. Routine and novel plotting approaches are f

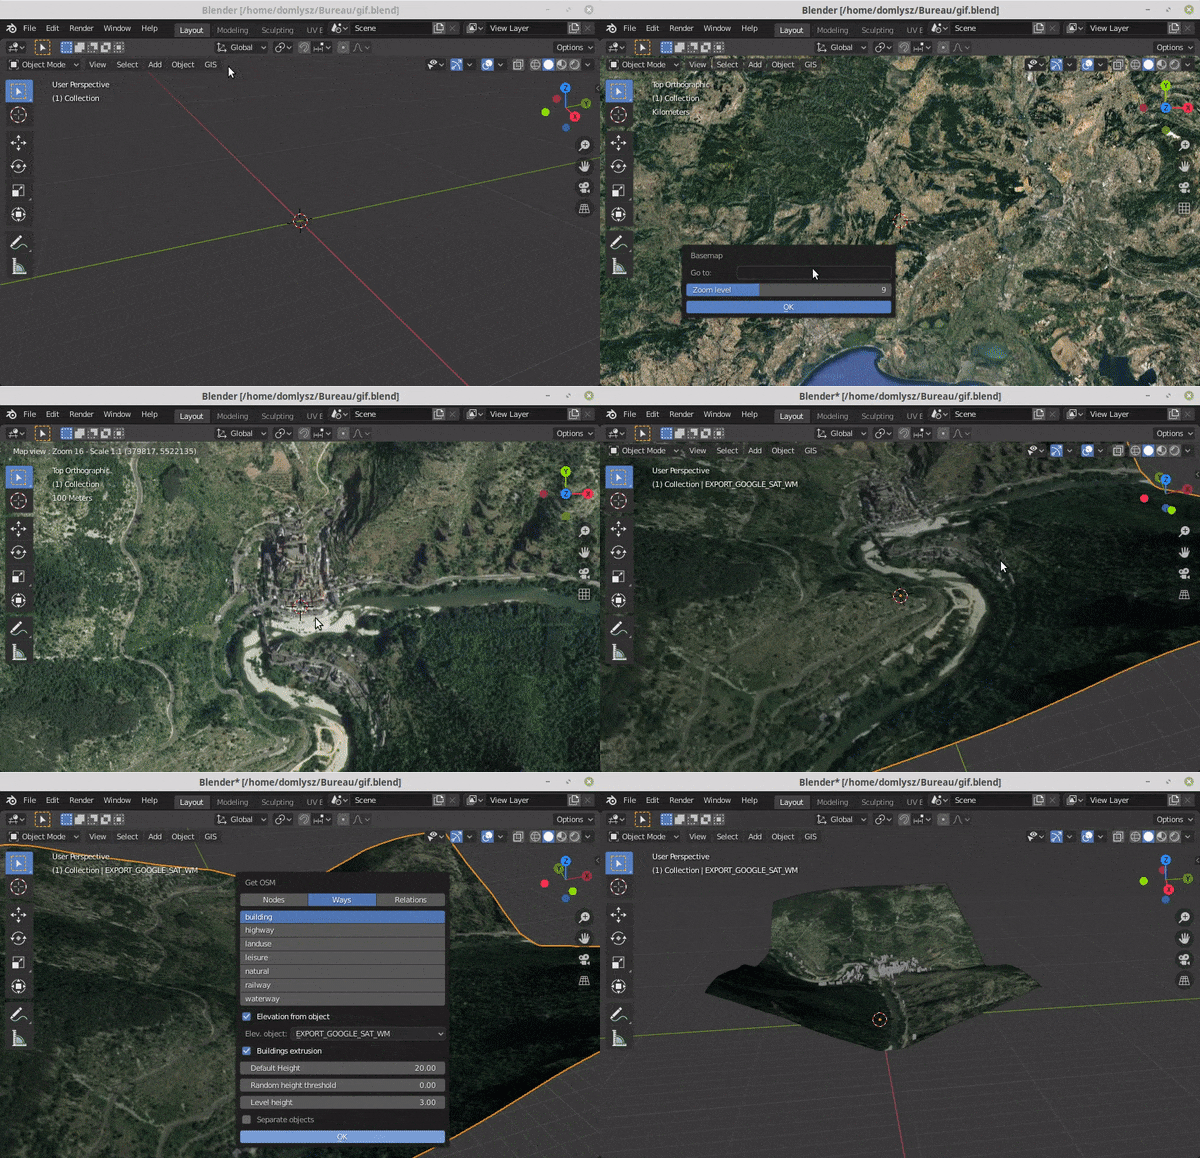
Make scripted visualizations in blender
Scripted visualizations in blender The goal of this project is to script 3D scientific visualizations using blender. To achieve this, we aim to bring

A python package that extends Google Earth Engine.
A python package that extends Google Earth Engine GitHub: https://github.com/davemlz/eemont Documentation: https://eemont.readthedocs.io/ PyPI: https:

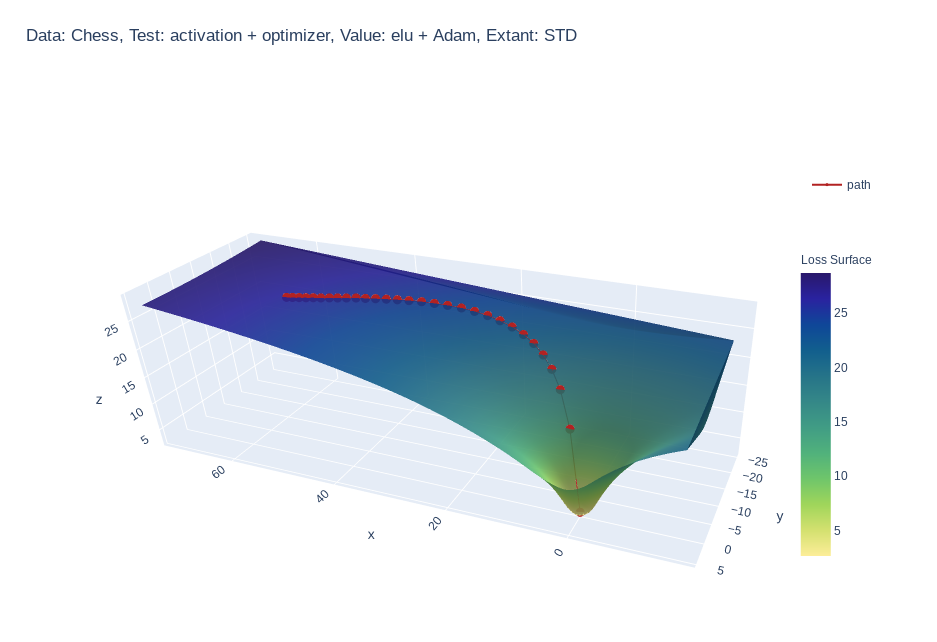
Create 3d loss surface visualizations, with optimizer path. Issues welcome!
MLVTK A loss surface visualization tool Simple feed-forward network trained on chess data, using elu activation and Adam optimizer Simple feed-forward
A Python package for caclulations and visualizations in geological sciences.
geo_calcs A Python package for caclulations and visualizations in geological sciences. Free software: MIT license Documentation: https://geo-calcs.rea
Generate visualizations of GitHub user and repository statistics using GitHub Actions.
GitHub Stats Visualization Generate visualizations of GitHub user and repository statistics using GitHub Actions. This project is currently a work-in-
Learning Convolutional Neural Networks with Interactive Visualization.
CNN Explainer An interactive visualization system designed to help non-experts learn about Convolutional Neural Networks (CNNs) For more information,
A set of scripts for a two-step procedure to measure the value of access to destinations across several modes of travel within a geographic area.
A set of scripts for a two-step procedure to measure the value of access to destinations across several modes of travel within a geographic area.
![Discovering Interpretable GAN Controls [NeurIPS 2020]](https://github.com/harskish/ganspace/raw/master/teaser.jpg)
Discovering Interpretable GAN Controls [NeurIPS 2020]
GANSpace: Discovering Interpretable GAN Controls Figure 1: Sequences of image edits performed using control discovered with our method, applied to thr

A flexible tool for creating, organizing, and sharing visualizations of live, rich data. Supports Torch and Numpy.
Visdom A flexible tool for creating, organizing, and sharing visualizations of live, rich data. Supports Python. Overview Concepts Setup Usage API To

A flexible tool for creating, organizing, and sharing visualizations of live, rich data. Supports Torch and Numpy.
Visdom A flexible tool for creating, organizing, and sharing visualizations of live, rich data. Supports Python. Overview Concepts Setup Usage API To

Datashader is a data rasterization pipeline for automating the process of creating meaningful representations of large amounts of data.
Datashader is a data rasterization pipeline for automating the process of creating meaningful representations of large amounts of data.

In this tutorial, raster models of soil depth and soil water holding capacity for the United States will be sampled at random geographic coordinates within the state of Colorado.
Raster_Sampling_Demo (Resulting graph of this demo) Background Sampling values of a raster at specific geographic coordinates can be done with a numbe

These data visualizations were created as homework for my CS40 class. I hope you enjoy!
Data Visualizations These data visualizations were created as homework for my CS40 class. I hope you enjoy! Nobel Laureates by their Country of Birth

These data visualizations were created for my introductory computer science course using Python
Homework 2: Matplotlib and Data Visualization Overview These data visualizations were created for my introductory computer science course using Python
This is a sorting visualizer made with Tkinter.
Sorting-Visualizer This is a sorting visualizer made with Tkinter. Make sure you've installed tkinter in your system to use this visualizer pip instal
EODAG is a command line tool and a plugin-oriented Python framework for searching, aggregating results and downloading remote sensed images while offering a unified API for data access regardless of the data provider
EODAG (Earth Observation Data Access Gateway) is a command line tool and a plugin-oriented Python framework for searching, aggregating results and downloading remote sensed images while offering a unified API for data access regardless of the data provider

Glue is a python project to link visualizations of scientific datasets across many files.
Glue Glue is a python project to link visualizations of scientific datasets across many files. Click on the image for a quick demo: Features Interacti

A gui application to visualize various sorting algorithms using pure python.
Sorting Algorithm Visualizer A gui application to visualize various sorting algorithms using pure python. Language : Python 3 Libraries required Tkint
Better GitHub statistics images for your profile, with stats from private and public repos
Better GitHub statistics images for your profile, with stats from private and public repos

Interactive Terraform visualization. State and configuration explorer.
Rover - Terraform Visualizer Rover is a Terraform visualizer. In order to do this, Rover: generates a plan file and parses the configuration in the ro

Many Class Activation Map methods implemented in Pytorch for CNNs and Vision Transformers. Including Grad-CAM, Grad-CAM++, Score-CAM, Ablation-CAM and XGrad-CAM
Class Activation Map methods implemented in Pytorch pip install grad-cam ⭐ Comprehensive collection of Pixel Attribution methods for Computer Vision.

A python toolbox for predictive uncertainty quantification, calibration, metrics, and visualization
Website, Tutorials, and Docs Uncertainty Toolbox A python toolbox for predictive uncertainty quantification, calibration, metrics, and visualizatio
Geographic add-ons for Django REST Framework. Maintained by the OpenWISP Project.
Geographic add-ons for Django REST Framework. Maintained by the OpenWISP Project.
📊📈 Serves up Pandas dataframes via the Django REST Framework for use in client-side (i.e. d3.js) visualizations and offline analysis (e.g. Excel)
📊📈 Serves up Pandas dataframes via the Django REST Framework for use in client-side (i.e. d3.js) visualizations and offline analysis (e.g. Excel)
GitHub Stats Visualizations : Transparent
GitHub Stats Visualizations : Transparent Generate visualizations of GitHub user and repository statistics using GitHub Actions. ⚠️ Disclaimer The pro
Geographic add-ons for Django REST Framework. Maintained by the OpenWISP Project.
django-rest-framework-gis Geographic add-ons for Django Rest Framework - Mailing List. Install last stable version from pypi pip install djangorestfra

A ready-to-use curated list of Spectral Indices for Remote Sensing applications.
A ready-to-use curated list of Spectral Indices for Remote Sensing applications. GitHub: https://github.com/davemlz/awesome-ee-spectral-indices Docume
📊📈 Serves up Pandas dataframes via the Django REST Framework for use in client-side (i.e. d3.js) visualizations and offline analysis (e.g. Excel)
Django REST Pandas Django REST Framework + pandas = A Model-driven Visualization API Django REST Pandas (DRP) provides a simple way to generate and se

Many Class Activation Map methods implemented in Pytorch for CNNs and Vision Transformers. Including Grad-CAM, Grad-CAM++, Score-CAM, Ablation-CAM and XGrad-CAM
Class Activation Map methods implemented in Pytorch pip install grad-cam ⭐ Tested on many Common CNN Networks and Vision Transformers. ⭐ Includes smoo

Visualizations of linear algebra algorithms for people who want a deep understanding
Visualising algorithms on symmetric matrices Examples QR algorithm and LR algorithm Here, we have a GIF animation of an interactive visualisation of t

A collection of 100 Deep Learning images and visualizations
A collection of Deep Learning images and visualizations. The project has been developed by the AI Summer team and currently contains almost 100 images.

A collection of 100 Deep Learning images and visualizations
A collection of Deep Learning images and visualizations. The project has been developed by the AI Summer team and currently contains almost 100 images.

Add Chart.js visualizations to your Django admin using a mixin class
django-admincharts Add Chart.js visualizations to your Django admin using a mixin class. Example from django.contrib import admin from .models import
create cohort visualizations for a subscription business
pycohort The main revenue generator for subscription businesses is recurring payments. There might be additional one-time offerings but the number of

Blender addons to make the bridge between Blender and geographic data
Blender GIS Blender minimal version : 2.8 Mac users warning : currently the addon does not work on Mac with Blender 2.80 to 2.82. Please do not report

Net2Vis automatically generates abstract visualizations for convolutional neural networks from Keras code.
Automatic neural network visualizations generated in your browser!
Search and download Copernicus Sentinel satellite images
sentinelsat Sentinelsat makes searching, downloading and retrieving the metadata of Sentinel satellite images from the Copernicus Open Access Hub easy

Simple, concise geographical visualization in Python
Geographic visualizations for HoloViews. Build Status Coverage Latest dev release Latest release Docs What is it? GeoViews is a Python library that ma
Fiona reads and writes geographic data files
Fiona Fiona reads and writes geographic data files and thereby helps Python programmers integrate geographic information systems with other computer s

Python tools for geographic data
GeoPandas Python tools for geographic data Introduction GeoPandas is a project to add support for geographic data to pandas objects. It currently impl
Real-time audio visualizations (spectrum, spectrogram, etc.)
Friture Friture is an application to visualize and analyze live audio data in real-time. Friture displays audio data in several widgets, such as a sco

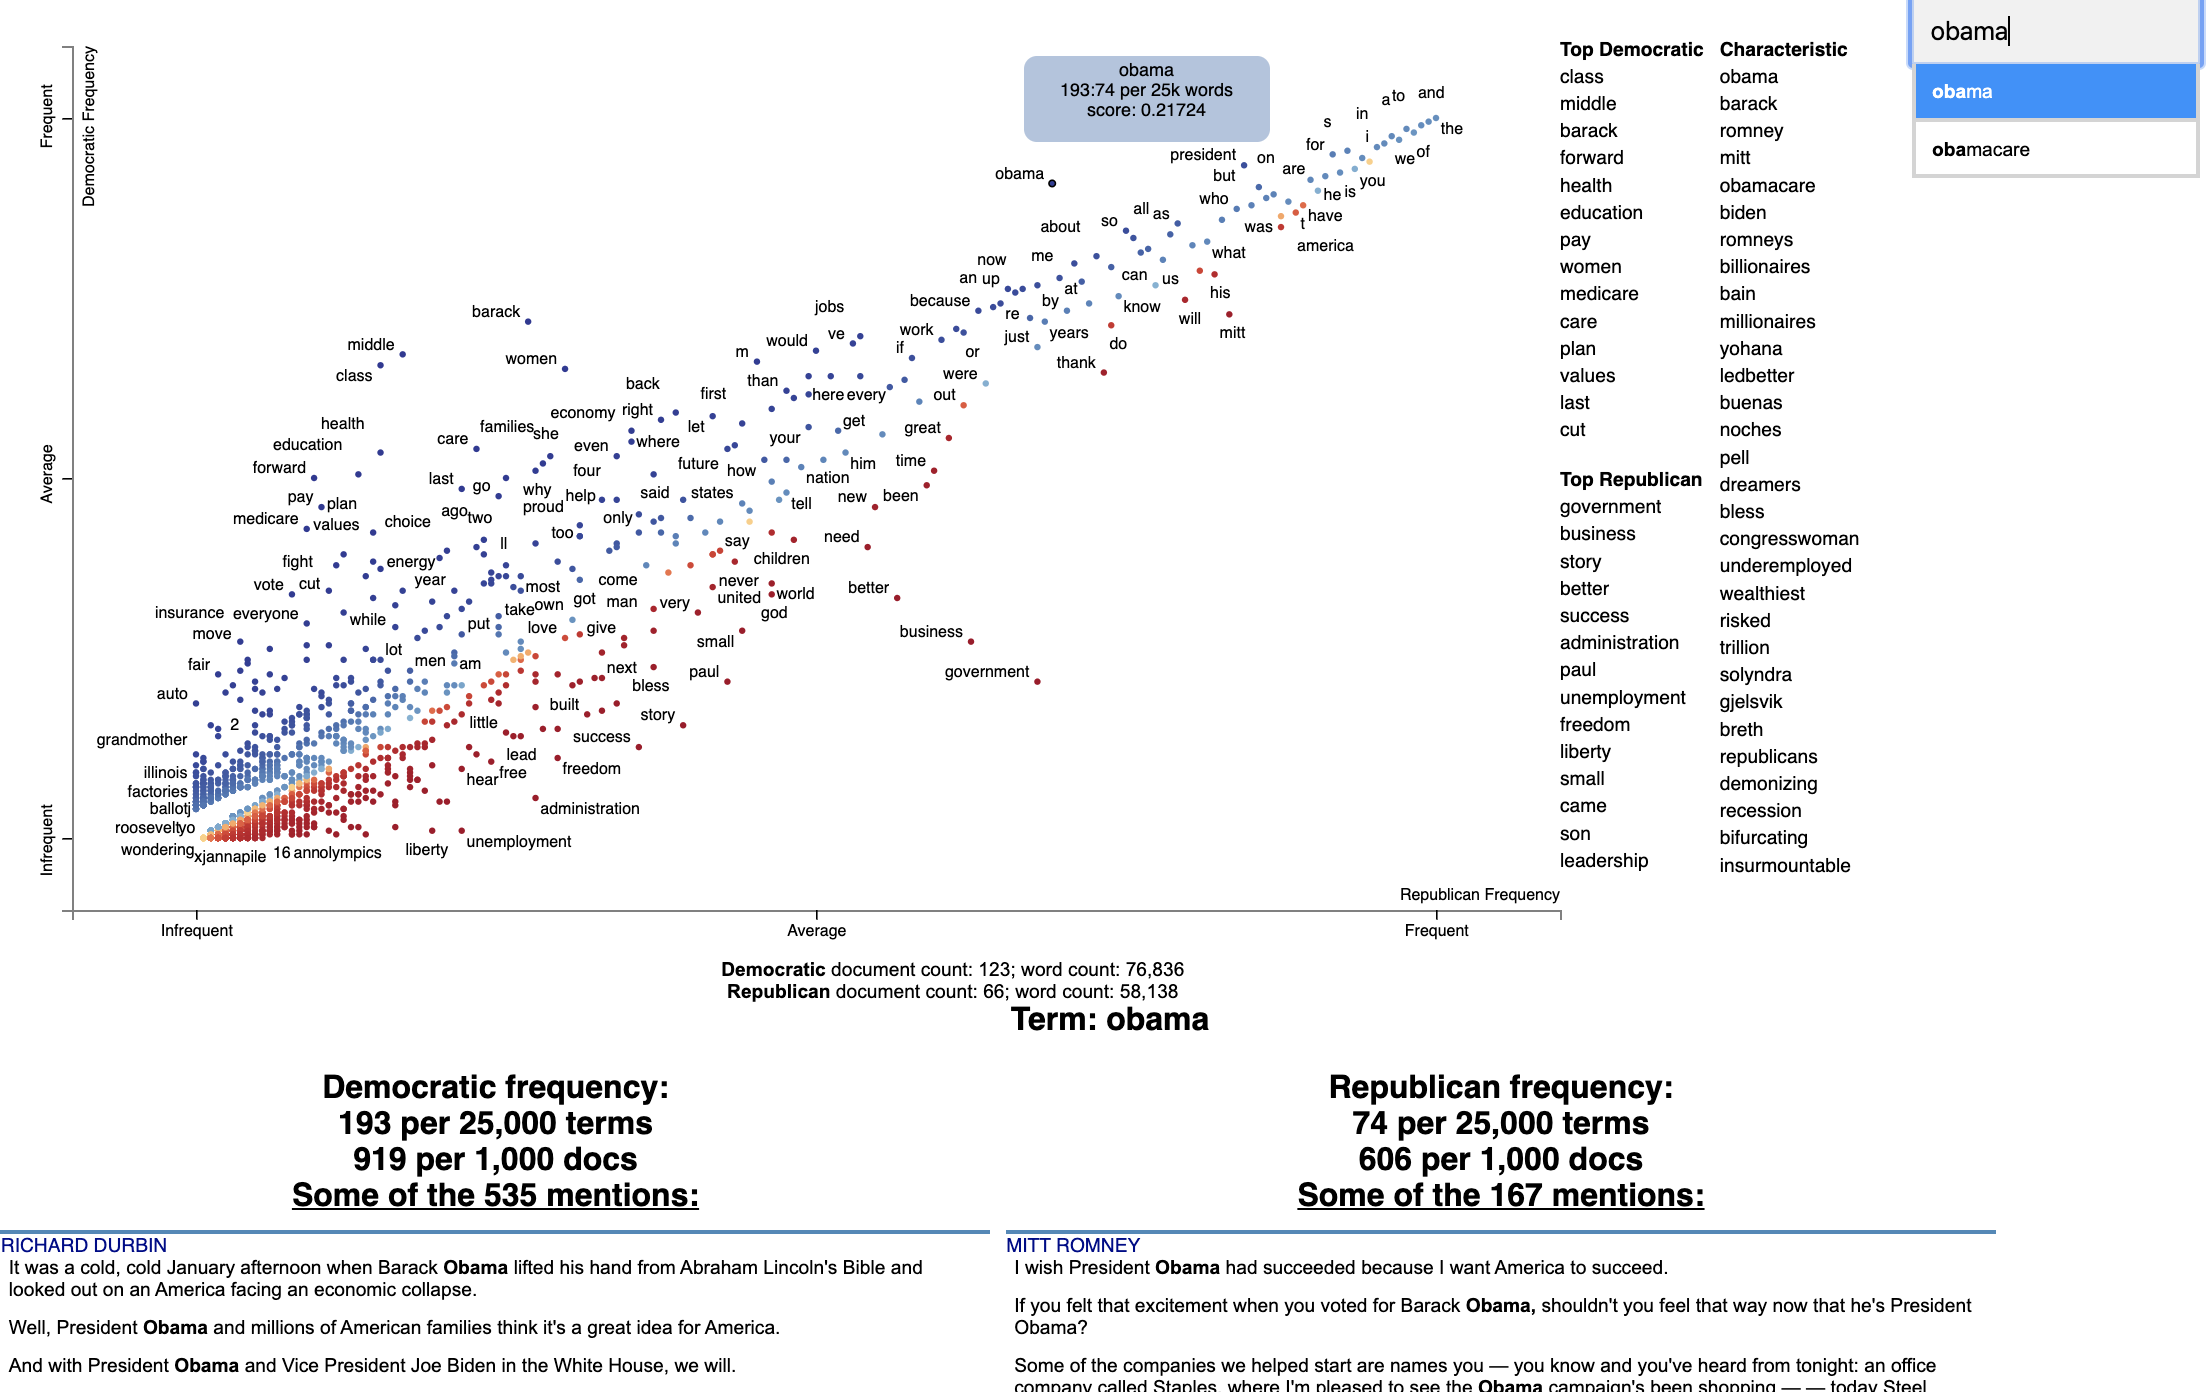
Beautiful visualizations of how language differs among document types.
Scattertext 0.1.0.0 A tool for finding distinguishing terms in corpora and displaying them in an interactive HTML scatter plot. Points corresponding t

Visualizations for machine learning datasets
Introduction The facets project contains two visualizations for understanding and analyzing machine learning datasets: Facets Overview and Facets Dive

Quickly and accurately render even the largest data.
Turn even the largest data into images, accurately Build Status Coverage Latest dev release Latest release Docs Support What is it? Datashader is a da

Plotting library for IPython/Jupyter notebooks
bqplot 2-D plotting library for Project Jupyter Introduction bqplot is a 2-D visualization system for Jupyter, based on the constructs of the Grammar

Beautiful visualizations of how language differs among document types.
Scattertext 0.1.0.0 A tool for finding distinguishing terms in corpora and displaying them in an interactive HTML scatter plot. Points corresponding t

Visualizations for machine learning datasets
Introduction The facets project contains two visualizations for understanding and analyzing machine learning datasets: Facets Overview and Facets Dive

Quickly and accurately render even the largest data.
Turn even the largest data into images, accurately Build Status Coverage Latest dev release Latest release Docs Support What is it? Datashader is a da

Plotting library for IPython/Jupyter notebooks
bqplot 2-D plotting library for Project Jupyter Introduction bqplot is a 2-D visualization system for Jupyter, based on the constructs of the Grammar
🏆 A ranked list of awesome machine learning Python libraries. Updated weekly.
Best-of Machine Learning with Python 🏆 A ranked list of awesome machine learning Python libraries. Updated weekly. This curated list contains 840 awe

Plotting library for IPython/Jupyter notebooks
bqplot 2-D plotting library for Project Jupyter Introduction bqplot is a 2-D visualization system for Jupyter, based on the constructs of the Grammar