653 Repositories
Python performance-visualization Libraries

When in Doubt: Improving Classification Performance with Alternating Normalization
When in Doubt: Improving Classification Performance with Alternating Normalization Findings of EMNLP 2021 Menglin Jia, Austin Reiter, Ser-Nam Lim, Yoa

AutoTabular automates machine learning tasks enabling you to easily achieve strong predictive performance in your applications.
AutoTabular AutoTabular automates machine learning tasks enabling you to easily achieve strong predictive performance in your applications. With just

A python module for scientific analysis of 3D objects based on VTK and Numpy
A lightweight and powerful python module for scientific analysis and visualization of 3d objects.

Visualization Data Drug in thailand during 2014 to 2020
Visualization Data Drug in thailand during 2014 to 2020 Data sorce from ข้อมูลเปิดภาครัฐ สำนักงาน ป.ป.ส Inttroducing program Using tkinter module for
A modular, research-friendly framework for high-performance and inference of sequence models at many scales
T5X T5X is a modular, composable, research-friendly framework for high-performance, configurable, self-service training, evaluation, and inference of

The Metabolomics Integrator (MINT) is a post-processing tool for liquid chromatography-mass spectrometry (LCMS) based metabolomics.
MINT (Metabolomics Integrator) The Metabolomics Integrator (MINT) is a post-processing tool for liquid chromatography-mass spectrometry (LCMS) based m

Data science, Data manipulation and Machine learning package.
duality Data science, Data manipulation and Machine learning package. Use permitted according to the terms of use and conditions set by the attached l

This is an auto-ML tool specialized in detecting of outliers
Auto-ML tool specialized in detecting of outliers Description This tool will allows you, with a Dash visualization, to compare 10 models of machine le

An implementation on "Curved-Voxel Clustering for Accurate Segmentation of 3D LiDAR Point Clouds with Real-Time Performance"
Lidar-Segementation An implementation on "Curved-Voxel Clustering for Accurate Segmentation of 3D LiDAR Point Clouds with Real-Time Performance" from

Decision Border Visualizer for Classification Algorithms
dbv Decision Border Visualizer for Classification Algorithms Project description A python package for Machine Learning Engineers who want to visualize

A command line tool for visualizing CSV/spreadsheet-like data
PerfPlotter Read data from CSV files using pandas and generate interactive plots using bokeh, which can then be embedded into HTML pages and served by
A Factor Model for Persistence in Investment Manager Performance
Factor-Model-Manager-Performance A Factor Model for Persistence in Investment Manager Performance I apply methods and processes similar to those used

Simple GUI python app to show a stocks graph performance. Made with Matplotlib and Tiingo.
stock-graph-python Simple GUI python app to show a stocks graph performance. Made with Matplotlib and Tiingo. Tiingo API Key You will need to add your

Open source single image super-resolution toolbox containing various functionality for training a diverse number of state-of-the-art super-resolution models. Also acts as the companion code for the IEEE signal processing letters paper titled 'Improving Super-Resolution Performance using Meta-Attention Layers’.
Deep-FIR Codebase - Super Resolution Meta Attention Networks About This repository contains the main coding framework accompanying our work on meta-at

State-of-the-art language models can match human performance on many tasks
Status: Archive (code is provided as-is, no updates expected) Grade School Math [Blog Post] [Paper] State-of-the-art language models can match human p
OneFlow is a performance-centered and open-source deep learning framework.
OneFlow OneFlow is a performance-centered and open-source deep learning framework. Latest News Version 0.5.0 is out! First class support for eager exe
Data visualization electromagnetic spectrum
Datenvisualisierung-Elektromagnetischen-Spektrum Anhand des Moduls matplotlib sollen die Daten des elektromagnetischen Spektrums dargestellt werden. D

A suite of benchmarks for CPU and GPU performance of the most popular high-performance libraries for Python :rocket:
A suite of benchmarks for CPU and GPU performance of the most popular high-performance libraries for Python :rocket:
An interactive tool with which to explore the possible imaging performance of candidate ngEHT architectures.
ngEHTexplorer An interactive tool with which to explore the possible imaging performance of candidate ngEHT architectures. Welcome! ngEHTexplorer is a

Homework 2: Matplotlib and Data Visualization
Homework 2: Matplotlib and Data Visualization Overview These data visualizations were created for my introductory computer science course using Python
This is a five-step framework for the development of intrusion detection systems (IDS) using machine learning (ML) considering model realization, and performance evaluation.
AB-TRAP: building invisibility shields to protect network devices The AB-TRAP framework is applicable to the development of Network Intrusion Detectio

Can we visualize a large scientific data set with a surrogate model? We're building a GAN for the Earth's Mantle Convection data set to see if we can!
EarthGAN - Earth Mantle Surrogate Modeling Can a surrogate model of the Earth’s Mantle Convection data set be built such that it can be readily run in
Nested Graph Neural Network (NGNN) is a general framework to improve a base GNN's expressive power and performance
Nested Graph Neural Networks About Nested Graph Neural Network (NGNN) is a general framework to improve a base GNN's expressive power and performance.
Implementation of several Bayesian multi-target tracking algorithms, including Poisson multi-Bernoulli mixture filters for sets of targets and sets of trajectories. The repository also includes the GOSPA metric and a metric for sets of trajectories to evaluate performance.
This repository contains the Matlab implementations for the following multi-target filtering/tracking algorithms: - Folder PMBM contains the implemen

Data visualization using matplotlib
Data visualization using matplotlib project instructions Top 5 Most Common Coffee Origins In this visualization I used data from Ankur Chavda on Kaggl

Rick and Morty Data Visualization with python
Rick and Morty Data Visualization For this project I looked at data for the TV show Rick and Morty Number of Episodes at a Certain Location Here is th

Create a visualization for Trump's Tweeted Words Using Python
Data Trump's Tweeted Words This plot illustrates twitter word occurences. We already did the coding I needed for this plot, so I was very inspired to

China and India Population and GDP Visualization
China and India Population and GDP Visualization Historical Population Comparison between India and China This graph shows the population data of Indi
Python IDE or notebook to generate a basic Kepler.gl data visualization
geospatial-data-analysis [readme] Use this code in your Python IDE or notebook to generate a basic Kepler.gl data visualization, without pre-configura
DirectML is a high-performance, hardware-accelerated DirectX 12 library for machine learning.
DirectML is a high-performance, hardware-accelerated DirectX 12 library for machine learning. DirectML provides GPU acceleration for common machine learning tasks across a broad range of supported hardware and drivers, including all DirectX 12-capable GPUs from vendors such as AMD, Intel, NVIDIA, and Qualcomm.
Assessing the Influence of Models on the Performance of Reinforcement Learning Algorithms applied on Continuous Control Tasks
Assessing the Influence of Models on the Performance of Reinforcement Learning Algorithms applied on Continuous Control Tasks This is the master thesi
This is a web application to visualize various famous technical indicators and stocks tickers from user
Visualizing Technical Indicators Using Python and Plotly. Currently facing issues hosting the application on heroku. As soon as I am able to I'll like
a discord libary that use to make discord bot with low efficiency and bad performance because I don't know how to manage the project
Aircord 🛩️ a discord libary that use to make discord bot with low efficiency and bad performance because I don't know how to manage the project Examp

LibreMind is a free meditation app made in under 24 hours. It has various meditation, breathwork, and visualization exercises.
libreMind Meditation exercises What is it? LibreMind is a free meditation app made in under 24 hours. It has various meditation, breathwork, and visua
3D detection and tracking viewer (visualization) for kitti & waymo dataset
3D detection and tracking viewer (visualization) for kitti & waymo dataset

High-fidelity performance metrics for generative models in PyTorch
High-fidelity performance metrics for generative models in PyTorch

Comparing Database performance with Django ORM
Comparing Database performance with Django ORM Postgresql MySQL MariaDB SQLite Comparing database operation performance using django ORM. PostgreSQL v

API with high performance to create a simple blog and Auth using OAuth2 ⛏
DogeAPI API with high performance built with FastAPI & SQLAlchemy, help to improve connection with your Backend Side to create a simple blog and Cruds
Compares various time-series feature sets on computational performance, within-set structure, and between-set relationships.
feature-set-comp Compares various time-series feature sets on computational performance, within-set structure, and between-set relationships. Reposito
This is a sorting visualizer made with Tkinter.
Sorting-Visualizer This is a sorting visualizer made with Tkinter. Make sure you've installed tkinter in your system to use this visualizer pip instal

JittorVis - Visual understanding of deep learning models
JittorVis: Visual understanding of deep learning model JittorVis is an open-source library for understanding the inner workings of Jittor models by vi

A multi-functional library for full-stack Deep Learning. Simplifies Model Building, API development, and Model Deployment.
chitra What is chitra? chitra (चित्र) is a multi-functional library for full-stack Deep Learning. It simplifies Model Building, API development, and M

Simple CLI python app to show a stocks graph performance. Made with Matplotlib and Tiingo.
stock-graph-python Simple CLI python app to show a stocks graph performance. Made with Matplotlib and Tiingo. Tiingo API Key You will need to add your
A simple example of ML classification, cross validation, and visualization of feature importances
Simple-Classifier This is a basic example of how to use several different libraries for classification and ensembling, mostly with sklearn. Example as

QuakeLabeler is a Python package to create and manage your seismic training data, processes, and visualization in a single place — so you can focus on building the next big thing.
QuakeLabeler Quake Labeler was born from the need for seismologists and developers who are not AI specialists to easily, quickly, and independently bu

Retentioneering: product analytics, data-driven customer journey map optimization, marketing analytics, web analytics, transaction analytics, graph visualization, and behavioral segmentation with customer segments in Python.
What is Retentioneering? Retentioneering is a Python framework and library to assist product analysts and marketing analysts as it makes it easier to

🔥🔥High-Performance Face Recognition Library on PaddlePaddle & PyTorch🔥🔥
face.evoLVe: High-Performance Face Recognition Library based on PaddlePaddle & PyTorch Evolve to be more comprehensive, effective and efficient for fa

Developed a website to analyze and generate report of students based on the curriculum that represents student’s academic performance.
Developed a website to analyze and generate report of students based on the curriculum that represents student’s academic performance. We have developed the system such that, it will automatically parse data onto the database from excel file, which will in return reduce time consumption of analysis of data.
ticktock is a minimalist library to view Python time performance of Python code.
ticktock is a minimalist library to view Python time performance of Python code.

Seaborn-image is a Python image visualization library based on matplotlib and provides a high-level API to draw attractive and informative images quickly and effectively.
seaborn-image: image data visualization Description Seaborn-image is a Python image visualization library based on matplotlib and provides a high-leve

Doosan robotic arm, simulation, control, visualization in Gazebo and ROS2 for Reinforcement Learning.
Robotic Arm Simulation in ROS2 and Gazebo General Overview This repository includes: First, how to simulate a 6DoF Robotic Arm from scratch using GAZE
The PyTorch re-implement of a 3D CNN Tracker to extract coronary artery centerlines with state-of-the-art (SOTA) performance. (paper: 'Coronary artery centerline extraction in cardiac CT angiography using a CNN-based orientation classifier')
The PyTorch re-implement of a 3D CNN Tracker to extract coronary artery centerlines with state-of-the-art (SOTA) performance. (paper: 'Coronary artery centerline extraction in cardiac CT angiography using a CNN-based orientation classifier')
missing-pixel-filler is a python package that, given images that may contain missing data regions (like satellite imagery with swath gaps), returns these images with the regions filled.
Missing Pixel Filler This is the official code repository for the Missing Pixel Filler by SpaceML. missing-pixel-filler is a python package that, give

A GUI visualization of QuickSort algorithm
QQuickSort A simple GUI visualization of QuickSort algorithm. It only uses PySide6, it does not have any other external dependency. How to run Install

PoseViz – Multi-person, multi-camera 3D human pose visualization tool built using Mayavi.
PoseViz – 3D Human Pose Visualizer Multi-person, multi-camera 3D human pose visualization tool built using Mayavi. As used in MeTRAbs visualizations.

Glue is a python project to link visualizations of scientific datasets across many files.
Glue Glue is a python project to link visualizations of scientific datasets across many files. Click on the image for a quick demo: Features Interacti

🌌 Economics Observatory Visualisation Repository
Economics Observatory Visualisation Repository Website | Visualisations | Data | Here you will find all the data visualisations and infographics attac

Propose a principled and practically effective framework for unsupervised accuracy estimation and error detection tasks with theoretical analysis and state-of-the-art performance.
Detecting Errors and Estimating Accuracy on Unlabeled Data with Self-training Ensembles This project is for the paper: Detecting Errors and Estimating

A gui application to visualize various sorting algorithms using pure python.
Sorting Algorithm Visualizer A gui application to visualize various sorting algorithms using pure python. Language : Python 3 Libraries required Tkint

An easy-to-use high-performance asynchronous web framework.
中文 | English 一个易用的高性能异步 web 框架。 Index.py 文档 Index.py 实现了 ASGI3 接口,并使用 Radix Tree 进行路由查找。是最快的 Python web 框架之一。一切特性都服务于快速开发高性能的 Web 服务。 大量正确的类型注释 灵活且高效的
EasyBuild is a software build and installation framework that allows you to manage (scientific) software on High Performance Computing (HPC) systems in an efficient way.
EasyBuild is a software build and installation framework that allows you to manage (scientific) software on High Performance Computing (HPC) systems in an efficient way.
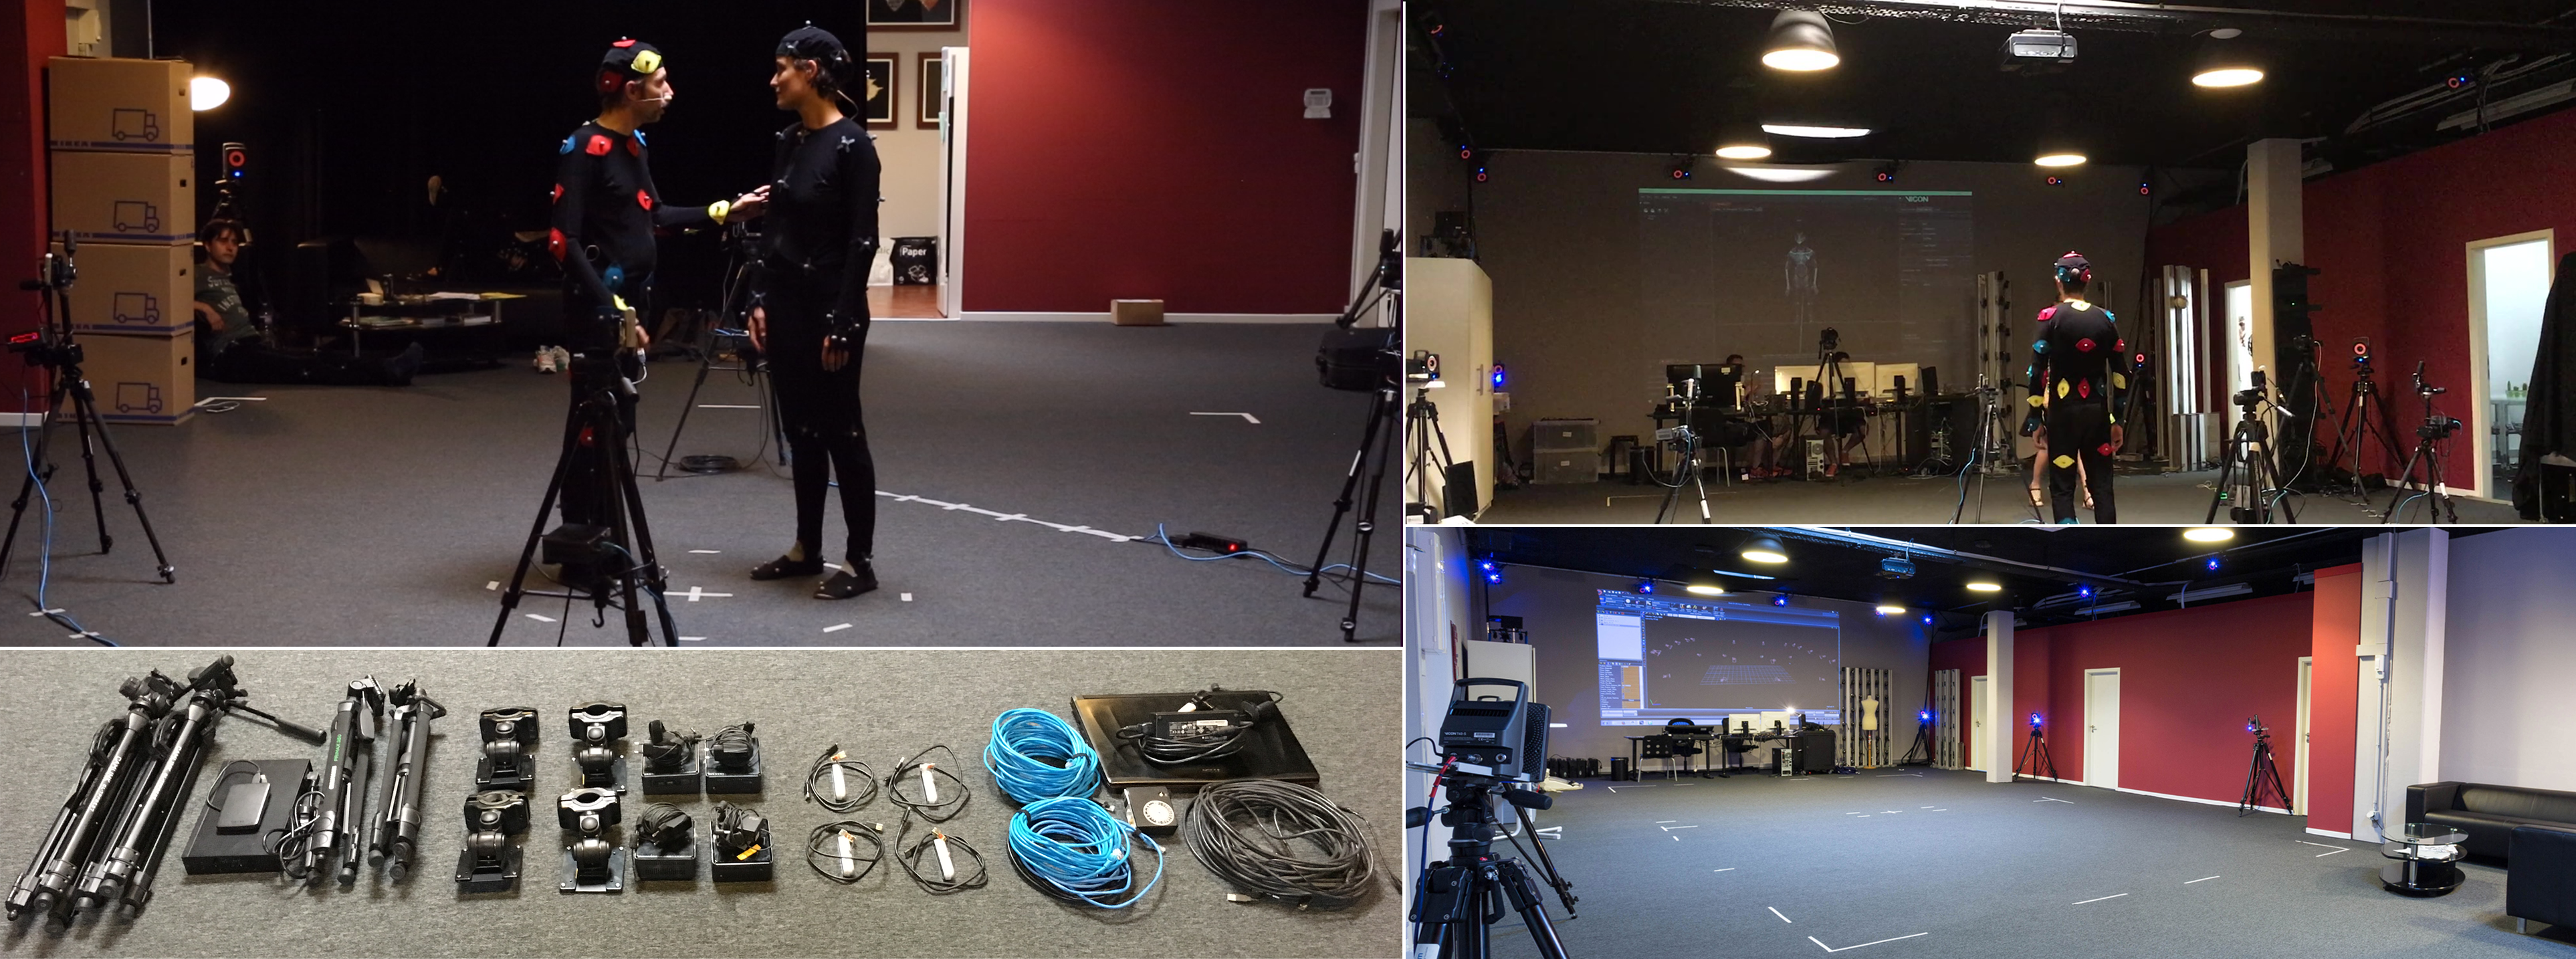
Human4D Dataset tools for processing and visualization
HUMAN4D: A Human-Centric Multimodal Dataset for Motions & Immersive Media HUMAN4D constitutes a large and multimodal 4D dataset that contains a variet
A data visualization curriculum of interactive notebooks.
A data visualization curriculum of interactive notebooks, using Vega-Lite and Altair. This repository contains a series of Python-based Jupyter notebooks.

GraPE is a Rust/Python library for high-performance Graph Processing and Embedding.
GraPE GraPE (Graph Processing and Embedding) is a fast graph processing and embedding library, designed to scale with big graphs and to run on both of

Optimizing DR with hard negatives and achieving SOTA first-stage retrieval performance on TREC DL Track (SIGIR 2021 Full Paper).
Optimizing Dense Retrieval Model Training with Hard Negatives Jingtao Zhan, Jiaxin Mao, Yiqun Liu, Jiafeng Guo, Min Zhang, Shaoping Ma 🔥 News 2021-10
Companion code for "Bayesian logistic regression for online recalibration and revision of risk prediction models with performance guarantees"
Companion code for "Bayesian logistic regression for online recalibration and revision of risk prediction models with performance guarantees" Installa

A visualization tool made in Pygame for various pathfinding algorithms.
Pathfinding-Visualizer 🚀 A visualization tool made in Pygame for various pathfinding algorithms. Pathfinding is closely related to the shortest path

Using Selenium with Python to Web Scrap Popular Youtube Tech Channels.
Web Scrapping Popular Youtube Tech Channels with Selenium Data Mining, Data Wrangling, and Exploratory Data Analysis About the Data Web scrapi
HyperSpy is an open source Python library for the interactive analysis of multidimensional datasets
HyperSpy is an open source Python library for the interactive analysis of multidimensional datasets that can be described as multidimensional arrays o

A data analysis using python and pandas to showcase trends in school performance.
A data analysis using python and pandas to showcase trends in school performance. A data analysis to showcase trends in school performance using Panda

High performance Python GLMs with all the features!
High performance Python GLMs with all the features!

Pytorch implementation for our ICCV 2021 paper "TRAR: Routing the Attention Spans in Transformers for Visual Question Answering".
TRAnsformer Routing Networks (TRAR) This is an official implementation for ICCV 2021 paper "TRAR: Routing the Attention Spans in Transformers for Visu
High Performance Blockchain Deserializer
bitcoin_explorer is an efficient library for reading bitcoin-core binary blockchain file as a database (utilising multi-threading).

Lark is a parsing toolkit for Python, built with a focus on ergonomics, performance and modularity.
Lark is a parsing toolkit for Python, built with a focus on ergonomics, performance and modularity.
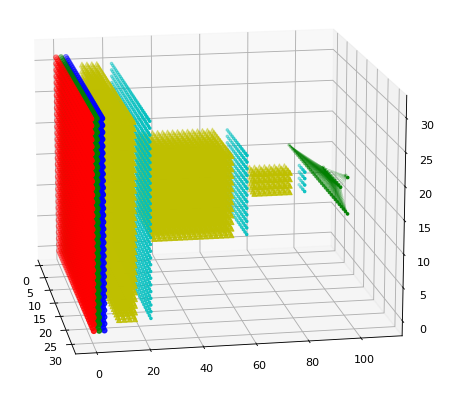
A ultra-lightweight 3D renderer of the Tensorflow/Keras neural network architectures
A ultra-lightweight 3D renderer of the Tensorflow/Keras neural network architectures

Reporting and Visualization for Hazardous Events
Reporting and Visualization for Hazardous Events
guapow is an on-demand and auto performance optimizer for Linux applications.
guapow is an on-demand and auto performance optimizer for Linux applications. This project's name is an abbreviation for Guarana powder (Guaraná is a fruit from the Amazon rainforest with a highly caffeinated seed).
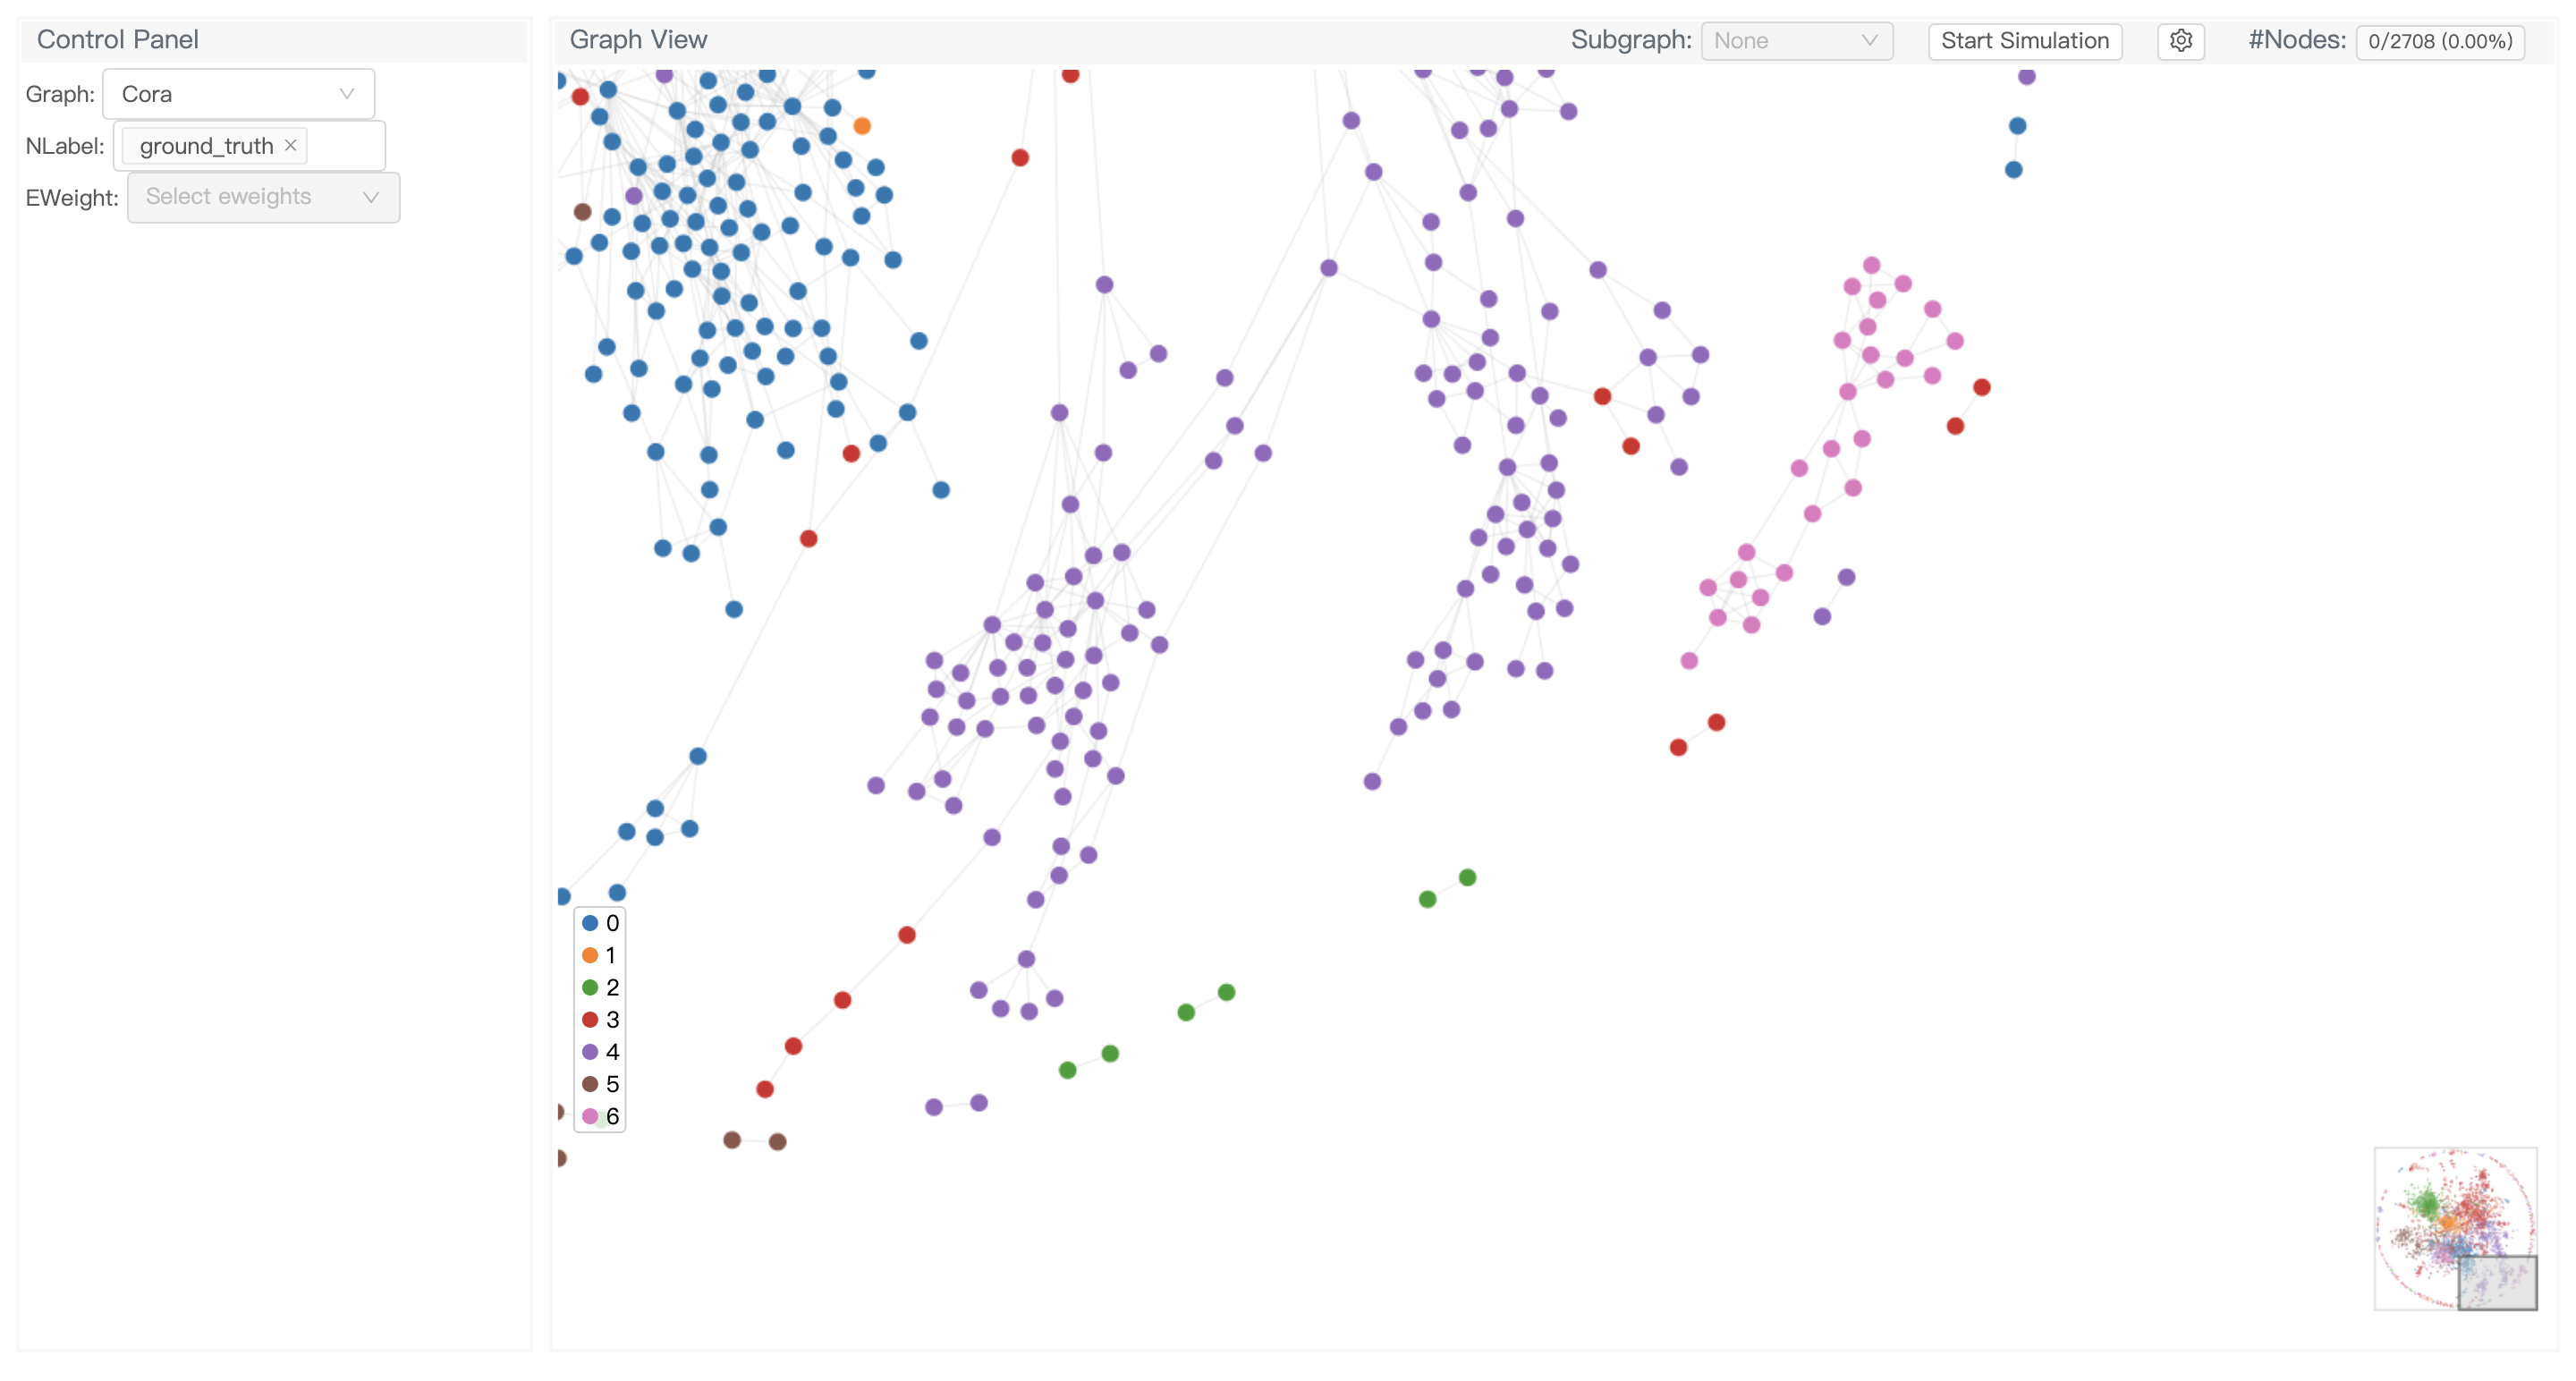
GNNLens2 is an interactive visualization tool for graph neural networks (GNN).
GNNLens2 is an interactive visualization tool for graph neural networks (GNN).

Mosec is a high-performance and flexible model serving framework for building ML model-enabled backend and microservices
Mosec is a high-performance and flexible model serving framework for building ML model-enabled backend and microservices. It bridges the gap between any machine learning models you just trained and the efficient online service API.

Interactive Terraform visualization. State and configuration explorer.
Rover - Terraform Visualizer Rover is a Terraform visualizer. In order to do this, Rover: generates a plan file and parses the configuration in the ro
a high-performance, lightweight and human friendly serving engine for scrapy
a high-performance, lightweight and human friendly serving engine for scrapy

PerfSpect is a system performance characterization tool based on linux perf targeting Intel microarchitectures
PerfSpect PerfSpect is a system performance characterization tool based on linux perf targeting Intel microarchitectures. The tool has two parts perf

AutoTabular automates machine learning tasks enabling you to easily achieve strong predictive performance in your applications.
AutoTabular automates machine learning tasks enabling you to easily achieve strong predictive performance in your applications. With just a few lines of code, you can train and deploy high-accuracy machine learning and deep learning models tabular data.

🔥🔥High-Performance Face Recognition Library on PaddlePaddle & PyTorch🔥🔥
face.evoLVe: High-Performance Face Recognition Library based on PaddlePaddle & PyTorch Evolve to be more comprehensive, effective and efficient for fa
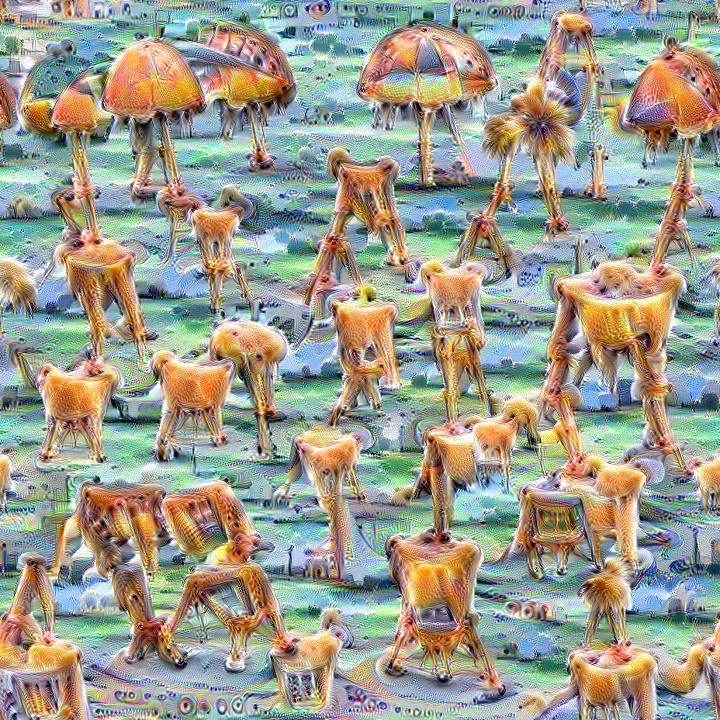
Quickly and easily create / train a custom DeepDream model
Dream-Creator This project aims to simplify the process of creating a custom DeepDream model by using pretrained GoogleNet models and custom image dat

Visualization toolkit for neural networks in PyTorch! Demo --
FlashTorch A Python visualization toolkit, built with PyTorch, for neural networks in PyTorch. Neural networks are often described as "black box". The

PyTorch implementation of DeepDream algorithm
neural-dream This is a PyTorch implementation of DeepDream. The code is based on neural-style-pt. Here we DeepDream a photograph of the Golden Gate Br

Pytorch implementation of convolutional neural network visualization techniques
Convolutional Neural Network Visualizations This repository contains a number of convolutional neural network visualization techniques implemented in

A python toolbox for predictive uncertainty quantification, calibration, metrics, and visualization
Website, Tutorials, and Docs Uncertainty Toolbox A python toolbox for predictive uncertainty quantification, calibration, metrics, and visualizatio
Simple spectra visualization tool for astronomers
SpecViewer A simple visualization tool for astronomers. Dependencies Python = 3.7.4 PyQt5 = 5.15.4 pyqtgraph == 0.10.0 numpy = 1.19.4 How to use py

Sampling profiler for Python programs
py-spy: Sampling profiler for Python programs py-spy is a sampling profiler for Python programs. It lets you visualize what your Python program is spe

A Structured Self-attentive Sentence Embedding
Structured Self-attentive sentence embeddings Implementation for the paper A Structured Self-Attentive Sentence Embedding, which was published in ICLR

PyTorch implementation of Value Iteration Networks (VIN): Clean, Simple and Modular. Visualization in Visdom.
VIN: Value Iteration Networks This is an implementation of Value Iteration Networks (VIN) in PyTorch to reproduce the results.(TensorFlow version) Key
S3-plugin is a high performance PyTorch dataset library to efficiently access datasets stored in S3 buckets.
S3-plugin is a high performance PyTorch dataset library to efficiently access datasets stored in S3 buckets.

Sampling profiler for Python programs
py-spy: Sampling profiler for Python programs py-spy is a sampling profiler for Python programs. It lets you visualize what your Python program is spe
Django package to log request values such as device, IP address, user CPU time, system CPU time, No of queries, SQL time, no of cache calls, missing, setting data cache calls for a particular URL with a basic UI.
django-web-profiler's documentation: Introduction: django-web-profiler is a django profiling tool which logs, stores debug toolbar statistics and also
NeRF visualization library under construction
NeRF visualization library using PlenOctrees, under construction pip install nerfvis Docs will be at: https://nerfvis.readthedocs.org import nerfvis s
Code of the paper "Performance-Efficiency Trade-offs in Unsupervised Pre-training for Speech Recognition"
SEW (Squeezed and Efficient Wav2vec) The repo contains the code of the paper "Performance-Efficiency Trade-offs in Unsupervised Pre-training for Speec
No effort, no worry, maximum performance.
Django Cachalot Caches your Django ORM queries and automatically invalidates them. Documentation: http://django-cachalot.readthedocs.io Table of Conte
