401 Repositories
Python d3-visualization Libraries

📦 PyTorch based visualization package for generating layer-wise explanations for CNNs.
Explainable CNNs 📦 Flexible visualization package for generating layer-wise explanations for CNNs. It is a common notion that a Deep Learning model i

Course materials for: Geospatial Data Science
Course materials for: Geospatial Data Science These course materials cover the lectures for the course held for the first time in spring 2022 at IT Un

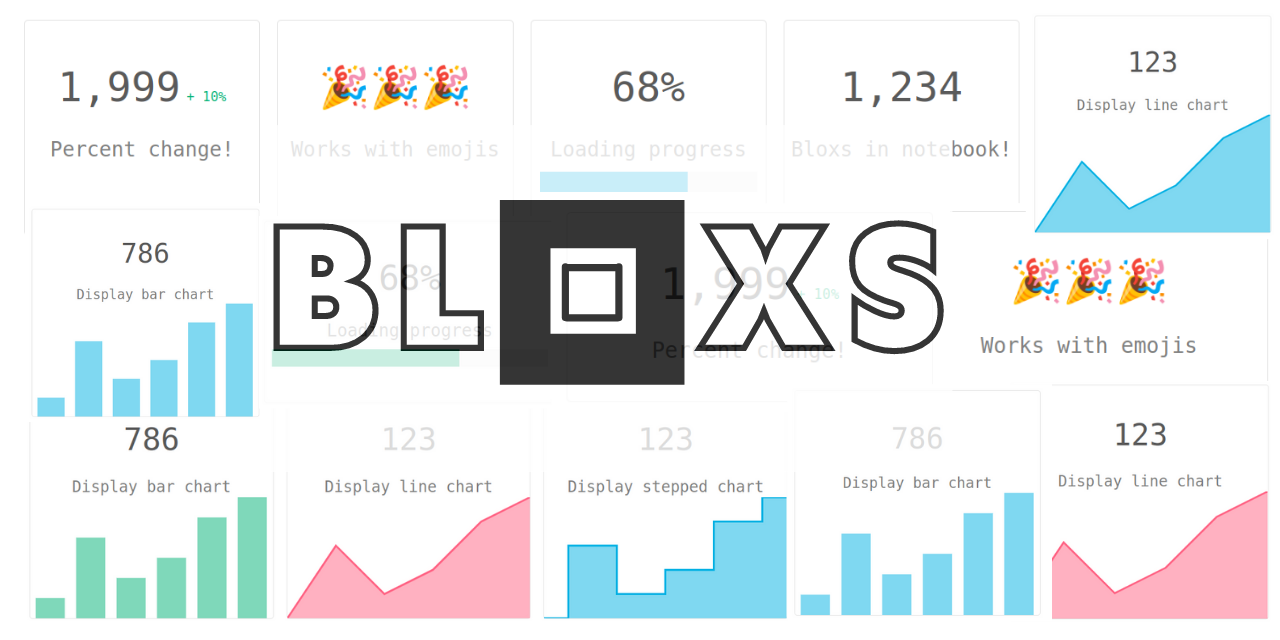
Display your data in an attractive way in your notebook!
Bloxs Bloxs is a simple python package that helps you display information in an attractive way (formed in blocks). Perfect for building dashboards, re

A Python package develop for transportation spatio-temporal big data processing, analysis and visualization.
English 中文版 TransBigData Introduction TransBigData is a Python package developed for transportation spatio-temporal big data processing, analysis and

Seaborn is one of the go-to tools for statistical data visualization in python. It has been actively developed since 2012 and in July 2018, the author released version 0.9. This version of Seaborn has several new plotting features, API changes and documentation updates which combine to enhance an already great library. This article will walk through a few of the highlights and show how to use the new scatter and line plot functions for quickly creating very useful visualizations of data.
12_Python_Seaborn_Module Introduction 👋 From the website, “Seaborn is a Python data visualization library based on matplotlib. It provides a high-lev
A python library to artfully visualize Factorio Blueprints and an interactive web demo for using it.
Factorio Blueprint Visualizer I love the game Factorio and I really like the look of factories after growing for many hours or blueprints after tweaki
Simple, Fast, Powerful and Easily extensible python package for extracting patterns from text, with over than 60 predefined Regular Expressions.
patterns-finder Simple, Fast, Powerful and Easily extensible python package for extracting patterns from text, with over than 60 predefined Regular Ex
Regress.me is an easy to use data visualization tool powered by Dash/Plotly.
Regress.me Regress.me is an easy to use data visualization tool powered by Dash/Plotly. Regress.me.-.Google.Chrome.2022-05-10.15-58-59.mp4 Get Started

Detecting silent model failure. NannyML estimates performance with an algorithm called Confidence-based Performance estimation (CBPE), developed by core contributors. It is the only open-source algorithm capable of fully capturing the impact of data drift on performance.
Website • Docs • Community Slack 💡 What is NannyML? NannyML is an open-source python library that allows you to estimate post-deployment model perfor

A Power BI/Google Studio Dashboard to analyze previous OTC CatchUps
OTC CatchUp Dashboard A Power BI/Google Studio dashboard analyzing OTC CatchUps. File Contents * ├───data ├───old summaries ─── *.md ├

SentimentArcs: a large ensemble of dozens of sentiment analysis models to analyze emotion in text over time
SentimentArcs - Emotion in Text An end-to-end pipeline based on Jupyter notebooks to detect, extract, process and anlayze emotion over time in text. E

A tool for generating skill map/tree like diagram
skillmap A tool for generating skill map/tree like diagram. What is a skill map/tree? Skill tree is a term used in video games, and it can be used for

ManimML is a project focused on providing animations and visualizations of common machine learning concepts with the Manim Community Library.
ManimML ManimML is a project focused on providing animations and visualizations of common machine learning concepts with the Manim Community Library.

A workshop on data visualization in Python with notebooks and exercises for following along.
Beyond the Basics: Data Visualization in Python The human brain excels at finding patterns in visual representations, which is why data visualizations

ipyvizzu - Jupyter notebook integration of Vizzu
ipyvizzu - Jupyter notebook integration of Vizzu. Tutorial · Examples · Repository About The Project ipyvizzu is the Jupyter Notebook integration of V

ML powered analytics engine for outlier detection and root cause analysis.
Website • Docs • Blog • LinkedIn • Community Slack ML powered analytics engine for outlier detection and root cause analysis ✨ What is Chaos Genius? C

This is a API/Website to see the attendance recorded in your college website along with how many days you can take days off OR to attend class!!
Bunker-Website This is a GUI version of the Bunker-API along with some visualization charts to see your attendance progress. Website Link Check out th
Visualization of COVID-19 Omicron wave data in Seoul, Osaka, Tokyo, Hong Kong and Shanghai. 首尔、大阪、东京、香港、上海由新冠病毒 Omicron 变异株引起的本轮疫情数据可视化分析。
COVID-19 in East Asian Megacities This repository holds original Python code for processing and visualization COVID-19 data in East Asian megacities a

Addon and nodes for working with structural biology and molecular data in Blender.
Molecular Nodes 🧬 🔬 💻 Buy Me a Coffee to Keep Development Going! Join a Community of Blender SciVis People! What is Molecular Nodes? Molecular Node

Visualization Library
CamViz Overview // Installation // Demos // License Overview CamViz is a visualization library developed by the TRI-ML team with the goal of providing
Data visualization app for H&M competition in kaggle
handm_data_visualize_app Data visualization app by streamlit for H&M competition in kaggle. competition page: https://www.kaggle.com/competitions/h-an

DataAnalysis: Some data analysis projects in charles_pikachu
DataAnalysis DataAnalysis: Some data analysis projects in charles_pikachu You can star this repository to keep track of the project if it's helpful fo
OS Algo Visualization - Operating system algorithm visualization using python pygame library
OS_Algo_Visualization Operating system algorithm visualization using python pyga
Vaex library for Big Data Analytics of an Airline dataset
Vaex-Big-Data-Analytics-for-Airline-data A Python notebook (ipynb) created in Jupyter Notebook, which utilizes the Vaex library for Big Data Analytics

BASH - Biomechanical Animated Skinned Human
We developed a method animating a statistical 3D human model for biomechanical analysis to increase accessibility for non-experts, like patients, athletes, or designers.

A framework for GPU based high-performance medical image processing and visualization
FAST is an open-source cross-platform framework with the main goal of making it easier to do high-performance processing and visualization of medical images on heterogeneous systems utilizing both multi-core CPUs and GPUs. To achieve this, FAST use modern C++, OpenCL and OpenGL.
Customizing Visual Styles in Plotly
Customizing Visual Styles in Plotly Code for a workshop originally developed for an Unconference session during the Outlier Conference hosted by Data

metedraw is a project mainly for data visualization projects of Atmospheric Science, Marine Science, Environmental Science or other majors
It is mainly for data visualization projects of Atmospheric Science, Marine Science, Environmental Science or other majors.
Company clustering with K-means/GMM and visualization with PCA, t-SNE, using SSAN relation extraction
RE results graph visualization and company clustering Installation pip install -r requirements.txt python -m nltk.downloader stopwords python3.7 main.

Implementation of SOMs (Self-Organizing Maps) with neighborhood-based map topologies.
py-self-organizing-maps Simple implementation of self-organizing maps (SOMs) A SOM is an unsupervised method for learning a mapping from a discrete ne

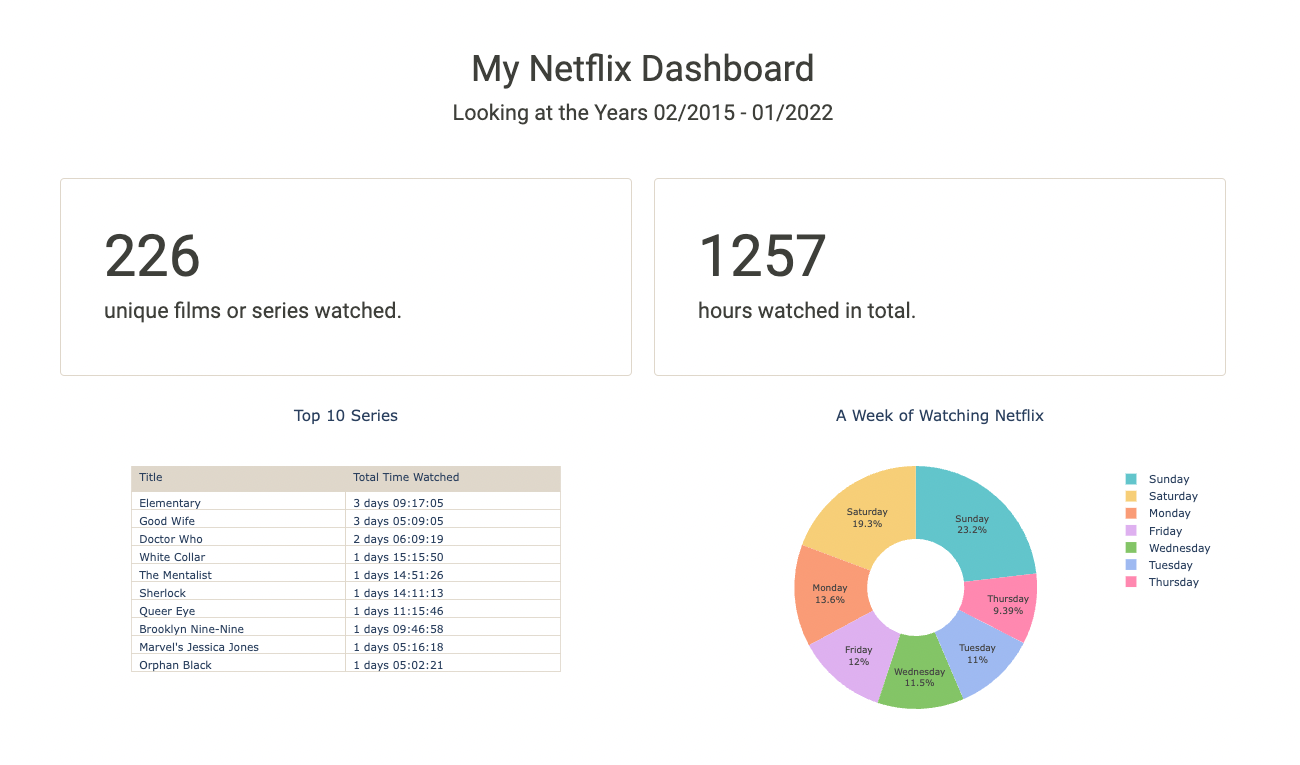
Project: Netflix Data Analysis and Visualization with Python
Project: Netflix Data Analysis and Visualization with Python Table of Contents General Info Installation Demo Usage and Main Functionalities Contribut
Data Analysis: Data Visualization of Airlines
Data Analysis: Data Visualization of Airlines Anderson Cruz | London-UK | Linkedin | Nowa Capital Project: Traffic Airlines Airline Reporting Carrier
Software for visualization of RTStruct structures on CT images
This script is responsible for the operation of the program, it is responsible for both creating the GUI and the process of processing images from dicom files. The program is based on the use of the PyQt5 library, on the basis of which the entire interface containing the appropriate buttons and functions was created.
1900-2016 Olympic Data Analysis in Python by plotting different graphs
🔥 Olympics Data Analysis 🔥 In Data Science field, there is a big topic before creating a model for future prediction is Data Analysis. We can find o

Collection of data visualizing projects through Tableau, Data Wrapper, and Power BI
Data-Visualization-Projects Collection of data visualizing projects through Tableau, Data Wrapper, and Power BI Indigenous-Brands-Social-Movements Pyt
Geospatial Data Visualization using PyGMT
Example script to visualize topographic data, earthquake data, and tomographic data on a map

Chem: collection of mostly python code for molecular visualization, QM/MM, FEP, etc
chem: collection of mostly python code for molecular visualization, QM/MM, FEP,
Proyecto - Análisis de texto de eventos históricos
Acceder al código desde Google Colab para poder ver de manera adecuada todas las visualizaciones y poder interactuar con ellas. Link de acceso: https:
Proyecto - Desgaste y rendimiento de empleados de IBM HR Analytics
Acceder al código desde Google Colab para poder ver de manera adecuada todas las visualizaciones y poder interactuar con ellas. Links de acceso: Noteb
The mitosheet package, trymito.io, and other public Mito code.
Mito Monorepo Mito is a spreadsheet that lives inside your JupyterLab notebooks. It allows you to edit Pandas dataframes like an Excel file, and gener

A web app builds using streamlit API with python backend to analyze and pick insides from multiple data formats.
Data-Analysis-Web-App Data Analysis Web App can analysis data in multiple formates(csv, txt, xls, xlsx, ods, odt) and gives shows you the analysis in

coldcuts is an R package to automatically generate and plot segmentation drawings in R
coldcuts coldcuts is an R package that allows you to draw and plot automatically segmentations from 3D voxel arrays. The name is inspired by one of It

A basic molecule viewer written in Python, using curses; Thus, meant for linux terminals
asciiMOL A basic molecule viewer written in Python, using curses; Thus, meant for linux terminals. This is an alpha version, featuring: Opening defaul
A classification model capable of accurately predicting the price of secondhand cars
The purpose of this project is create a classification model capable of accurately predicting the price of secondhand cars. The data used for model building is open source and has been added to this repository. Most packages used are usually pre-installed in most developed environments and tools like collab, jupyter, etc. This can be useful for people looking to enhance the way the code their predicitve models and efficient ways to deal with tabular data!
Title: Graduate-Admissions-Predictor
The purpose of this project is create a predictive model capable of identifying the probability of a person securing an admit based on their personal profile parameters. Simplified visualisations have been created for understanding the data. 80% accuracy was achieved on the test set.

Audio Source Separation is the process of separating a mixture into isolated sounds from individual sources
Audio Source Separation is the process of separating a mixture into isolated sounds from individual sources (e.g. just the lead vocals).

Boltzmann visualization - Visualize the Boltzmann distribution for simple quantum models of molecular motion
Boltzmann visualization - Visualize the Boltzmann distribution for simple quantum models of molecular motion
Implement the Perspective open source code in preparation for data visualization
Task Overview | Installation Instructions | Link to Module 2 Introduction Experience Technology at JP Morgan Chase Try out what real work is like in t
A web-based visualization and debugging platform for NuPIC
Cerebro 2 A web-based visualization and debugging platform for NuPIC. Usage Set up cerebro2.server to export your model state. Then, run: cd static py

Create charts with Python in a very similar way to creating charts using Chart.js
Create charts with Python in a very similar way to creating charts using Chart.js. The charts created are fully configurable, interactive and modular and are displayed directly in the output of the the cells of your jupyter notebook environment.

visualize_ML is a python package made to visualize some of the steps involved while dealing with a Machine Learning problem
visualize_ML visualize_ML is a python package made to visualize some of the steps involved while dealing with a Machine Learning problem. It is build
TensorDebugger (TDB) is a visual debugger for deep learning. It extends TensorFlow with breakpoints + real-time visualization of the data flowing through the computational graph
TensorDebugger (TDB) is a visual debugger for deep learning. It extends TensorFlow (Google's Deep Learning framework) with breakpoints + real-time visualization of the data flowing through the computational graph.
Python Sreamlit Duplicate Records Finder Remover
Python-Sreamlit-Duplicate-Records-Finder-Remover Streamlit is an open-source Python library that makes it easy to create and share beautiful, custom w

This project is an Algorithm Visualizer where a user can visualize algorithms like Bubble Sort, Merge Sort, Quick Sort, Selection Sort, Linear Search and Binary Search.
Algo_Visualizer This project is an Algorithm Visualizer where a user can visualize common algorithms like "Bubble Sort", "Merge Sort", "Quick Sort", "
Exploring the Top ML and DL GitHub Repositories
This repository contains my work related to my project where I scraped data on the most popular machine learning and deep learning GitHub repositories in order to further visualize and analyze it.

Minimalistic tool to visualize how the routes to a given target domain change over time, feat. Python 3.10 & mermaid.js
Minimalistic tool to visualize how the routes to a given target domain change over time, feat. Python 3.10 & mermaid.js

🔎 Monitor deep learning model training and hardware usage from your mobile phone 📱
Monitor deep learning model training and hardware usage from mobile. 🔥 Features Monitor running experiments from mobile phone (or laptop) Monitor har
A visualization of how much Manchester United fans enjoyed each game from the first half of the 21/22 Premier League season.
Man-Utd-Fan-Satisfaction-Levels-First-19-games A visualization of how much Manchester United fans enjoyed each game from the first half of the 21/22 P

Visualization Website by using Dash and Heroku
Visualization Website by using Dash and Heroku You can visit the website https://payroll-expense-analysis.herokuapp.com/ In this project, I am interes
100 Days of Code The Complete Python Pro Bootcamp for 2022
100-Day-With-Python 100 Days of Code - The Complete Python Pro Bootcamp for 2022. In this course, I spend with python language over 100 days, and I up
Python data processing, analysis, visualization, and data operations
Python This is a Python data processing, analysis, visualization and data operations of the source code warehouse, book ISBN: 9787115527592 Descriptio

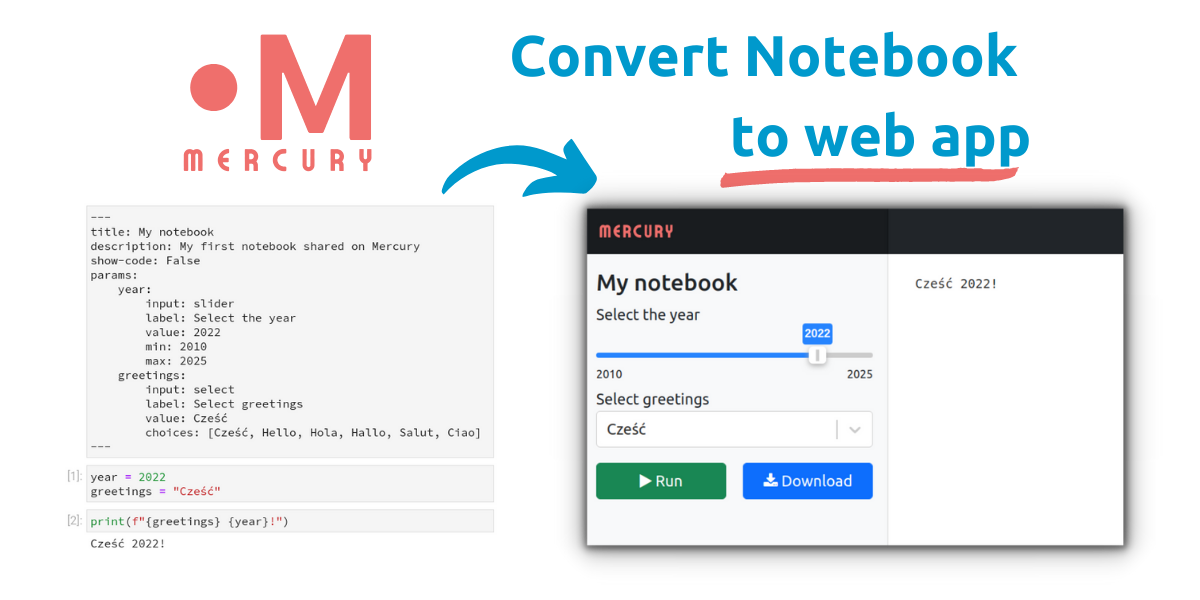
Mercury: easily convert Python notebook to web app and share with others
Mercury Share your Python notebooks with others Easily convert your Python notebooks into interactive web apps by adding parameters in YAML. Simply ad
Sorting-Algorithms - All information about sorting algorithm you need and you can visualize the code tracer
Sorting-Algorithms - All information about sorting algorithm you need and you can visualize the code tracer

An awesome Data Science repository to learn and apply for real world problems.
AWESOME DATA SCIENCE An open source Data Science repository to learn and apply towards solving real world problems. This is a shortcut path to start s
This project consists of data analysis and data visualization (done using python)of all IPL seasons from 2008 to 2019 and answering the most asked questions about the IPL.
IPL-data-analysis This project consists of data analysis and data visualization of all IPL seasons from 2008 to 2019 and answering the most asked ques
Credit EDA Case Study Using Python
This case study aims to identify patterns which indicate if a client has difficulty paying their installments which may be used for taking actions such as denying the loan, reducing the amount of loan, lending (to risky applicants) at a higher interest rate, etc

Using the provided dataset which includes various book features, in order to predict the price of books, using various proposed methods and models.
Using the provided dataset which includes various book features, in order to predict the price of books, using various proposed methods and models.
The repository is my code for various types of data visualization cases based on the Matplotlib library.
ScienceGallery The repository is my code for various types of data visualization cases based on the Matplotlib library. It summarizes the code and cas
Semi-Automated Data Processing
Perform semi automated exploratory data analysis, feature engineering and feature selection on provided dataset by visualizing every possibilities on each step and assisting the user to make a meaningful decision to achieve a low-bias and low-variance model.
Exploratory Data Analysis of the 2019 Indian General Elections using a dataset from Kaggle.
2019-indian-election-eda Exploratory Data Analysis of the 2019 Indian General Elections using a dataset from Kaggle. This project is a part of the Cou
Active Transport Analytics Model: A new strategic transport modelling and data visualization framework
{ATAM} Active Transport Analytics Model Active Transport Analytics Model (“ATAM”
Active Transport Analytics Model (ATAM) is a new strategic transport modelling and data visualization framework for Active Transport as well as emerging micro-mobility modes
{ATAM} Active Transport Analytics Model Active Transport Analytics Model (“ATAM”) is a new strategic transport modelling and data visualization framew
D-Analyst : High Performance Visualization Tool
D-Analyst : High Performance Visualization Tool D-Analyst is a high performance data visualization built with python and based on OpenGL. It allows to

FURY - A software library for scientific visualization in Python
Free Unified Rendering in Python A software library for scientific visualization in Python. General Information • Key Features • Installation • How to

Visualization of hidden layer activations of small multilayer perceptrons (MLPs)
MLP Hidden Layer Activation Visualization To gain some intuition about the internal representation of simple multi-layer perceptrons (MLPs) I trained

This is a super simple visualization toolbox (script) for transformer attention visualization ✌
Trans_attention_vis This is a super simple visualization toolbox (script) for transformer attention visualization ✌ 1. How to prepare your attention m

A simple flask application to collect annotations for the Turing Change Point Dataset, a benchmark dataset for change point detection algorithms
AnnotateChange Welcome to the repository of the "AnnotateChange" application. This application was created to collect annotations of time series data
Medical appointments No-Show classifier
Medical Appointments No-shows Why do 20% of patients miss their scheduled appointments? A person makes a doctor appointment, receives all the instruct

Full-Stack application that visualizes amusement park safety.
Amusement Park Ride Safety Analysis Project Proposal We have chosen to look into amusement park data to explore ride safety relationships visually, in

A simple wrapper to analyse and visualise reinforcement learning agents' behaviour in the environment.
Visrl Visrl (pronounced "visceral") is a simple wrapper to analyse and visualise reinforcement learning agents' behaviour in the environment. Reinforc

A python visualization of the A* path finding algorithm
A python visualization of the A* path finding algorithm. It allows you to pick your start, end location and make obstacles and then view the process of finding the shortest path. You can also choose to include or exclude diagonal movement.
General Assembly's 2015 Data Science course in Washington, DC
DAT8 Course Repository Course materials for General Assembly's Data Science course in Washington, DC (8/18/15 - 10/29/15). Instructor: Kevin Markham (
MNE: Magnetoencephalography (MEG) and Electroencephalography (EEG) in Python
MNE-Python MNE-Python software is an open-source Python package for exploring, visualizing, and analyzing human neurophysiological data such as MEG, E

PyExplainer: A Local Rule-Based Model-Agnostic Technique (Explainable AI)
PyExplainer PyExplainer is a local rule-based model-agnostic technique for generating explanations (i.e., why a commit is predicted as defective) of J

PyMove is a Python library to simplify queries and visualization of trajectories and other spatial-temporal data
Use PyMove and go much further Information Package Status License Python Version Platforms Build Status PyPi version PyPi Downloads Conda version Cond

Easy genetic ancestry predictions in Python
ezancestry Easily visualize your direct-to-consumer genetics next to 2500+ samples from the 1000 genomes project. Evaluate the performance of a custom

JupyterHub extension for ContainDS Dashboards
ContainDS Dashboards for JupyterHub A Dashboard publishing solution for Data Science teams to share results with decision makers. Run a private on-pre

Streamlit Component for rendering Folium maps
streamlit-folium This Streamlit Component is a work-in-progress to determine what functionality is desirable for a Folium and Streamlit integration. C
Peloton Stats to Google Sheets with Data Visualization through Seaborn and Plotly
Peloton Stats to Google Sheets with Data Visualization through Seaborn and Plotly Problem: 2 peloton users were looking for a way to track their metri
Data-science-on-gcp - Source code accompanying book: Data Science on the Google Cloud Platform, Valliappa Lakshmanan, O'Reilly 2017
data-science-on-gcp Source code accompanying book: Data Science on the Google Cloud Platform, 2nd Edition Valliappa Lakshmanan O'Reilly, Jan 2022 Bran

Lolviz - A simple Python data-structure visualization tool for lists of lists, lists, dictionaries; primarily for use in Jupyter notebooks / presentations
lolviz By Terence Parr. See Explained.ai for more stuff. A very nice looking javascript lolviz port with improvements by Adnan M.Sagar. A simple Pytho
Kaggle-titanic - A tutorial for Kaggle's Titanic: Machine Learning from Disaster competition. Demonstrates basic data munging, analysis, and visualization techniques. Shows examples of supervised machine learning techniques.
Kaggle-titanic This is a tutorial in an IPython Notebook for the Kaggle competition, Titanic Machine Learning From Disaster. The goal of this reposito
Notebooks for computing approximations to the prime counting function using Riemann's formula.
Notebooks for computing approximations to the prime counting function using Riemann's formula.

Advanced_Data_Visualization_Tools - The present hands-on lab mainly uses Immigration to Canada dataset and employs advanced visualization tools such as word cloud, and waffle plot to display relations between features within the dataset.
Hands-on Practice Learning Lab for Data Science Overview This hands on practice lab is a part of Data Visualization with Python course offered by Cour

Optimizers-visualized - Visualization of different optimizers on local minimas and saddle points.
Optimizers Visualized Visualization of how different optimizers handle mathematical functions for optimization. Contents Installation Usage Functions

Team nan solution repository for FPT data-centric competition. Data augmentation, Albumentation, Mosaic, Visualization, KNN application
FPT_data_centric_competition - Team nan solution repository for FPT data-centric competition. Data augmentation, Albumentation, Mosaic, Visualization, KNN application
View model summaries in PyTorch!
torchinfo (formerly torch-summary) Torchinfo provides information complementary to what is provided by print(your_model) in PyTorch, similar to Tensor
Ecco is a python library for exploring and explaining Natural Language Processing models using interactive visualizations.
Visualize, analyze, and explore NLP language models. Ecco creates interactive visualizations directly in Jupyter notebooks explaining the behavior of Transformer-based language models (like GPT2, BERT, RoBERTA, T5, and T0).
Datapane is the easiest way to create data science reports from Python.
Datapane Teams | Documentation | API Docs | Changelog | Twitter | Blog Share interactive plots and data in 3 lines of Python. Datapane is a Python lib
Calculate & view the trajectory and live position of any earth-orbiting satellite
satellite-visualization A cross-platform application to calculate & view the trajectory and live position of any earth-orbiting satellite in 3D. This