Filter By
527 Repositories
Python Data Visualization
100 Days of Code The Complete Python Pro Bootcamp for 2022
100-Day-With-Python 100 Days of Code - The Complete Python Pro Bootcamp for 2022. In this course, I spend with python language over 100 days, and I up
 8 Jun 22, 2022
Python & Julia port of codes in excellent R books
X4DS This repo is a collection of Python & Julia port of codes in the following excellent R books: An Introduction to Statistical Learning (ISLR) Stat
 5 Jun 21, 2022

Sky attention heatmap of submissions to astrometry.net
astroheat Installation Requires Python 3.6+, Tested with Python 3.9.5 Install library dependencies pip install -r requirements.txt The program require
 4 Jun 20, 2022

Splore - a simple graphical interface for scrolling through and exploring data sets of molecules
Scroll through and exPLORE molecule sets The splore framework aims to offer a si
 3 Jun 18, 2022

Python scripts for plotting audiograms and related data from Interacoustics Equinox audiometer and Otoaccess software.
audiometry Python scripts for plotting audiograms and related data from Interacoustics Equinox 2.0 audiometer and Otoaccess software. Maybe similar sc
 2 Jun 15, 2022
A Python function that makes flower plots.
Flower plot A Python 3.9+ function that makes flower plots. Installation This package requires at least Python 3.9. pip install
 4 Jun 12, 2022

Parse Robinhood 1099 Tax Document from PDF into CSV
Robinhood 1099 Parser This project converts Robinhood Securities 1099 tax document from PDF to CSV file. This tool will be helpful for those who need
 52 Jun 10, 2022

Collection of scripts for making high quality beautiful math-related posters.
Poster Collection of scripts for making high quality beautiful math-related posters. The poster can have as large printing size as 3x2 square feet wit
 3 Jun 9, 2022
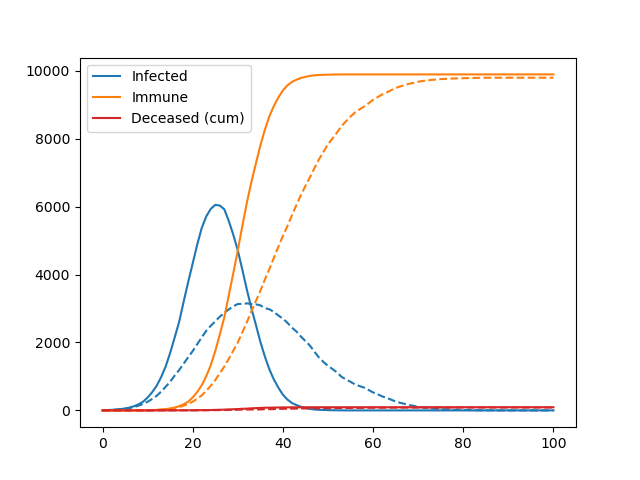
A simple agent-based model used to teach the basics of OOP in my lectures
Pydemic A simple agent-based model of a pandemic. This is used to teach basic principles of object-oriented programming to master students. It is not
 2 Jun 8, 2022
Sci palettes for matplotlib/seaborn
sci palettes for matplotlib/seaborn Installation python3 -m pip install sci-palettes Usage import seaborn as sns import matplotlib.pyplot as plt impor
 2 Jun 7, 2022
Automatically generate GitHub activity!
Commit Bot Automatically generate GitHub activity! We've all wanted to be the developer that commits every day, but that requires a lot of work. Let's
 4 Jun 7, 2022
.jpg)
Keir&'s Visualizing Data on Life Expectancy
Keir's Visualizing Data on Life Expectancy Below is information on life expectancy in the United States from 1900-2017. You will also find information
 9 Jun 6, 2022
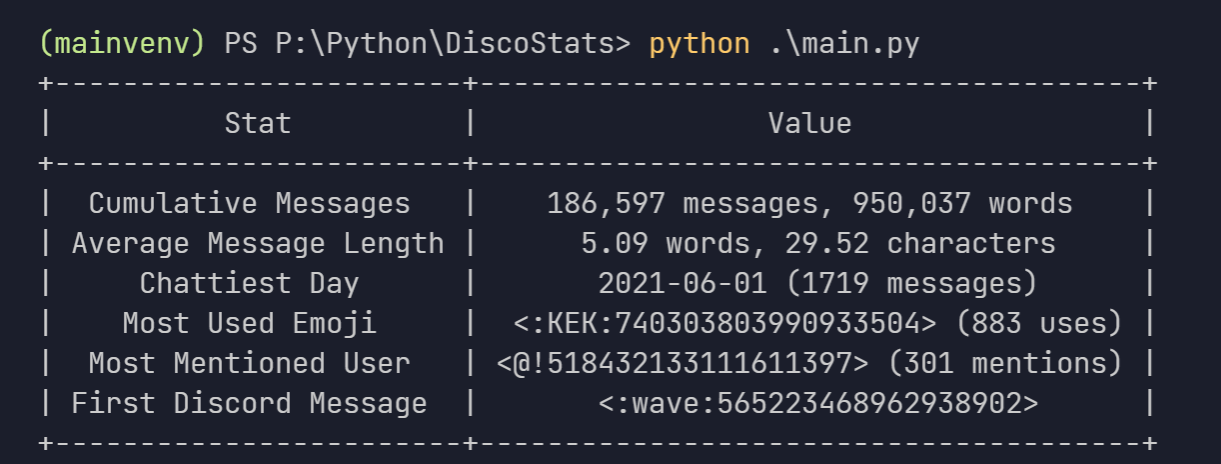
view cool stats related to your discord account.
DiscoStats cool statistics generated using your discord data. How? DiscoStats is not a service that breaks the Discord Terms of Service or Community G
 5 Jun 2, 2022

Make scripted visualizations in blender
Scripted visualizations in blender The goal of this project is to script 3D scientific visualizations using blender. To achieve this, we aim to bring
 10 Jun 1, 2022

Python script for writing text on github contribution chart.
Github Contribution Drawer Python script for writing text on github contribution chart. Requirements Python 3.X Getting Started Create repository Put
 0 May 27, 2022

Simple CLI python app to show a stocks graph performance. Made with Matplotlib and Tiingo.
stock-graph-python Simple CLI python app to show a stocks graph performance. Made with Matplotlib and Tiingo. Tiingo API Key You will need to add your
 3 May 14, 2022

Monochromatic colorscheme for matplotlib with opinionated sensible default
Monochromatic colorscheme for matplotlib with opinionated sensible default If you need a simple monochromatic colorscheme for your matplotlib figures,
 2 May 6, 2022
Frbmclust - Clusterize FRB profiles using hierarchical clustering, plot corresponding parameters distributions
frbmclust Getting Started Clusterize FRB profiles using hierarchical clustering,
 3 May 6, 2022

Matplotlib JOTA style for making figures
Matplotlib JOTA style for making figures This repo has Matplotlib JOTA style to format plots and figures for publications and presentation.
 2 May 5, 2022

Visualizations of linear algebra algorithms for people who want a deep understanding
Visualising algorithms on symmetric matrices Examples QR algorithm and LR algorithm Here, we have a GIF animation of an interactive visualisation of t
 3 May 5, 2022
The Metabolomics Integrator (MINT) is a post-processing tool for liquid chromatography-mass spectrometry (LCMS) based metabolomics.
MINT (Metabolomics Integrator) The Metabolomics Integrator (MINT) is a post-processing tool for liquid chromatography-mass spectrometry (LCMS) based m
 0 May 4, 2022

Numerical methods for ordinary differential equations: Euler, Improved Euler, Runge-Kutta.
Numerical methods Numerical methods for ordinary differential equations are methods used to find numerical approximations to the solutions of ordinary
 5 Apr 29, 2022

This is a small program that prints a user friendly, visual representation, of your current bsp tree
bspcq, q for query A bspc analyzer (utility for bspwm) This is a small program that prints a user friendly, visual representation, of your current bsp
 9 Apr 24, 2022
D-Analyst : High Performance Visualization Tool
D-Analyst : High Performance Visualization Tool D-Analyst is a high performance data visualization built with python and based on OpenGL. It allows to
 4 Apr 14, 2022
Visualize your pandas data with one-line code
PandasEcharts 简介 基于pandas和pyecharts的可视化工具 安装 pip 安装 $ pip install pandasecharts 源码安装 $ git clone https://github.com/gamersover/pandasecharts $ cd pand
 2 Apr 13, 2022
WebApp served by OAK PoE device to visualize various streams, metadata and AI results
DepthAI PoE WebApp | Bootstrap 4 & Vue.js SPA Dashboard Based on dashmin (https:
 6 Apr 9, 2022

Color maps for POV-Ray v3.7 from the Plasma, Inferno, Magma and Viridis color maps in Python's Matplotlib
POV-Ray-color-maps Color maps for POV-Ray v3.7 from the Plasma, Inferno, Magma and Viridis color maps in Python's Matplotlib. The include file Color_M
 1 Apr 5, 2022

GitHub Stats Visualizations : Transparent
GitHub Stats Visualizations : Transparent Generate visualizations of GitHub user and repository statistics using GitHub Actions. ⚠️ Disclaimer The pro
 7 Apr 5, 2022
coordinate to draw the nimbus logo on the graffitiwall
This is a community effort to draw the nimbus logo on beaconcha.in's graffitiwall. get started clone repo with git clone https://github.com/tennisbowl
 4 Apr 4, 2022

OpenStats is a library built on top of streamlit that extracts data from the Github API and shows the main KPIs
Open Stats Discover and share the KPIs of your OpenSource project. OpenStats is a library built on top of streamlit that extracts data from the Github
 4 Apr 3, 2022
A minimalistic wrapper around PyOpenGL to save development time
glpy glpy is pyOpenGl wrapper which lets you work with pyOpenGl easily.It is not meant to be a replacement for pyOpenGl but runs on top of pyOpenGl to
 9 Apr 2, 2022
Some examples with MatPlotLib library in Python
MatPlotLib Example Some examples with MatPlotLib library in Python Point: Run files only in project's directory About me Full name: Matin Ardestani Ag
 4 Mar 29, 2022

Create a visualization for Trump's Tweeted Words Using Python
Data Trump's Tweeted Words This plot illustrates twitter word occurences. We already did the coding I needed for this plot, so I was very inspired to
 7 Mar 27, 2022
This repository contains a streaming Dataflow pipeline written in Python with Apache Beam, reading data from PubSub.
Sample streaming Dataflow pipeline written in Python This repository contains a streaming Dataflow pipeline written in Python with Apache Beam, readin
 9 Mar 18, 2022
Piglet-shaders - PoC of custom shaders for Piglet
Piglet custom shader PoC This is a PoC for compiling Piglet fragment shaders usi
 6 Mar 10, 2022

Generate the report for OCULTest.
Sample report generated in this function Usage example from utils.gen_report import generate_report if __name__ == '__main__': # def generate_rep
 1 Mar 10, 2022

Visualize the training curve from the *.csv file (tensorboard format).
Training-Curve-Vis Visualize the training curve from the *.csv file (tensorboard format). Feature Custom labels Curve smoothing Support for multiple c
 7 Feb 23, 2022

NorthPitch is a python soccer plotting library that sits on top of Matplotlib
NorthPitch is a python soccer plotting library that sits on top of Matplotlib.
 30 Feb 22, 2022

Simple function to plot multiple barplots in the same figure.
Simple function to plot multiple barplots in the same figure. Supports padding and custom color.
 2 Feb 21, 2022
Bcc2telegraf: An integration that sends ebpf-based bcc histogram metrics to telegraf daemon
bcc2telegraf bcc2telegraf is an integration that sends ebpf-based bcc histogram
 2 Feb 17, 2022

Movies-chart - A CLI app gets the top 250 movies of all time from imdb.com and the top 100 movies from rottentomatoes.com
movies-chart This CLI app gets the top 250 movies of all time from imdb.com and
 3 Feb 17, 2022

Tweets your monthly GitHub Contributions as Wordle grid
Tweets your monthly GitHub Contributions as Wordle grid
 5 Feb 16, 2022
Mathematical learnings with Lean, for those of us who wish we knew more of both!
Lean for the Inept Mathematician This repository contains source files for a number of articles or posts aimed at explaining bite-sized mathematical c
 8 Feb 14, 2022

🐍PyNode Next allows you to easily create beautiful graph visualisations and animations
PyNode Next A complete rewrite of PyNode for the modern era. Up to five times faster than the original PyNode. PyNode Next allows you to easily create
 3 Feb 12, 2022

Simple implementation of Self Organizing Maps (SOMs) with rectangular and hexagonal grid topologies
py-self-organizing-map Simple implementation of Self Organizing Maps (SOMs) with rectangular and hexagonal grid topologies. A SOM is a simple unsuperv
 1 Feb 10, 2022
A Graph Learning library for Humans
A Graph Learning library for Humans These novel algorithms include but are not limited to: A graph construction and graph searching class can be found
 1 Feb 8, 2022
A Python-based non-fungible token (NFT) generator built using Samilla and Matplotlib
PyNFT A Pythonic NF (non-fungible token) generator built using Samilla and Matplotlib Use python pynft.py [amount] The intention behind this generato
 6 Feb 7, 2022
Automatization of BoxPlot graph usin Python MatPlotLib and Excel
BoxPlotGraphAutomation Automatization of BoxPlot graph usin Python / Excel. This file is an automation of BoxPlot-Graph using python graph library mat
 1 Feb 7, 2022

Visualise top-rated GitHub repositories in a barchart by keyword
This python script was written for simple purpose -- to visualise top-rated GitHub repositories in a barchart by keyword. Script generates html-page with barchart and information about repository owner, description, create date and update date.
 2 Feb 7, 2022

This project is an Algorithm Visualizer where a user can visualize algorithms like Bubble Sort, Merge Sort, Quick Sort, Selection Sort, Linear Search and Binary Search.
Algo_Visualizer This project is an Algorithm Visualizer where a user can visualize common algorithms like "Bubble Sort", "Merge Sort", "Quick Sort", "
 4 Feb 7, 2022

Collection of data visualizing projects through Tableau, Data Wrapper, and Power BI
Data-Visualization-Projects Collection of data visualizing projects through Tableau, Data Wrapper, and Power BI Indigenous-Brands-Social-Movements Pyt
 1 Feb 5, 2022
Bioinformatics tool for exploring RNA-Protein interactions
Explore RNA-Protein interactions. RNPFind is a bioinformatics tool. It takes an RNA transcript as input and gives a list of RNA binding protein (RBP)
 3 Jan 27, 2022
Implement the Perspective open source code in preparation for data visualization
Task Overview | Installation Instructions | Link to Module 2 Introduction Experience Technology at JP Morgan Chase Try out what real work is like in t
 1 Jan 23, 2022

Boltzmann visualization - Visualize the Boltzmann distribution for simple quantum models of molecular motion
Boltzmann visualization - Visualize the Boltzmann distribution for simple quantum models of molecular motion
 1 Jan 22, 2022