Filter By
527 Repositories
Python Data Visualization
Use Perspective to create the chart for the trader’s dashboard
Task Overview | Installation Instructions | Link to Module 3 Introduction Experience Technology at JP Morgan Chase Try out what real work is like in t
 1 Jan 22, 2022

PyPassword is a simple follow up to PyPassphrase
PyPassword PyPassword is a simple follow up to PyPassphrase. After finishing that project it occured to me that while some may wish to use that option
 2 Jan 22, 2022
Data aggregated from the reports found at the MCPS COVID Dashboard into a set of visualizations.
Montgomery County Public Schools COVID-19 Visualizer Contents About this project Data Support this project About this project Data All data we use can
 3 Jan 19, 2022

Minimalistic tool to visualize how the routes to a given target domain change over time, feat. Python 3.10 & mermaid.js
Minimalistic tool to visualize how the routes to a given target domain change over time, feat. Python 3.10 & mermaid.js
 1 Jan 17, 2022
Arras.io Highest Scores Over Time Bar Chart Race
Arras.io Highest Scores Over Time Bar Chart Race This repo contains a python script (make_racing_bar_chart.py) that can generate a csv file which can
 2 Jan 16, 2022

Visualization Website by using Dash and Heroku
Visualization Website by using Dash and Heroku You can visit the website https://payroll-expense-analysis.herokuapp.com/ In this project, I am interes
 1 Jan 14, 2022
Visualizations of some specific solutions of different differential equations.
Diff_sims Visualizations of some specific solutions of different differential equations. Heat Equation in 1 Dimension (A very beautiful and elegant ex
 2 Jan 13, 2022
Active Transport Analytics Model (ATAM) is a new strategic transport modelling and data visualization framework for Active Transport as well as emerging micro-mobility modes
{ATAM} Active Transport Analytics Model Active Transport Analytics Model (“ATAM”) is a new strategic transport modelling and data visualization framew
 0 Jan 12, 2022
Generate visualizations of GitHub user and repository statistics using GitHub Actions.
GitHub Stats Visualization Generate visualizations of GitHub user and repository statistics using GitHub Actions. This project is currently a work-in-
 1 Jan 11, 2022

I'm doing Genuary, an aritifiacilly generated month to build code that make beautiful things
Genuary 2022 I'm doing Genuary, an aritifiacilly generated month to build code that make beautiful things. Every day there is a new prompt for making
 1 Jan 10, 2022

Project coded in Python using Pandas to look at changes in chase% for batters facing a pitcher first time through the order vs. thrid time
Project coded in Python using Pandas to look at changes in chase% for batters facing a pitcher first time through the order vs. thrid time
 1 Jan 7, 2022

By default, networkx has problems with drawing self-loops in graphs.
By default, networkx has problems with drawing self-loops in graphs. It makes it hard to draw a graph with self-loops or to make a nicely looking chord diagram. This repository provides some code to draw self-loops nicely
 5 Jan 6, 2022

Visualization Data Drug in thailand during 2014 to 2020
Visualization Data Drug in thailand during 2014 to 2020 Data sorce from ข้อมูลเปิดภาครัฐ สำนักงาน ป.ป.ส Inttroducing program Using tkinter module for
 1 Jan 5, 2022
GD-UltraHack - A Mod Menu for Geometry Dash. Specifically a MegahackV5 clone in Python. Only for Windows
GD UltraHack: The Mod Menu that Nobody asked for. This is a mod menu for the gam
 1 Jan 5, 2022

Advanced_Data_Visualization_Tools - The present hands-on lab mainly uses Immigration to Canada dataset and employs advanced visualization tools such as word cloud, and waffle plot to display relations between features within the dataset.
Hands-on Practice Learning Lab for Data Science Overview This hands on practice lab is a part of Data Visualization with Python course offered by Cour
 1 Jan 5, 2022

Generate knowledge graphs with interesting geometries, like lattices
Geometric Graphs Generate knowledge graphs with interesting geometries, like lattices. Works on Python 3.9+ because it uses cool new features. Get out
 5 Jan 3, 2022

Function Plotter: a simple application with GUI to plot mathematical functions
Function-Plotter Function Plotter is a simple application with GUI to plot mathe
 4 Jan 3, 2022
DataVisualization - The evolution of my arduino and python journey. New level of competence achieved
DataVisualization - The evolution of my arduino and python journey. New level of competence achieved
 1 Jan 3, 2022

Wikipedia WordCloud App generate Wikipedia word cloud art created using python's streamlit, matplotlib, wikipedia and wordcloud packages
Wikipedia WordCloud App Wikipedia WordCloud App generate Wikipedia word cloud art created using python's streamlit, matplotlib, wikipedia and wordclou
 5 Jan 2, 2022

This is a small repository for me to implement my simply Data Visualisation skills through Python.
Data Visualisations This is a small repository for me to implement my simply Data Visualisation skills through Python. Steam Population Chart from 10/
 9 Dec 31, 2021
Using SQLite within Python to create database and analyze Starcraft 2 units data (Pandas also used)
SQLite python Starcraft 2 English This project shows the usage of SQLite with python. To create, modify and communicate with the SQLite database from
 1 Dec 30, 2021

A small script written in Python3 that generates a visual representation of the Mandelbrot set.
Mandelbrot Set Generator A small script written in Python3 that generates a visual representation of the Mandelbrot set. Abstract The colors in the ou
 1 Dec 28, 2021

Analysis and plotting for motor/prop/ESC characterization, thrust vs RPM and torque vs thrust
esc_test This is a Python package used to plot and analyze data collected for the purpose of characterizing a particular propeller, motor, and ESC con
 1 Dec 28, 2021

This is my favourite function - the Rastrigin function.
This is my favourite function - the Rastrigin function. What sparked my curiosity and interest in the function was its complexity in terms of many local optimum points, which makes it particularly interesting and useful for testing any optimisation algorithms.
 1 Dec 27, 2021

A simple interpreted language for creating basic mathematical graphs.
graphr Introduction graphr is a small language written to create basic mathematical graphs. It is an interpreted language written in python and essent
 2 Dec 26, 2021

A toolkit to generate MR sequence diagrams
mrsd: a toolkit to generate MR sequence diagrams mrsd is a Python toolkit to generate MR sequence diagrams, as shown below for the basic FLASH sequenc
 3 Dec 25, 2021
Runtime analysis of code with plotting
Runtime analysis of code with plotting A quick comparison among Python, Cython, and the C languages A Programming Assignment regarding the Programming
 2 Dec 24, 2021
Process dataframe in a easily way.
Popanda Written by Shengxuan Wang at OSU. Used for processing dataframe, especially for machine learning. The name is from "Po" in the movie Kung Fu P
 1 Dec 24, 2021
A tool for creating Toontown-style nametags in Panda3D
Toontown-Nametag Toontown-Nametag is a tool for creating Toontown Online/Toontown Rewritten-style nametags in Panda3D. It contains a function, createN
 2 Dec 23, 2021

Gesture controlled media player
Media Player Gesture Control Gesture controller for media player with MediaPipe, VLC and OpenCV. Contents About Setup About A tool for using gestures
 2 Dec 22, 2021
Graphical visualizer for spectralyze by Lauchmelder23
spectralyze visualizer Graphical visualizer for spectralyze by Lauchmelder23 Install Install matplotlib and ffmpeg. Put ffmpeg.exe in same folder as v
 1 Dec 21, 2021

Because trello only have payed options to generate a RunUp chart, this solves that!
Trello Runup Chart Generator The basic concept of the project is that Corello is pay-to-use and want to use Trello To-Do/Doing/Done automation with gi
 1 Dec 21, 2021

A custom qq-plot for two sample data comparision
QQ-Plot 2 Sample Just a gist to include the custom code to draw a qq-plot in python when dealing with a "two sample problem". This means when u try to
 1 Dec 20, 2021

An interactive dashboard built with python that enables you to visualise how rent prices differ across Sweden.
sweden-rent-dashboard An interactive dashboard built with python that enables you to visualise how rent prices differ across Sweden. The dashboard/web
 5 Dec 19, 2021
Tools for writing, submitting, debugging, and monitoring Storm topologies in pure Python
Petrel Tools for writing, submitting, debugging, and monitoring Storm topologies in pure Python. NOTE: The base Storm package provides storm.py, which
 247 Dec 18, 2021

Personal IMDB Graphs with Bokeh
Personal IMDB Graphs with Bokeh Do you like watching movies and also rate all of them in IMDB? Would you like to look at your IMDB stats based on your
 2 Dec 15, 2021
An automatic prover for tautologies in Metamath
completeness An automatic prover for tautologies in Metamath This program implements the constructive proof of the Completeness Theorem for propositio
 2 Dec 15, 2021

Exploratory analysis and data visualization of aircraft accidents and incidents in Brazil.
Exploring aircraft accidents in Brazil Occurrencies with aircraft in Brazil are investigated by the Center for Investigation and Prevention of Aircraf
 5 Dec 14, 2021
This is Pygrr PolyArt, a program used for drawing custom Polygon models for your Pygrr project!
This is Pygrr PolyArt, a program used for drawing custom Polygon models for your Pygrr project!
 4 Dec 14, 2021
ICS-Visualizer is an interactive Industrial Control Systems (ICS) network graph that contains up-to-date ICS metadata
ICS-Visualizer is an interactive Industrial Control Systems (ICS) network graph that contains up-to-date ICS metadata (Name, company, port, user manua
 2 Dec 13, 2021

A simple Monte Carlo simulation using Python and matplotlib library
Monte Carlo python simulation Install linux dependencies sudo apt update sudo apt install build-essential \ software-properties-commo
 2 Dec 13, 2021

A Simple Flask-Plotly Example for NTU 110-1 DSSI Class
A Simple Flask-Plotly Example for NTU 110-1 DSSI Class Live Demo Prerequisites We will use Flask and Ploty to build a Flask application. If you haven'
 1 Dec 11, 2021
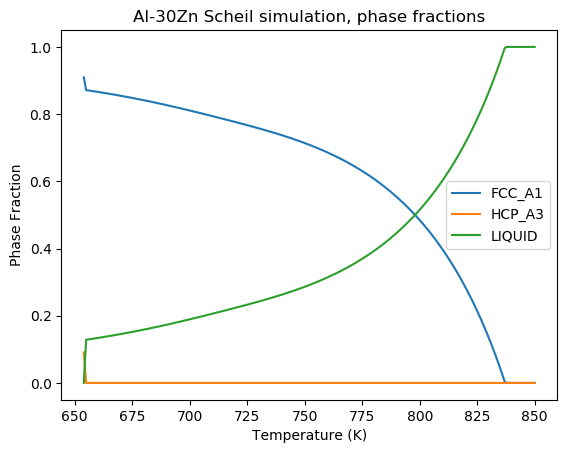
A Scheil-Gulliver simulation tool using pycalphad.
scheil A Scheil-Gulliver simulation tool using pycalphad. import matplotlib.pyplot as plt from pycalphad import Database, variables as v from scheil i
 6 Dec 10, 2021

Fast visualization of radar_scenes based on oleschum/radar_scenes
RadarScenes Tools About This python package provides fast visualization for the RadarScenes dataset. The Open GL based visualizer is smoother than ole
 2 Dec 9, 2021
Sprint planner considering JIRA issues and google calendar meetings schedule.
Sprint planner Sprint planner is a Python script for planning your Jira tasks based on your calendar availability. Installation Use the package manage
 2 Dec 5, 2021

A program that analyzes data from inertia measurement units installed in aircraft and generates g-exceedance curves.
A program that analyzes data from inertia measurement units installed in aircraft and generates g-exceedance curves.
 1 Dec 2, 2021

Some problems of SSLC ( High School ) before outputs and after outputs
Some problems of SSLC ( High School ) before outputs and after outputs 1] A Python program and its output (output1) while running the program is given
 3 Dec 1, 2021
Generate "Jupiter" plots for circular genomes
jupiter Generate "Jupiter" plots for circular genomes Description Python scripts to generate plots from ViennaRNA output. Written in "pidgin" python w
 2 Nov 29, 2021

A small collection of tools made by me, that you can use to visualize atomic orbitals in both 2D and 3D in different aspects.
Orbitals in Python A small collection of tools made by me, that you can use to visualize atomic orbitals in both 2D and 3D in different aspects, and o
 1 Nov 25, 2021
Cryptocurrency Centralized Exchange Visualization
This is a simple one that uses Grafina to visualize cryptocurrency from the Bitkub exchange. This service will make a request to the Bitkub API from your wallet and save the response to Postgresql. Grafina will retrieve data from Postgresql and display the graph.
 1 Nov 24, 2021

Info for The Great DataTas plot-a-thon
The Great DataTas plot-a-thon Datatas is organising a Data Visualisation competition: The Great DataTas plot-a-thon We will be using Tidy Tuesday data
 2 Nov 21, 2021
kyle's vision of how datadog's python client should look
kyle's datadog python vision/proposal not for production use See examples/comprehensive.py for a mostly working example of the proposed API. 📈 🐶 ❤️
 2 Nov 21, 2021

It's an application to calculate I from v and r. It can also plot a graph between V vs I.
Ohm-s-Law-Visualizer It's an application to calculate I from v and r using Ohm's Law. It can also plot a graph between V vs I. Story I'm doing my Unde
 1 Nov 20, 2021

Some method of processing point cloud
Point-Cloud Some method of processing point cloud inversion the completion pointcloud to incomplete point cloud Some model of encoding point cloud to
 1 Nov 19, 2021