253 Repositories
Python interactive-visualizations Libraries

Seaborn is one of the go-to tools for statistical data visualization in python. It has been actively developed since 2012 and in July 2018, the author released version 0.9. This version of Seaborn has several new plotting features, API changes and documentation updates which combine to enhance an already great library. This article will walk through a few of the highlights and show how to use the new scatter and line plot functions for quickly creating very useful visualizations of data.
12_Python_Seaborn_Module Introduction 👋 From the website, “Seaborn is a Python data visualization library based on matplotlib. It provides a high-lev
Get started learning C# with C# notebooks powered by .NET Interactive and VS Code.
.NET Interactive Notebooks for C# Welcome to the home of .NET interactive notebooks for C#! How to Install Download the .NET Coding Pack for VS Code f
A python library to artfully visualize Factorio Blueprints and an interactive web demo for using it.
Factorio Blueprint Visualizer I love the game Factorio and I really like the look of factories after growing for many hours or blueprints after tweaki
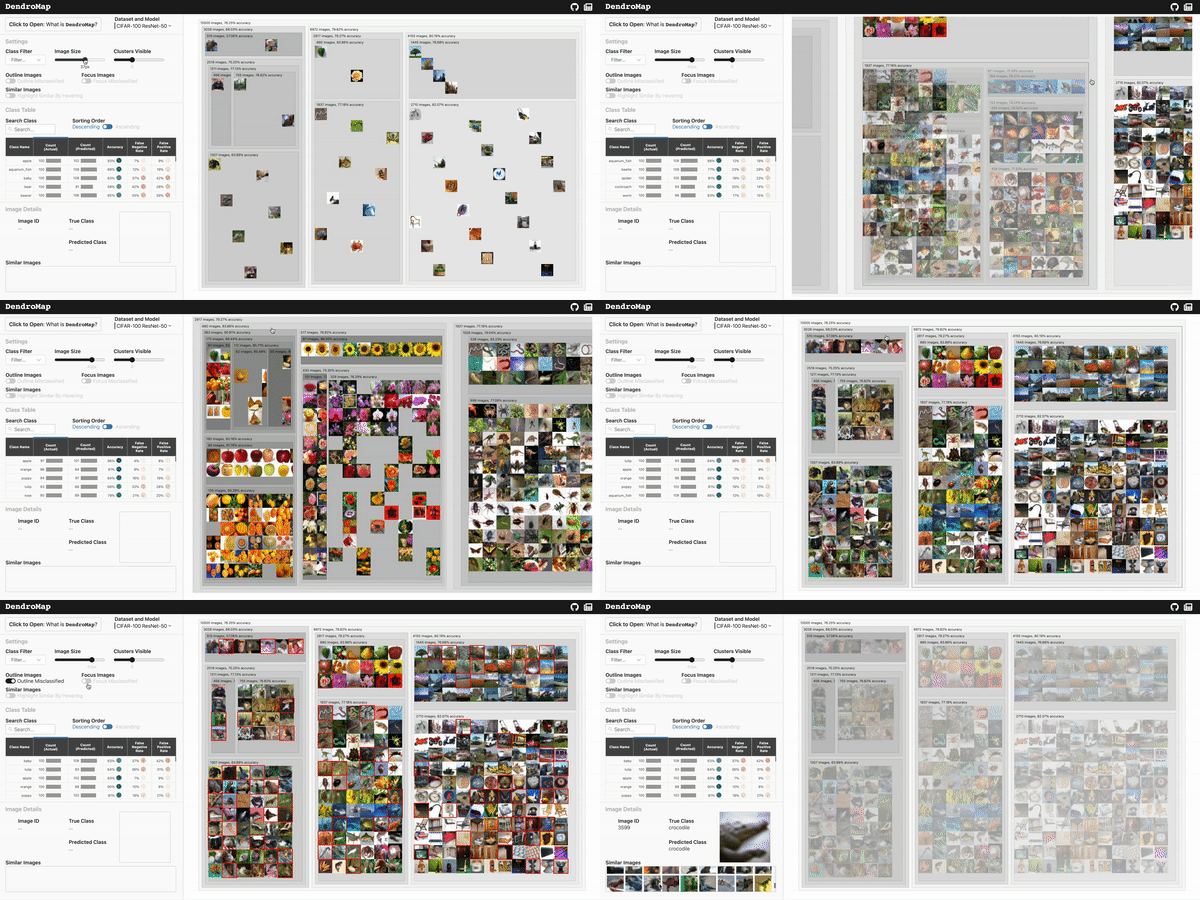
This repository contains the DendroMap implementation for scalable and interactive exploration of image datasets in machine learning.
DendroMap DendroMap is an interactive tool to explore large-scale image datasets used for machine learning. A deep understanding of your data can be v

Data Visualizations for the #30DayChartChallenge
The #30DayChartChallenge This repository contains all the charts made for the #30DayChartChallenge during the month of April. This project aims to exp

Easily pull telemetry data and create beautiful visualizations for analysis.
This repository is a work in progress. Anything and everything is subject to change. Porpo Table of Contents Porpo Table of Contents General Informati
Interactive class notebooks for ECE4076 Computer Vision, weeks 1 - 6
ECE4076 Interactive class notebooks for ECE4076 Computer Vision, weeks 1 - 6. ECE4076 is a computer vision unit at Monash University, covering both cl

ManimML is a project focused on providing animations and visualizations of common machine learning concepts with the Manim Community Library.
ManimML ManimML is a project focused on providing animations and visualizations of common machine learning concepts with the Manim Community Library.

A workshop on data visualization in Python with notebooks and exercises for following along.
Beyond the Basics: Data Visualization in Python The human brain excels at finding patterns in visual representations, which is why data visualizations

Create matplotlib visualizations from the command-line
MatplotCLI Create matplotlib visualizations from the command-line MatplotCLI is a simple utility to quickly create plots from the command-line, levera

Update your Nintendo Switch cheats with one click, or a bit more~
Interactive-ASM-Cheats-Updater This updater unlocks your ability of updating most of the ASM cheats for Nintendo Switch. Table of Contents Functions Q

The official code of LM-Debugger, an interactive tool for inspection and intervention in transformer-based language models.
LM-Debugger is an open-source interactive tool for inspection and intervention in transformer-based language models. This repository includes the code

Covid19-Forecasting - An interactive website that tracks, models and predicts COVID-19 Cases
Covid-Tracker This is an interactive website that tracks, models and predicts CO

The LaTeX and Python code for generating the paper, experiments' results and visualizations reported in each paper is available (whenever possible) in the paper's directory
This repository contains the software implementation of most algorithms used or developed in my research. The LaTeX and Python code for generating the

A slightly opinionated template for iPython configuration for interactive development
A slightly opinionated template for iPython configuration for interactive development. Auto-reload and no imports for packages and modules in the project.

An interactive document scanner built in Python using OpenCV
The scanner takes a poorly scanned image, finds the corners of the document, applies the perspective transformation to get a top-down view of the document, sharpens the image, and applies an adaptive color threshold to clean up the image.
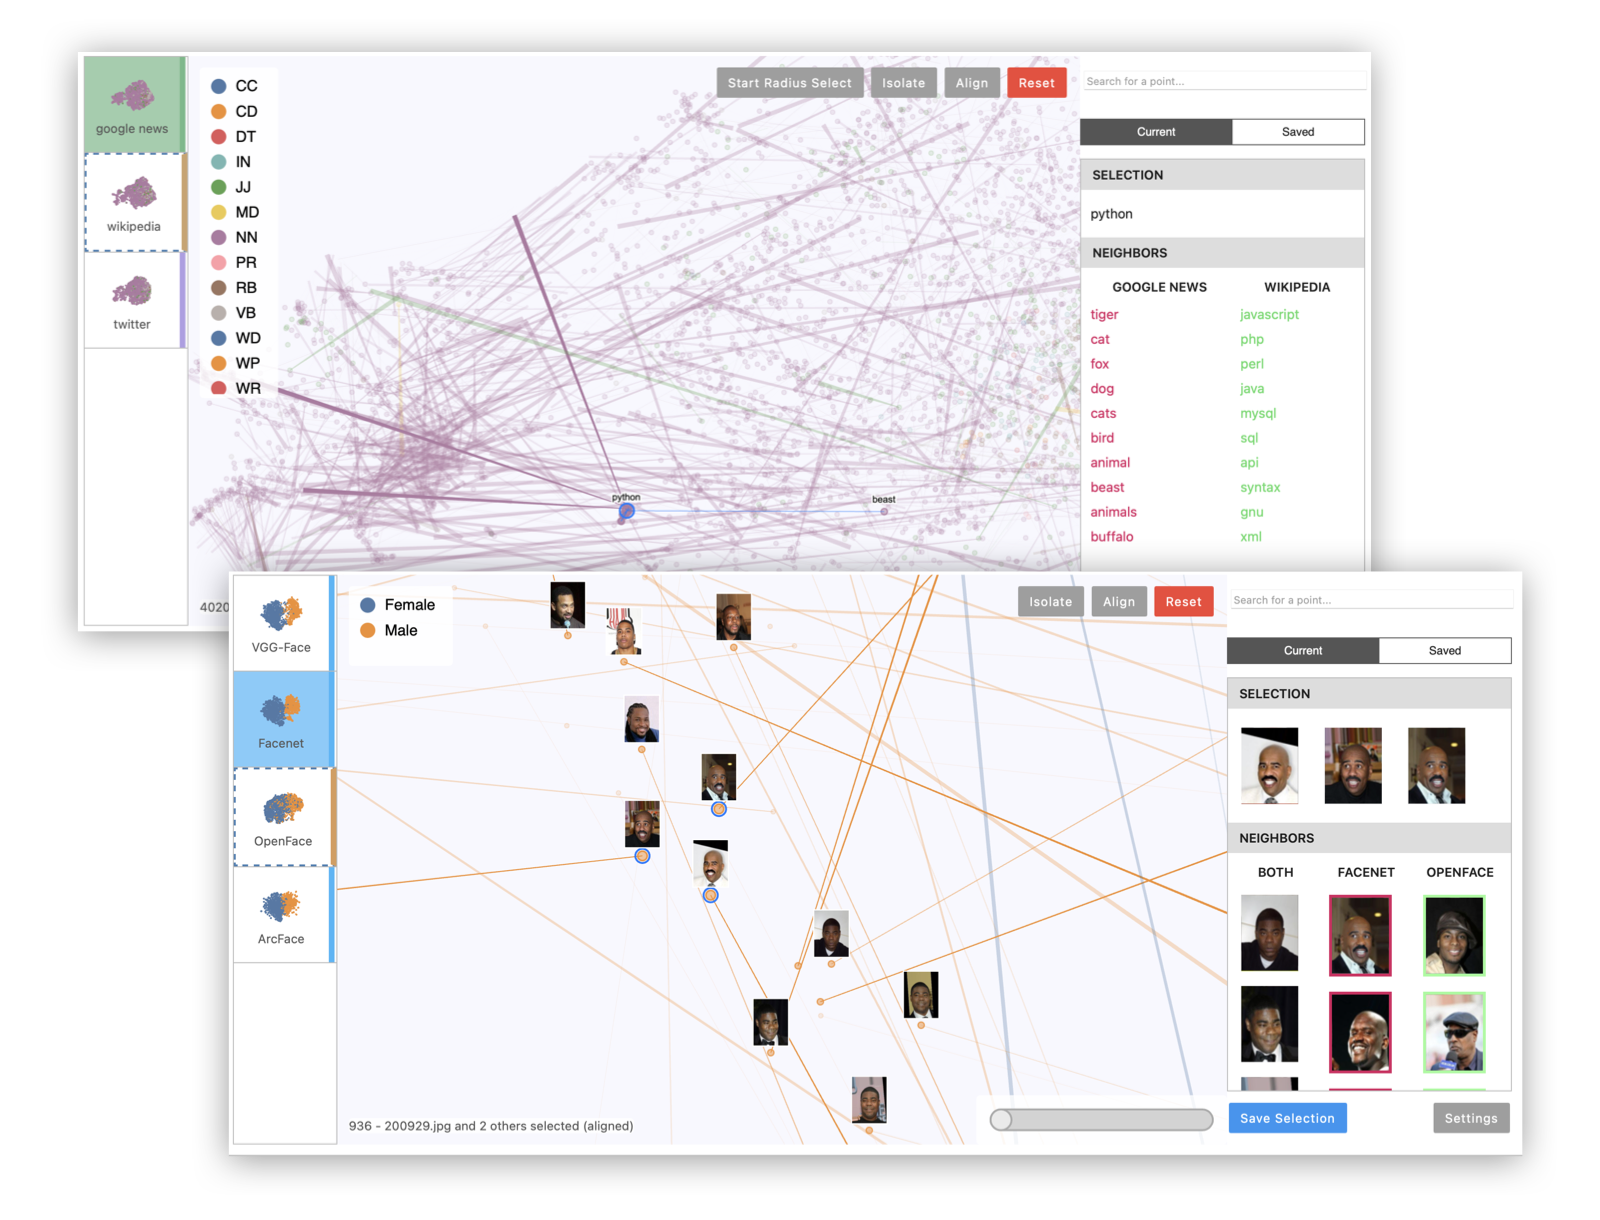
Emblaze - Interactive Embedding Comparison
Emblaze - Interactive Embedding Comparison Emblaze is a Jupyter notebook widget for visually comparing embeddings using animated scatter plots. It bun

Patching - Interactive Binary Patching for IDA Pro
Patching - Interactive Binary Patching for IDA Pro Overview Patching assembly code to change the behavior of an existing program is not uncommon in ma

Interactive Dashboard for Visualizing OSM Data Change
Dashboard and intuitive data downloader for more interactive experience with interpreting osm change data.
A Bayesian cognition approach for belief updating of correlation judgement through uncertainty visualizations
Overview Code and supplemental materials for Karduni et al., 2020 IEEE Vis. "A Bayesian cognition approach for belief updating of correlation judgemen
Ssl-tool - A simple interactive CLI wrapper around openssl to make creation and installation of self-signed certs easy
What's this? A simple interactive CLI wrapper around openssl to make self-signin
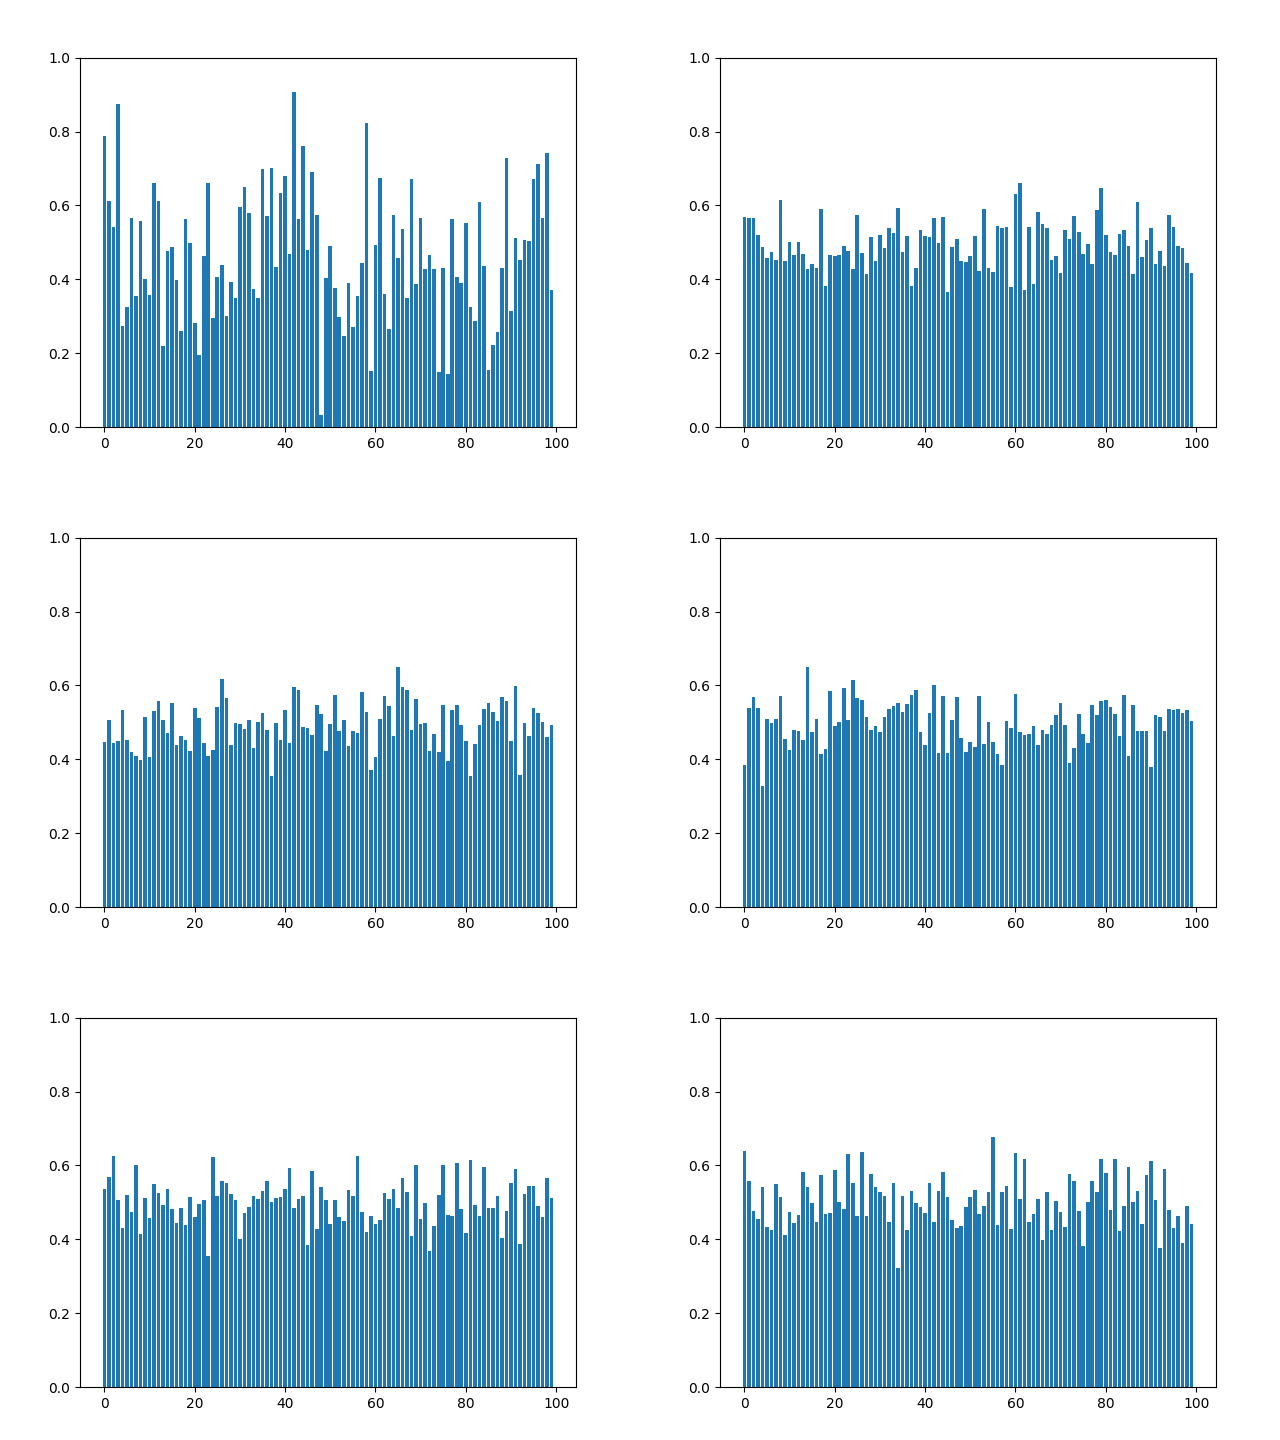
LabGraph is a a Python-first framework used to build sophisticated research systems with real-time streaming, graph API, and parallelism.
LabGraph is a a Python-first framework used to build sophisticated research systems with real-time streaming, graph API, and parallelism.
Code for Multimodal Neural SLAM for Interactive Instruction Following
Code for Multimodal Neural SLAM for Interactive Instruction Following Code structure The code is adapted from E.T. and most training as well as data p

Learning Time-Critical Responses for Interactive Character Control
Learning Time-Critical Responses for Interactive Character Control Abstract This code implements the paper Learning Time-Critical Responses for Intera

This repository contains source code for the Situated Interactive Language Grounding (SILG) benchmark
SILG This repository contains source code for the Situated Interactive Language Grounding (SILG) benchmark. If you find this work helpful, please cons

CVAT is free, online, interactive video and image annotation tool for computer vision
Computer Vision Annotation Tool (CVAT) CVAT is free, online, interactive video and image annotation tool for computer vision. It is being used by our

f-BRS: Rethinking Backpropagating Refinement for Interactive Segmentation
f-BRS: Rethinking Backpropagating Refinement for Interactive Segmentation [Paper] [PyTorch] [MXNet] [Video] This repository provides code for training

g9.py - Torch interactive graphics
g9.py - Torch interactive graphics A Torch toy in the browser. Demo at https://srush.github.io/g9py/ This is a shameless copy of g9.js, written in Pyt
Interactive Image Segmentation via Backpropagating Refinement Scheme
Won-Dong Jang and Chang-Su Kim, Interactive Image Segmentation via Backpropagating Refinement Scheme, CVPR 2019
Multi-modal Text Recognition Networks: Interactive Enhancements between Visual and Semantic Features
Multi-modal Text Recognition Networks: Interactive Enhancements between Visual and Semantic Features | paper | Official PyTorch implementation for Mul

This is a learning tool and exploration app made using the Dash interactive Python framework developed by Plotly
Support Vector Machine (SVM) Explorer This app has been moved here. This repo is likely outdated and will not be updated. This is a learning tool and
An interactive App to play with Spotify data, both from the Spotify Web API and from CSV datasets.
An interactive App to play with Spotify data, both from the Spotify Web API and from CSV datasets.
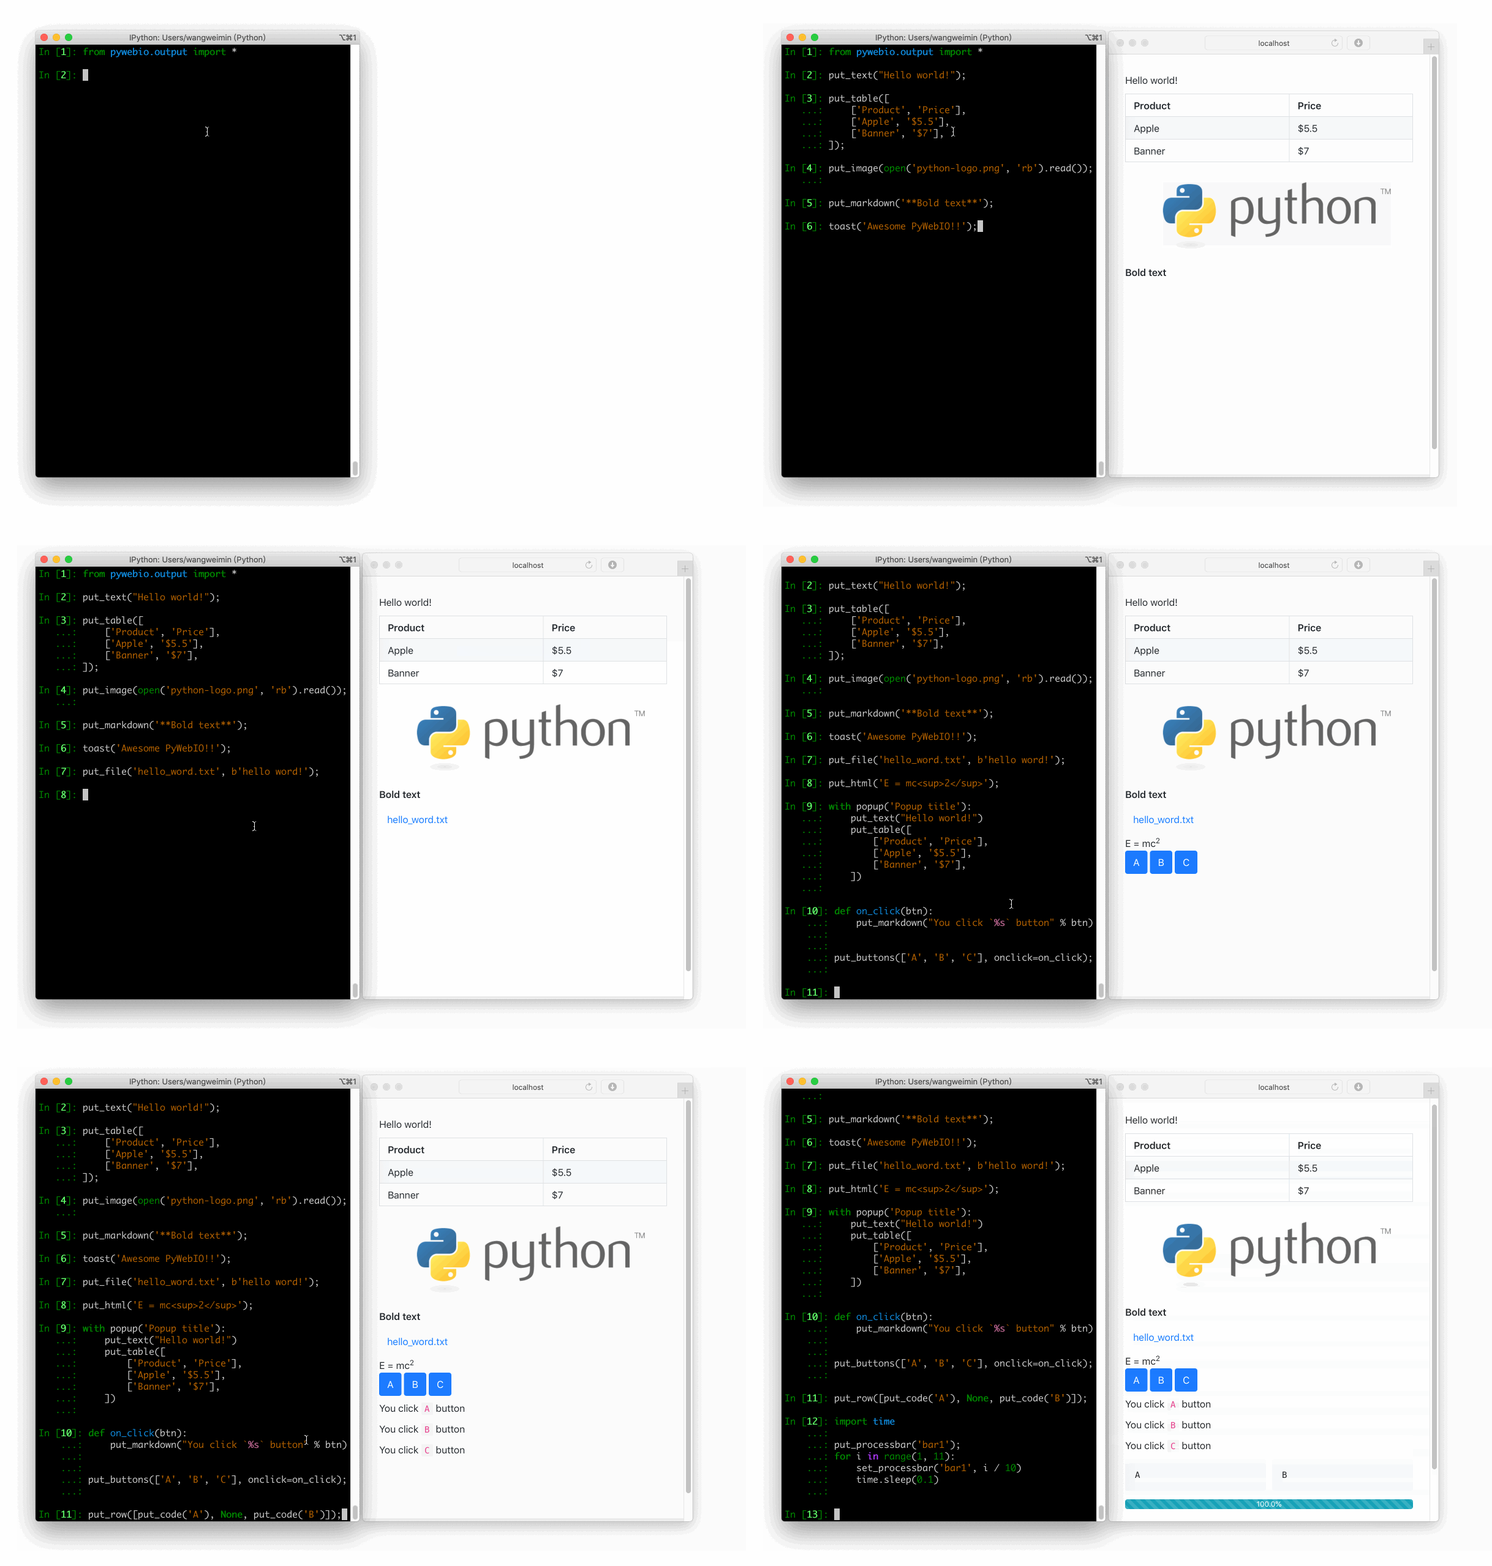
Write interactive web app in script way.
PyWebIO Write interactive web app in script way. [Document] | [Demos] | [Why PyWebIO?] English | 中文 PyWebIO provides a series of imperative functions

Python Interactive Mini Games
Python Interactive Mini Games Mini projects from Coursera's An Introduction to I
Fun interactive program to sort a list :)
LHD-Build-Sort-a-list Fun interactive program to sort a list :) Inspiration LHD Build Write a script to sort a list. What it does It is a menu driven
Generate daily updated visualizations of user and repository statistics from the GitHub API using GitHub Actions
Generate daily updated visualizations of user and repository statistics from the GitHub API using GitHub Actions for any combination of private and public repositories - dark mode supported
Unauthenticated Sqlinjection that leads to dump data base but this one impersonated Admin and drops a interactive shell
Unauthenticated Sqlinjection that leads to dump database but this one impersonated Admin and drops a interactive shell
Data aggregated from the reports found at the MCPS COVID Dashboard into a set of visualizations.
Montgomery County Public Schools COVID-19 Visualizer Contents About this project Data Support this project About this project Data All data we use can

This is RFA-Toolbox, a simple and easy-to-use library that allows you to optimize your neural network architectures using receptive field analysis (RFA) and create graph visualizations of your architecture.
ReceptiveFieldAnalysisToolbox This is RFA-Toolbox, a simple and easy-to-use library that allows you to optimize your neural network architectures usin
An interactive and multi-function Telegram bot, made especially for Telegram groups.
PyKorone An interaction and fun bot for Telegram groups, having some useful and other useless commands. Created as an experiment and learning bot but
ICSS - Interactive Continual Semantic Segmentation
Presentation This repository contains the code of our paper: Weakly-supervised c

A Simulation Environment to train Robots in Large Realistic Interactive Scenes
iGibson: A Simulation Environment to train Robots in Large Realistic Interactive Scenes iGibson is a simulation environment providing fast visual rend

Python Interactive Graphical System made during Computer Graphics classes (INE5420-2021.1)
PY-IGS - The PYthon Interactive Graphical System The PY-IGS Installation To install this software you will need these dependencies (with their thevelo

This repository contains small projects related to Neural Networks and Deep Learning in general.
ILearnDeepLearning.py Description People say that nothing develops and teaches you like getting your hands dirty. This repository contains small proje
An interactive DNN Model deployed on web that predicts the chance of heart failure for a patient with an accuracy of 98%
Heart Failure Predictor About A Web UI deployed Dense Neural Network Model Made using Tensorflow that predicts whether the patient is healthy or has c

BlockVis - Create beautiful visualizations of Bitcoin Blockheaders
BlockVis Create beautiful visualizations of Bitcoin Blockheaders How to run To r

Go from graph data to a secure and interactive visual graph app in 15 minutes. Batteries-included self-hosting of graph data apps with Streamlit, Graphistry, RAPIDS, and more!
✔️ Linux ✔️ OS X ❌ Windows (#39) Welcome to graph-app-kit Turn your graph data into a secure and interactive visual graph app in 15 minutes! Why This

A demonstration of using a live Tensorflow session to create an interactive face-GAN explorer.
Streamlit Demo: The Controllable GAN Face Generator This project highlights Streamlit's new hash_func feature with an app that calls on TensorFlow to
An interactive python script that enables root access on the T-Mobile (Wingtech) TMOHS1, as well as providing several useful utilites to change the configuration of the device.
TMOHS1 Root Utility Description An interactive python script that enables root access on the T-Mobile (Wingtech) TMOHS1, as well as providing several

Interactive dimensionality reduction for large datasets
BlosSOM 🌼 BlosSOM is a graphical environment for running semi-supervised dimensionality reduction with EmbedSOM. You can use it to explore multidimen
Python’s bokeh, holoviews, matplotlib, plotly, seaborn package-based visualizations about COVID statistics eventually hosted as a web app on Heroku
COVID-Watch-NYC-Python-Visualization-App Python’s bokeh, holoviews, matplotlib, plotly, seaborn package-based visualizations about COVID statistics ev
![[CVPR 2020] GAN Compression: Efficient Architectures for Interactive Conditional GANs](https://github.com/mit-han-lab/gan-compression/raw/master/imgs/teaser.png)
[CVPR 2020] GAN Compression: Efficient Architectures for Interactive Conditional GANs
GAN Compression project | paper | videos | slides [NEW!] GAN Compression is accepted by T-PAMI! We released our T-PAMI version in the arXiv v4! [NEW!]
SAT Project - The first project I had done at General Assembly, performed EDA, data cleaning and created data visualizations
Project 1: Standardized Test Analysis by Adam Klesc Overview This project covers: Basic statistics and probability Many Python programming concepts Pr

This interactive script demonstrates the Menezes-Vanstone-EC-Cryptosystem
Menezes-Vanstone-EC-Cryptosystem This interactive script demonstrates the Meneze
Earthengine-py-notebooks - A collection of 360+ Jupyter Python notebook examples for using Google Earth Engine with interactive mapping
earthengine-py-notebooks A collection of 360+ Jupyter Python notebook examples for using Google Earth Engine with interactive mapping Contact: Qiushen

The-Secret-Sharing-Schemes - This interactive script demonstrates the Secret Sharing Schemes algorithm
The-Secret-Sharing-Schemes This interactive script demonstrates the Secret Shari

Ghdl-interactive-sim - Interactive GHDL simulation of a VHDL adder using Python, Cocotb, and pygame
GHDL Interactive Simulation This is an interactive test bench for a simple VHDL adder. It uses GHDL to elaborate/run the simulation. It is coded in Py
Ecco is a python library for exploring and explaining Natural Language Processing models using interactive visualizations.
Visualize, analyze, and explore NLP language models. Ecco creates interactive visualizations directly in Jupyter notebooks explaining the behavior of Transformer-based language models (like GPT2, BERT, RoBERTA, T5, and T0).

web application for flight log analysis & review
Flight Review This is a web application for flight log analysis. It allows users to upload ULog flight logs, and analyze them through the browser. It

Visualize data of Vietnam's regions with interactive maps.
Plotting Vietnam Development Map This is my personal project that I use plotly to analyse and visualize data of Vietnam's regions with interactive map
Visualizations of some specific solutions of different differential equations.
Diff_sims Visualizations of some specific solutions of different differential equations. Heat Equation in 1 Dimension (A very beautiful and elegant ex
Generate visualizations of GitHub user and repository statistics using GitHubActions
GitHub Stats Visualization Generate visualizations of GitHub user and repository
Generate visualizations of GitHub user and repository statistics using GitHub Actions.
GitHub Stats Visualization Generate visualizations of GitHub user and repository statistics using GitHub Actions. This project is currently a work-in-
GUI for visualization and interactive editing of SMPL-family body models ie. SMPL, SMPL-X, MANO, FLAME.
Body Model Visualizer Introduction This is a simple Open3D-based GUI for SMPL-family body models. This GUI lets you play with the shape, expression, a
A search engine to query social media insights with political theme
social-insights Social insights is an open source big data project that generates insights about various interesting topics happening every day. Curre
GUI for visualization and interactive editing of SMPL-family body models ie. SMPL, SMPL-X, MANO, FLAME.
Body Model Visualizer Introduction This is a simple Open3D-based GUI for SMPL-family body models. This GUI lets you play with the shape, expression, a

YOPO is an interactive dashboard which generates various standard plots.
YOPO is an interactive dashboard which generates various standard plots.you can create various graphs and charts with a click of a button. This tool uses Dash and Flask in backend.
Command Line Manager + Interactive Shell for Python Projects
Manage Command Line Manager + Interactive Shell for Python Projects
Grimoire is a Python library for creating interactive fiction as hyperlinked html.
Grimoire Grimoire is a Python library for creating interactive fiction as hyperlinked html. Installation pip install grimoire-if Usage Check out the

Example Code Notebooks for Data Visualization in Python
This repository contains sample code scripts for creating awesome data visualizations from scratch using different python libraries (such as matplotli
A library for bridging Python and HTML/Javascript (via Svelte) for creating interactive visualizations
A library for bridging Python and HTML/Javascript (via Svelte) for creating interactive visualizations
Interactive Python interpreter for executing commands within Node.js
Python Interactive Interactive Python interpreter for executing commands within Node.js. This module provides a means of using the Python interactive
This is a python interactive story game that I made to show off what I've learnt in python coding for a month
Purpose The files in this repository are for that of a story game created with python version 3.8.5 The purpose of this project was to get familiar wi
The Delegate Network: An Interactive Voice Response Delegative Democracy Implementation of Liquid Democracy
The Delegate Network Overview The delegate network is a completely transparent, easy-to-use and understand version of what is sometimes called liquid

Standardized plots and visualizations in Python
Standardized plots and visualizations in Python pltviz is a Python package for standardized visualization. Routine and novel plotting approaches are f

The InterScript dataset contains interactive user feedback on scripts generated by a T5-XXL model.
Interscript The Interscript dataset contains interactive user feedback on a T5-11B model generated scripts. Dataset data.json contains the data in an

Source code for "Interactive All-Hex Meshing via Cuboid Decomposition [SIGGRAPH Asia 2021]".
Interactive All-Hex Meshing via Cuboid Decomposition Video demonstration This repository contains an interactive software to the PolyCube-based hex-me

Make scripted visualizations in blender
Scripted visualizations in blender The goal of this project is to script 3D scientific visualizations using blender. To achieve this, we aim to bring

Interactive chemical viewer for 2D structures of small molecules
👀 mols2grid mols2grid is an interactive chemical viewer for 2D structures of small molecules, based on RDKit. ➡️ Try the demo notebook on Google Cola
Create highly interactive web pages purely in Python
A package for building highly interactive user interfaces in pure Python inspired by ReactJS.

A dashboard built using Plotly-Dash for interactive visualization of Dex-connected individuals across the country.
Dashboard For The DexConnect Platform of Dexterity Global Working prototype submission for internship at Dexterity Global Group. Dashboard for real ti
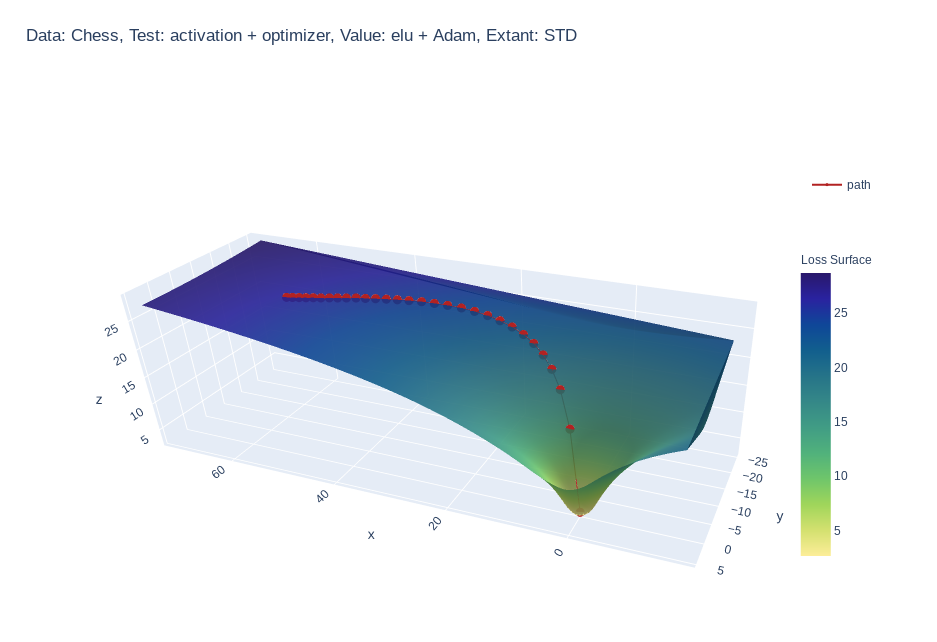
Create 3d loss surface visualizations, with optimizer path. Issues welcome!
MLVTK A loss surface visualization tool Simple feed-forward network trained on chess data, using elu activation and Adam optimizer Simple feed-forward

A concise grammar of interactive graphics, built on Vega.
Vega-Lite Vega-Lite provides a higher-level grammar for visual analysis that generates complete Vega specifications. You can find more details, docume

Grammar of Scalable Linked Interactive Nucleotide Graphics
Gosling.js Gosling.js is a declarative grammar for interactive (epi)genomics visualization on the Web. ⚠️ Please be aware that the grammar of Gosling.
Tiny Interactive File Transfer Application
TIFTA: Tiny Interactive File Transfer Application This repository holds all the source code, tests and documentation of the TIFTA software. The main g
Interactive Visualization to empower domain experts to align ML model behaviors with their knowledge.
An interactive visualization system designed to helps domain experts responsibly edit Generalized Additive Models (GAMs). For more information, check
Interactive web apps created using geemap and streamlit
geemap-apps Introduction This repo demostrates how to build a multi-page Earth Engine App using streamlit and geemap. You can deploy the app on variou

DISTIL: Deep dIverSified inTeractIve Learning.
DISTIL: Deep dIverSified inTeractIve Learning. An active/inter-active learning library built on py-torch for reducing labeling costs.

An interactive aquarium for your terminal.
sipedon An interactive aquarium for your terminal, written using pytermgui. The project got its name from the Common Watersnake, also known as Nerodia

Pytorch GUI(demo) for iVOS(interactive VOS) and GIS (Guided iVOS)
GUI for iVOS(interactive VOS) and GIS (Guided iVOS) GUI Implementation of CVPR2021 paper "Guided Interactive Video Object Segmentation Using Reliabili
Generate a backend and frontend stack using Python and json-ld, including interactive API documentation.
d4 - Base Project Generator Generate a backend and frontend stack using Python and json-ld, including interactive API documentation. d4? What is d4 fo
A Python package for caclulations and visualizations in geological sciences.
geo_calcs A Python package for caclulations and visualizations in geological sciences. Free software: MIT license Documentation: https://geo-calcs.rea
Generate visualizations of GitHub user and repository statistics using GitHub Actions.
GitHub Stats Visualization Generate visualizations of GitHub user and repository statistics using GitHub Actions. This project is currently a work-in-
Learning Convolutional Neural Networks with Interactive Visualization.
CNN Explainer An interactive visualization system designed to help non-experts learn about Convolutional Neural Networks (CNNs) For more information,

Turdshovel is an interactive CLI tool that allows users to dump objects from .NET memory dumps
Turdshovel Description Turdshovel is an interactive CLI tool that allows users to dump objects from .NET memory dumps without having to fully understa

An interactive grid for sorting, filtering, and editing DataFrames in Jupyter notebooks
qgrid Qgrid is a Jupyter notebook widget which uses SlickGrid to render pandas DataFrames within a Jupyter notebook. This allows you to explore your D

Pandas DataFrames and Series as Interactive Tables in Jupyter
Pandas DataFrames and Series as Interactive Tables in Jupyter Star Turn pandas DataFrames and Series into interactive datatables in both your notebook

Rule Extraction Methods for Interactive eXplainability
REMIX: Rule Extraction Methods for Interactive eXplainability This repository contains a variety of tools and methods for extracting interpretable rul
![Discovering Interpretable GAN Controls [NeurIPS 2020]](https://github.com/harskish/ganspace/raw/master/teaser.jpg)
Discovering Interpretable GAN Controls [NeurIPS 2020]
GANSpace: Discovering Interpretable GAN Controls Figure 1: Sequences of image edits performed using control discovered with our method, applied to thr
An interactive UMAP visualization of the MNIST data set.
Code for an interactive UMAP visualization of the MNIST data set. Demo at https://grantcuster.github.io/umap-explorer/. You can read more about the de