133 Repositories
Python navigation-dashboard Libraries
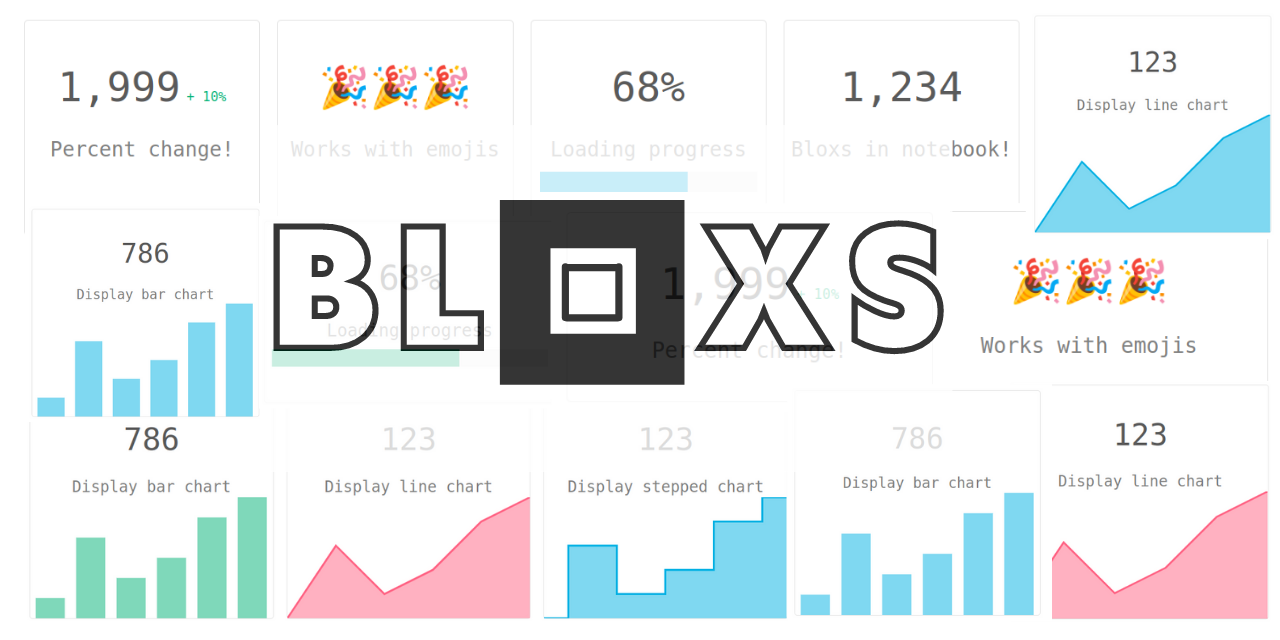
Display your data in an attractive way in your notebook!
Bloxs Bloxs is a simple python package that helps you display information in an attractive way (formed in blocks). Perfect for building dashboards, re
The most simple and minimalistic navigation dashboard.
Navigation This project follows a goal to have simple and lightweight dashboard with different links. I use it to have my own self-hosted service dash

A Power BI/Google Studio Dashboard to analyze previous OTC CatchUps
OTC CatchUp Dashboard A Power BI/Google Studio dashboard analyzing OTC CatchUps. File Contents * ├───data ├───old summaries ─── *.md ├

SQLAlchemy Admin for Starlette/FastAPI
SQLAlchemy Admin for Starlette/FastAPI SQLAdmin is a flexible Admin interface for SQLAlchemy models. Main features include: SQLAlchemy sync/async engi

Official implementation of "Learning Forward Dynamics Model and Informed Trajectory Sampler for Safe Quadruped Navigation" (RSS 2022)
Intro Official implementation of "Learning Forward Dynamics Model and Informed Trajectory Sampler for Safe Quadruped Navigation" Robotics:Science and
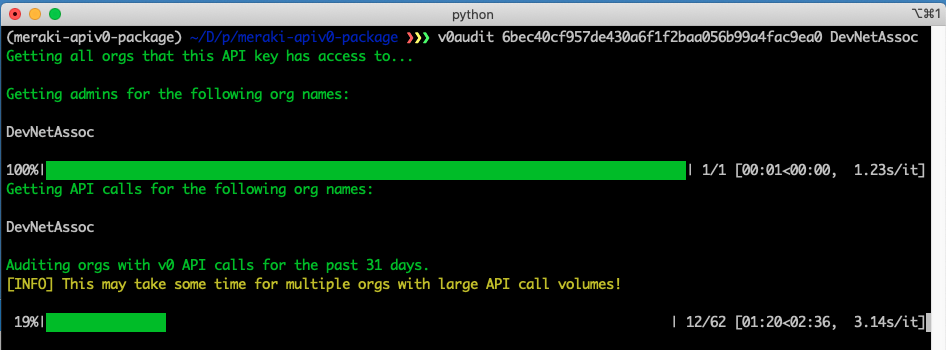
Meraki-apiv0-audit - CLI application that will export all Meraki Dashboard v0 API calls for one, multiple, or all Meraki Dashboard Organizations
Meraki Audit v0 API Requests (v0audit.py) (Note: this API key belongs to the Mer

dash-manufacture-spc-dashboard is a dashboard for monitoring read-time process quality along manufacture production line
In our solution based on plotly, dash and influxdb, the user will firstly generate the specifications for different robots, and then a wide range of interactive visualizations for different machines for machine power, machine cost, and total cost based on the energy time and total energy getting dynamically from sensors. If a threshold is met, the alert email is generated for further operation.

A particular navigation route using satellite feed and can help in toll operations & traffic managemen
How about adding some info that can quanitfy the stress on a particular navigation route using satellite feed and can help in toll operations & traffic management The current analysis is on the satellite image frame, but if we can add this info to a live feed it can help in developing smoother navigation systems based on real time traffic scenario
Dashboard to view a stock's basic information, RSI, Bollinger bands, EMA, SMA, sentiment analysis via Python
Your One And Only Trading Bot No seriously, we mean it! Contributors Jihad Al-Hussain John Gaffney Shanel Kuchera Kazuki Takehashi Patrick Thornquist

Interactive Dashboard for Visualizing OSM Data Change
Dashboard and intuitive data downloader for more interactive experience with interpreting osm change data.
Image-based Navigation in Real-World Environments via Multiple Mid-level Representations: Fusion Models Benchmark and Efficient Evaluation
Image-based Navigation in Real-World Environments via Multiple Mid-level Representations: Fusion Models Benchmark and Efficient Evaluation This reposi
SAAVN - Sound Adversarial Audio-Visual Navigation,ICLR2022 (In PyTorch)
SAAVN SAAVN Code release for paper "Sound Adversarial Audio-Visual Navigation,IC
A python script providing an idea of how a MindSphere application, e.g., a dashboard, can be displayed around the clock without the need of manual re-authentication on enforced session expiration
A python script providing an idea of how a MindSphere application, e.g., a dashboard, can be displayed around the clock without the need of manual re-authentication on enforced session expiration

Automatically capture your Ookla Speedtest metrics and display them in a Grafana dashboard
Speedtest All-In-One Automatically capture your Ookla Speedtest metrics and display them in a Grafana dashboard. Getting Started About This Code This
An app that allows you to add recipes from the dashboard made using DJango, JQuery, JScript and HTMl.
An app that allows you to add recipes from the dashboard. Then visitors filter based on different categories also each ingredient has a unique page with their related recipes.
Implemented Exploratory Data Analysis (EDA) using Python.Built a dashboard in Tableau and found that 45.87% of People suffer from heart disease.
Heart_Disease_Diagnostic_Analysis Objective 🎯 The aim of this project is to use the given data and perform ETL and data analysis to infer key metrics
Flask-Discord-Bot-Dashboard - A simple discord Bot dashboard created in Flask Python
Flask-Discord-Bot-Dashboard A simple discord Bot dashboard created in Flask Pyth
Use Perspective to create the chart for the trader’s dashboard
Task Overview | Installation Instructions | Link to Module 3 Introduction Experience Technology at JP Morgan Chase Try out what real work is like in t
Fixed waypoint(pose) navigation for turtlebot simulation.
Turtlebot-NavigationStack-Fixed-Waypoints fixed waypoint(pose) navigation for turtlebot simulation. Task Details Task Permformed using Navigation Stac
SuperSaaSFastAPI - Python SaaS Boilerplate for building Software-as-Service (SAAS) apps with FastAPI, Vue.js & Tailwind
Python SaaS Boilerplate for building Software-as-Service (SAAS) apps with FastAP

trade bot connected to binance API/ websocket.,, include dashboard in plotly dash to visualize trades and balances
Crypto trade bot 1. What it is Trading bot connected to Binance API. This project made for fun. So ... Do not use to trade live before you have backte
Data aggregated from the reports found at the MCPS COVID Dashboard into a set of visualizations.
Montgomery County Public Schools COVID-19 Visualizer Contents About this project Data Support this project About this project Data All data we use can
RARA: Zero-shot Sim2Real Visual Navigation with Following Foreground Cues
RARA: Zero-shot Sim2Real Visual Navigation with Following Foreground Cues FGBG (foreground-background) pytorch package for defining and training model

A head unit UI designed to replace the RTx/SMEG/RNEG/NG4/RCC/NAC
HeadUnit UI (Come discuss about it on our Discord!) Intro This is the UI part of a headunit project from OpenLeo, based on python and kivy, it looks l

Management Dashboard for Torchserve
Torchserve Dashboard Torchserve Dashboard using Streamlit Related blog post Usage Additional Requirement: torchserve (recommended:v0.5.2) Simply run:

Dashboard for the COVID19 spread
COVID-19 Data Explorer App A streamlit Dashboard for the COVID-19 spread. The app is live at: [https://covid19.cwerner.ai]. New data is queried from G

This MVP data web app uses the Streamlit framework and Facebook's Prophet forecasting package to generate a dynamic forecast from your own data.
📈 Automated Time Series Forecasting Background: This MVP data web app uses the Streamlit framework and Facebook's Prophet forecasting package to gene
Datapane is the easiest way to create data science reports from Python.
Datapane Teams | Documentation | API Docs | Changelog | Twitter | Blog Share interactive plots and data in 3 lines of Python. Datapane is a Python lib

Smarthome Dashboard with Grafana & InfluxDB
Smarthome Dashboard with Grafana & InfluxDB This is a complete overhaul of my Raspberry Dashboard done with Flask. I switched from sqlite to InfluxDB

Piccolo Admin provides a simple yet powerful admin interface on top of Piccolo tables
Piccolo Admin Piccolo Admin provides a simple yet powerful admin interface on top of Piccolo tables - allowing you to easily add / edit / filter your
A simply dashboard to view commodities position data based on CFTC reports
commodities-dashboard A simply dashboard to view commodities position data based on CFTC reports This is a python project using Dash and plotly to con
Implemented a Google Maps prototype that provides the shortest route in terms of distance
Implemented a Google Maps prototype that provides the shortest route in terms of distance, the fastest route, the route with the fewest turns, and a scenic route that avoids roads when provided a source and destination. The algorithms used were DFS, BFS, A*, and Iterative Depth First Search.

YOPO is an interactive dashboard which generates various standard plots.
YOPO is an interactive dashboard which generates various standard plots.you can create various graphs and charts with a click of a button. This tool uses Dash and Flask in backend.
Module to align code with thoughts of users and designers. Also magically handles navigation and permissions.
This readme will introduce you to Carteblanche and walk you through an example app, please refer to carteblanche-django-starter for the full example p
Make Your Company Data Driven. Connect to any data source, easily visualize, dashboard and share your data.
Redash is designed to enable anyone, regardless of the level of technical sophistication, to harness the power of data big and small. SQL users levera

Tmux Based Dropdown Dashboard For Python
sextans It's a private configuration and an ongoing experiment while I use Archlinux. A simple drop down dashboard based on tmux. It includes followin
A desktop application developed in Python with PyQt5 to predict demand and help monitor and schedule brewing processes for Barnaby's Brewhouse.
brewhouse-management A desktop application developed in Python with PyQt5 to predict demand and help monitor and schedule brewing processes for Barnab

Deep Reinforcement Learning based autonomous navigation for quadcopters using PPO algorithm.
PPO-based Autonomous Navigation for Quadcopters This repository contains an implementation of Proximal Policy Optimization (PPO) for autonomous naviga
Howell County, Missouri, COVID-19 data and (unofficial) estimates
COVID-19 in Howell County, Missouri This repository contains the daily data files used to generate my COVID-19 dashboard for Howell County, Missouri,

Simplest dashboard for WireGuard VPN written in Python w/ Flask
Hi! I'm planning the next major update for this project, please let me know if you have any suggestions or feature requests ;) You can create an issue

A dashboard for Raspberry Pi to display environmental weather data, rain radar, weather forecast, etc. written in Python
Weather Clock for Raspberry PI This project is a dashboard for Raspberry Pi to display environmental weather data, rain radar, weather forecast, etc.

Realtime Web Apps and Dashboards for Python and R
H2O Wave Realtime Web Apps and Dashboards for Python and R New! R Language API Build and control Wave dashboards using R! New! Easily integrate AI/ML

Easily configurable, chart dashboards from any arbitrary API endpoint. JSON config only
Flask JSONDash Easily configurable, chart dashboards from any arbitrary API endpoint. JSON config only. Ready to go. This project is a flask blueprint

Ballcone is a fast and lightweight server-side Web analytics solution.
Ballcone Ballcone is a fast and lightweight server-side Web analytics solution. It requires no JavaScript on your website. Screenshots Design Goals Si

An open source bike computer based on Raspberry Pi Zero (W, WH) with GPS and ANT+. Including offline map and navigation.
Pi Zero Bikecomputer An open-source bike computer based on Raspberry Pi Zero (W, WH) with GPS and ANT+ https://github.com/hishizuka/pizero_bikecompute

A dashboard built using Plotly-Dash for interactive visualization of Dex-connected individuals across the country.
Dashboard For The DexConnect Platform of Dexterity Global Working prototype submission for internship at Dexterity Global Group. Dashboard for real ti
Only works with the dashboard version / branch of jesse
Jesse optuna Only works with the dashboard version / branch of jesse. The config.yml should be self-explainatory. Installation # install from git pip

A dashboard for your code. A build system.
NOTICE: THIS REPO IS NO LONGER UPDATED Changes Changes is a build coordinator and reporting solution written in Python. The project is primarily built
🤖🧭Creates google-like navigation menu using python-telegram-bot wrapper
python telegram bot menu pagination Makes a google style pagination line for a list of items. In other words it builds a menu for navigation if you ha

This project is created to visualize the system statistics such as memory usage, CPU usage, memory accessible by process and much more using Kibana Dashboard with Elasticsearch.
System Stats Visualizer This project is created to visualize the system statistics such as memory usage, CPU usage, memory accessible by process and m
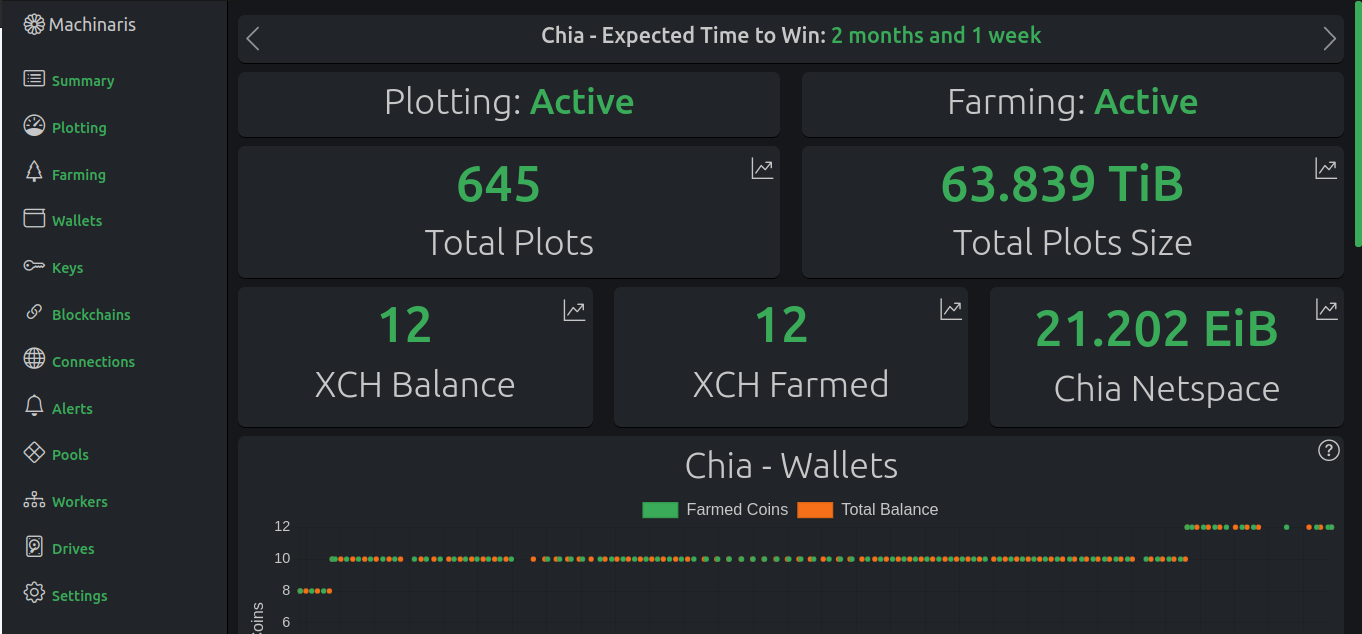
A Docker image for plotting and farming the Chia™ cryptocurrency on one computer or across many.
An easy-to-use WebUI for crypto plotting and farming. Offers Plotman, MadMax, Chiadog, Bladebit, Farmr, and Forktools in a Docker container. Supports Chia, Cactus, Chives, Flax, Flora, HDDCoin, Maize, N-Chain, Staicoin, and Stor among others.

Small Robot, with LIDAR and DepthCamera. Using ROS for Maping and Navigation
🤖 RoboCop 🤖 Small Robot, with LIDAR and DepthCamera. Using ROS for Maping and Navigation Made by Clemente Donoso, 📍 Chile 🇨🇱 RoboCop Lateral Fron

Code accompanying the NeurIPS 2021 paper "Generating High-Quality Explanations for Navigation in Partially-Revealed Environments"
Generating High-Quality Explanations for Navigation in Partially-Revealed Environments This work presents an approach to explainable navigation under

Eulera Dashboard is an easy and intuitive way to get a quick feel of what’s happening on the world’s market.
an easy and intuitive way to get a quick feel of what’s happening on the world’s market ! Eulera dashboard is a tool allows you to monitor historical
A simple cli utility for importing or exporting dashboard json definitions using the Grafana HTTP API.
grafana-dashboard-manager A simple cli utility for importing or exporting dashboard json definitions using the Grafana HTTP API. This may be useful fo
A dashboard for your Terminal written in the Python 3 language,
termDash is a handy little program, written in the Python 3 language, and is a small little dashboard for your terminal, designed to be a utility to help people, as well as helping new users get used to the terminal.
Python script to clone SQL dashboard from one workspace to another
Databricks dashboard clone Unofficial project to allow Databricks SQL dashboard copy from one workspace to another. Resource clone Setup: Create a fil

An interactive dashboard for visualisation, integration and classification of data using Active Learning.
AstronomicAL An interactive dashboard for visualisation, integration and classification of data using Active Learning. AstronomicAL is a human-in-the-
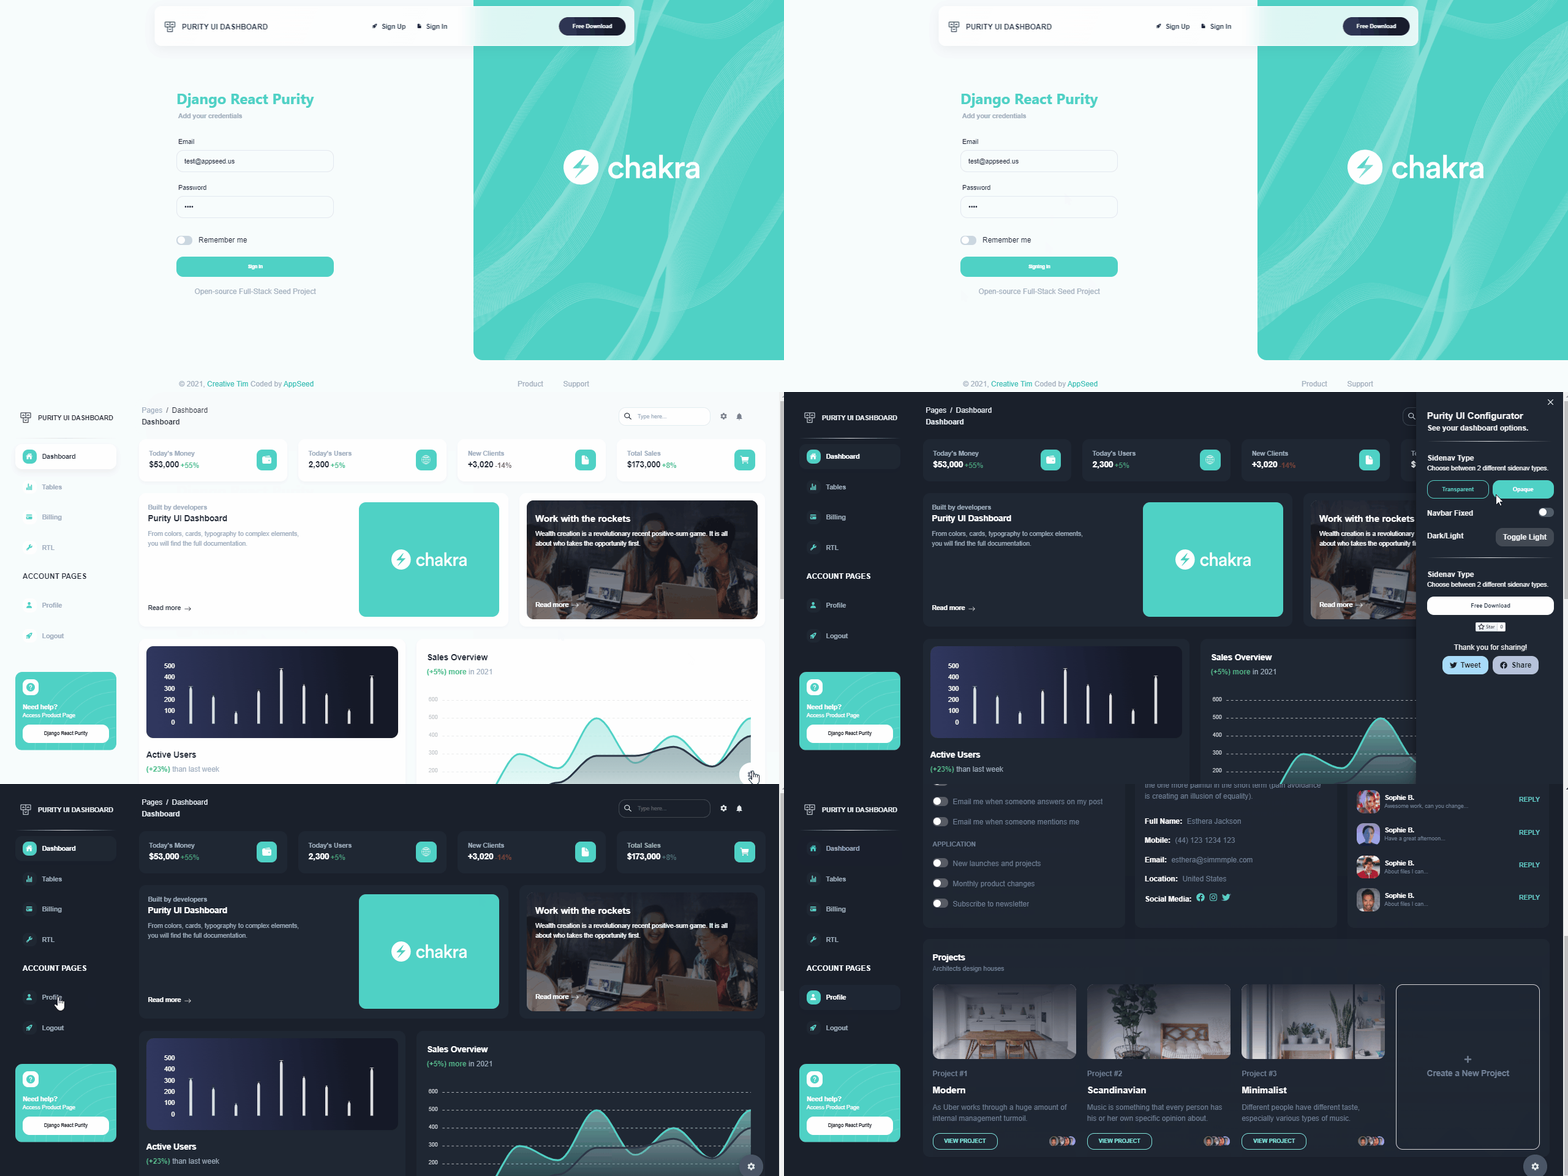
Django React - Purity Dashboard (Open-Source) | AppSeed
Django React Purity Dashboard Start your Development with an Innovative Admin Template for Chakra UI and React. Purity UI Dashboard is built with over

History Aware Multimodal Transformer for Vision-and-Language Navigation
History Aware Multimodal Transformer for Vision-and-Language Navigation This repository is the official implementation of History Aware Multimodal Tra

LEOGPS - Satellite Navigation with GPS on Python!
LEOGPS is an open-source Python software which performs relative satellite navigation between two formation flying satellites, with the objective of high accuracy relative positioning. Specifically, LEOGPS solves for the double-differenced baseline (using float ambiguity resolution) between satellites flying in formation in Low Earth Orbit (LEO).

Dashboard to monitor the performance of your Binance Futures account
futuresboard A python based scraper and dashboard to monitor the performance of your Binance Futures account. Note: A local sqlite3 database config/fu

History Aware Multimodal Transformer for Vision-and-Language Navigation
History Aware Multimodal Transformer for Vision-and-Language Navigation This repository is the official implementation of History Aware Multimodal Tra

Investigating automatic navigation towards standard US views integrating MARL with the virtual US environment developed in CT2US simulation
AutomaticUSnavigation Investigating automatic navigation towards standard US views integrating MARL with the virtual US environment developed in CT2US
Python script to download entire campaign images and navigation.
Squidle campaign downloader Python script to download entire campaign images and navigation. usage: squidle_campaign_downloader.py [-h] [--api-token A
Autonomous Ground Vehicle Navigation and Control Simulation Examples in Python
Autonomous Ground Vehicle Navigation and Control Simulation Examples in Python THIS PROJECT IS CURRENTLY A WORK IN PROGRESS AND THUS THIS REPOSITORY I
dashboard to track crypto prices and change via the coinmarketcap APIs
crypto-dashboard Dashboard to track crypto prices and change via the coinmarketcap APIs. Uses chart.js and ag-grid. Requirements: python 3 (was writte

A System Metrics Monitoring Tool Built using Python3 , rabbitmq,Grafana and InfluxDB. Setup using docker compose. Use to monitor system performance with graphical interface of grafana , storage of influxdb and message queuing of rabbitmq
SystemMonitoringRabbitMQGrafanaInflux This repository has code to setup a system monitoring tool The tools used are the follows Python3.6 Docker Rabbi

Stock Analysis dashboard Using Streamlit and Python
StDashApp Stock Analysis Dashboard Using Streamlit and Python If you found the content useful and want to support my work, you can buy me a coffee! Th

Fast, Attemptable Route Planner for Navigation in Known and Unknown Environments
FAR Planner uses a dynamically updated visibility graph for fast replanning. The planner models the environment with polygons and builds a global visi

Deep Reinforcement Learning for mobile robot navigation in ROS Gazebo simulator
DRL-robot-navigation Deep Reinforcement Learning for mobile robot navigation in ROS Gazebo simulator. Using Twin Delayed Deep Deterministic Policy Gra
Ever wanted a dashboard for making your antispam? This is it.
Ever wanted a dashboard for making your antispam? This is it.

iot-dashboard: Fully integrated architecture platform with a dashboard for Logistics Monitoring, Internet of Things.
Fully integrated architecture platform with a dashboard for Logistics Monitoring, Internet of Things. Written in Python. Flask applicati

stonky is a simple command line dashboard for monitoring stocks.
stonky is a simple command line dashboard for monitoring stocks.

An interactive dashboard built with python that enables you to visualise how rent prices differ across Sweden.
sweden-rent-dashboard An interactive dashboard built with python that enables you to visualise how rent prices differ across Sweden. The dashboard/web

aiohttp admin is generator for admin interface based on aiohttp
aiohttp admin is generator for admin interface based on aiohttp

fastapi-admin is a fast admin dashboard based on FastAPI and TortoiseORM with tabler ui, inspired by Django admin.
fastapi-admin is a fast admin dashboard based on FastAPI and TortoiseORM with tabler ui, inspired by Django admin.
Repo for EchoVPR: Echo State Networks for Visual Place Recognition
EchoVPR Repo for EchoVPR: Echo State Networks for Visual Place Recognition Currently under development Dirs: data: pre-collected hidden representation

Simulation artifacts, core components and configuration files to integrate AWS DeepRacer device with ROS Navigation stack.
AWS DeepRacer Overview The AWS DeepRacer Evo vehicle is a 1/18th scale Wi-Fi enabled 4-wheel ackermann steering platform that features two RGB cameras

A lightweight, hub-and-spoke dashboard for multi-account Data Science projects
A lightweight, hub-and-spoke dashboard for cross-account Data Science Projects Introduction Modern Data Science environments often involve many indepe

2D waypoints will be predefined in ROS based robots to navigate to the destination avoiding obstacles.
A number of 2D waypoints will be predefined in ROS based robots to navigate to the destination avoiding obstacles.

Vision-and-Language Navigation in Continuous Environments using Habitat
Vision-and-Language Navigation in Continuous Environments (VLN-CE) Project Website — VLN-CE Challenge — RxR-Habitat Challenge Official implementations

The Main Pythonic Version Of Twig Using Nextcord
The Main Pythonic Version Of Twig Using Nextcord

Extract data from ThousandEyes REST API and visualize it on your customized Grafana Dashboard.
ThousandEyes Grafana Dashboard Extract data from the ThousandEyes REST API and visualize it on your customized Grafana Dashboard. Deploy Grafana, Infl
django-dashing is a customisable, modular dashboard application framework for Django to visualize interesting data about your project. Inspired in the dashboard framework Dashing
django-dashing django-dashing is a customisable, modular dashboard application framework for Django to visualize interesting data about your project.

An improved django-admin-tools dashboard for Django projects
django-fluent-dashboard The fluent_dashboard module offers a custom admin dashboard, built on top of django-admin-tools (docs). The django-admin-tools
Extends the Django Admin to include a extensible dashboard and navigation menu
django-admin-tools django-admin-tools is a collection of extensions/tools for the default django administration interface, it includes: a full feature

Responsive Theme for Django Admin With Sidebar Menu
Responsive Django Admin If you're looking for a version compatible with Django 1.8 just install 0.3.7.1. Features Responsive Sidebar Menu Easy install
Goddard Image Analysis and Navigation Tool
Copyright 2021 United States Government as represented by the Administrator of the National Aeronautics and Space Administration. No copyright is clai
Stock Market Insights is a Dashboard that gives the 360 degree view of the particular company stock
Stock Market Insights is a Dashboard that gives the 360 degree view of the particular company stock.It extracts specific data from multiple sources like Social Media (Twitter,Reddit ,StockTwits) , News Articles and applies NLP techniques to get sentiments and insights.
An open source CMS, in python and integrable in Django
Python CMS based on the Django Framework

Pathdreamer: A World Model for Indoor Navigation
Pathdreamer: A World Model for Indoor Navigation This repository hosts the open source code for Pathdreamer, to be presented at ICCV 2021. Paper | Pro

Streamlit Tutorial (ex: stock price dashboard, cartoon-stylegan, vqgan-clip, stylemixing, styleclip, sefa)
Streamlit Tutorials Install pip install streamlit Run cd [directory] streamlit run app.py --server.address 0.0.0.0 --server.port [your port] # http:/
This project is a proof of concept to create a dashboard using Dash to display information about various cryptocurrencies.
This project is a WIP as a way to display useful information about cryptocurrencies. It's currently being actively developed as a proof of concept, and a way to visualize more useful data about various cryptocurrencies.

The Surprising Effectiveness of Visual Odometry Techniques for Embodied PointGoal Navigation
PointNav-VO The Surprising Effectiveness of Visual Odometry Techniques for Embodied PointGoal Navigation Project Page | Paper Table of Contents Setup

An example of a chatbot with a number-based menu that can be used as a starting point for a project.
NumMenu Bot NumMenu Bot is an example chatbot showing a way to design a number-based menu assistant with Rasa. This type of bot is very useful on plat
Scraping Thailand COVID-19 data from the DDC's tableau dashboard
Scraping COVID-19 data from DDC Dashboard Scraping Thailand COVID-19 data from the DDC's tableau dashboard. Data is updated at 07:30 and 08:00 daily.
improvement of CLIP features over the traditional resnet features on the visual question answering, image captioning, navigation and visual entailment tasks.
CLIP-ViL In our paper "How Much Can CLIP Benefit Vision-and-Language Tasks?", we show the improvement of CLIP features over the traditional resnet fea

Pytorch code for ICRA'21 paper: "Hierarchical Cross-Modal Agent for Robotics Vision-and-Language Navigation"
Hierarchical Cross-Modal Agent for Robotics Vision-and-Language Navigation This repository is the pytorch implementation of our paper: Hierarchical Cr

Python library to decrypt Airtag reports, as well as a InfluxDB/Grafana self-hosted dashboard example
Openhaystack-python This python daemon will allow you to gather your Openhaystack-based airtag reports and display them on a Grafana dashboard. You ca